Abstract
The need to determine occupational exposure to bioaerosols has notably increased in the past decade, especially for microbiology-related workplaces and laboratories. Recently, two new cyclone-based personal bioaerosol samplers were developed by the National Institute for Occupational Safety and Health (NIOSH) in the USA and the Research Center for Toxicology and Hygienic Regulation of Biopreparations (RCT & HRB) in Russia to monitor bioaerosol exposure in the workplace. Here, a series of wind tunnel experiments were carried out to evaluate the physical sampling performance of these two samplers in moving air conditions, which could provide information for personal biological monitoring in a moving air environment. The experiments were conducted in a small wind tunnel facility using three wind speeds (0.5, 1.0 and 2.0 m s−1) and three sampling orientations (0°, 90°, and 180°) with respect to the wind direction. Monodispersed particles ranging from 0.5 to 10 μm were employed as the test aerosols. The evaluation of the physical sampling performance was focused on the aspiration efficiency and capture efficiency of the two samplers. The test results showed that the orientation-averaged aspiration efficiencies of the two samplers closely agreed with the American Conference of Governmental Industrial Hygienists (ACGIH) inhalable convention within the particle sizes used in the evaluation tests, and the effect of the wind speed on the aspiration efficiency was found negligible. The capture efficiencies of these two samplers ranged from 70% to 80%. These data offer important information on the insight into the physical sampling characteristics of the two test samplers.
Introduction
A wide range of local respiratory system complications (such as asthma, bronchitis, and mucous membrane irritation) may occur as a result of bioaerosol exposure in the workplace.1 Thus, it is important to employ suitable methods for monitoring occupational exposure to bioaerosols in workplaces to ensure a sanitary occupational environment for workers.2 Compared to the common airborne particles in working environments, bioaerosols (airborne microorganisms) are unique due to their viable characteristics. Therefore, special sampling approaches are needed for sampling these airborne microorganisms to maintain their viability. In addition, the collection medium of an ideal bioaerosol sampler should be able to easily facilitate the subsequent post-sampling microbial analyses.
Many personal samplers have been employed for bioaerosol sampling over the years. However, most early personal bioaerosol samplers were either directly applied or slightly modified versions of the existing personal samplers used for inert aerosols.3–5 These earlier personal bioaerosol samplers were found to be inefficient in collecting viable bioaerosols because traditional approaches for sampling inert aerosols often rely on filter samplers, impingers, or impactors, which can negatively impact microbial viability during the sampling process.6 Due to these limitations, it is necessary to develop new personal bioaerosol samplers that use unconventional methods to collect bioaerosols while maintaining an acceptable microbial survivability to accurately assess personal bioaerosol exposure in the workplace. For this reason, new bioaerosol samplers such as BioSampler®,7 NIOSH one-stage Bioaerosol Cyclone,8 CIP 10-M,9 NIOSH two-stage cyclone,10 Coriolis®,11 WWC,12 and PAS-5 by RCT & HRB were developed.13 These personal bioaerosol samplers all use swirling air and centrifugal force to capture bioaerosols into a liquid (aerosol-to-hydrosol),14 and have been proven to provide reliable sampling data in certain controlled sampling environments.
Environmental impact.
Performing personal bioaerosol monitoring is essential for assessing workers’ exposure to airborne microorganisms such as bacteria, viruses, and fungal spores in associated working environments. Having a high-efficiency personal bioaerosol sampler is critical to accurately collect the bioaerosols in the environment. Recently, two cyclone-based personal bioaerosol samplers were designed for providing representative workplace personal bioaerosol sampling. This study evaluated the performance of these two newly developed samplers in a moving air environment in terms of their physical sampling efficiencies. The test results obtained from this study can offer insight into the efficiencies of general cyclone-based personal bioaerosol samplers, and can be utilized as a reference for improving other personal aerosol samplers to provide more reliable sampling data.
Among these bioaerosol samplers indicated above, the NIOSH one-stage Bioaerosol Cyclone (BC) and the RCT & HRB personal aerosol samplers (PAS-5) have many features in common in terms of the sampling method, sampler body dimension, the materials the samplers are made of, and most importantly, both samplers were designed for personal bio-aerosol sampling. To date, these two samplers have been evaluated for the physical and biological sampling performance in a calm air environment, but have not been tested in moving air environments.8,13 It is well known that a full performance evaluation for a newly developed personal bioaerosol sampler should involve a biological sampling evaluation in a moving air environment for assessing the performance of the sampler in environments similar to realistic working environments. For this reason, these two samplers were selected by our laboratory for a biological sampling evaluation in a wind tunnel. Prior to the evaluation tests, data regarding the physical sampling performance of these two test samplers in the same moving air environment need to be acquired as indispensable baseline information. Therefore, the purpose of this study is to conduct a series of wind tunnel experiments to evaluate the physical sampling performance of these two samplers in moving air conditions. The performance evaluation was focused on obtaining the aspiration efficiency and capture efficiency of these two personal bioaerosol samplers, as well as the effects of sampling orientations, wind speeds, and test aerosol sizes on these efficiencies. The aspiration efficiency is defined as the efficiency at which the aerosols in ambient air are transported into the sampler body. The capture efficiency in this study is defined as the efficiency at which the aerosols are aspired into the sampler and collected onto the collection medium. Examining the aspiration efficiency for a newly developed aerosol sampler is important because it shows the ability of the sampler in collecting representative data from the sampling environment. In this evaluation test, the aspiration efficiencies of these two samplers obtained were compared with the convention curve of IPM defined by the American Conference of Governmental Industrial Hygienists (ACGIH).15 In addition, determining the capture efficiency for a newly developed personal bioaerosol sampler is also essential, since the capture efficiency indicates the fraction of the sampled bioaerosols that is useful for subsequent microbial analysis.
Methods
Test samplers
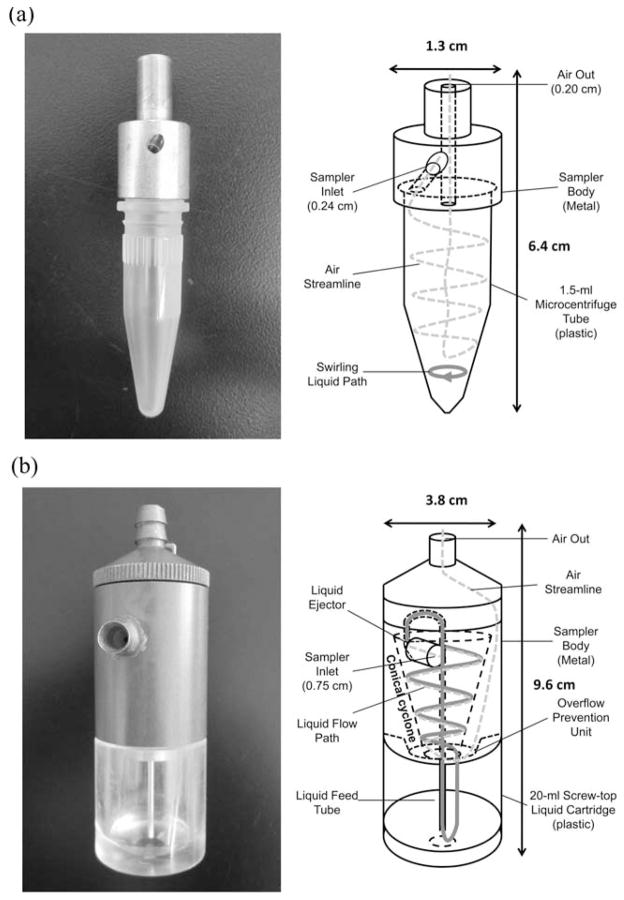
The two test samplers in this evaluation were designed using the principle of a cyclone. As previously mentioned, both samplers have been evaluated in a mixing chamber, but have not been studied in a wind tunnel. Fig. 1 shows the schematic diagram of the test personal bioaerosol samplers. The BC personal bioaerosol sampler (Fig. 1a) was developed by the Health Effects Laboratory Division of NIOSH, Morgantown, WV.8 The BC sampler is 6.4 cm in height by 1.3 cm in width, and has a 0.24 cm sampling inlet diameter. It uses a 1.5 ml microcentrifuge tube to generate the cyclone and can be operated at 2 to 4 l min−1. The microcentrifuge tube acts as the collection receptacle which allows collected bioaerosol samples to be directly analyzed by molecular assays such as PCR (polymerase chain reactions) and ELISA (enzyme-linked immunosorbent assays) without transferring the sample. Other design advantages of the BC sampler are that it is small, inexpensive, and easily fabricated.
Fig. 1.
Schematic diagram of the test personal bioaerosol samplers: (a) NIOSH BC and (b) RCT & HRB PAS-5.
The schematic diagram of PAS-5 is shown in Fig. 1b. Research on designing and manufacturing this sampler was done at the Research Centre for Toxicology and Hygienic Regulation of Biopreparations (RCT & HRB) in Serpukhov, Russia. This personal bioaerosol sampler incorporates a recirculating liquid film on the inside wall of the cyclone installed and was originally invented by Olenin.16 The PAS-5 sampler is an improved version of its predecessor.13,17 As shown in Fig. 1b, the PAS-5 sampler has a column-like body that is 9.6 cm in height by 3.8 cm in width. The major difference between the PAS-5 sampler and its predecessors is that the conical cyclone in the PAS-5 sampler is oriented vertically instead of horizontally. The PAS-5 sampler has a 0.75 cm diameter inlet (inwardly narrowing to 0.15 cm) and can be operated for about 200 min with 13 ml of distilled water in its 20 ml capacity liquid cartridge at a sampling flow rate of 10 l min−1.
The rationale for using the centrifugal force generated by a cyclone-based sampler to collect bioaerosols is as follows: when the sampling air passes the sampler inlet, it is guided to the cyclone installed inside the sampler and enters the cyclone tangentially. In this way, an air vortex is created inside the cyclone. Depending on their inertia, bioaerosols entering the sampler with the sampling air may contact the wall of the cyclone due to the centrifugal force generated by the vortex. For the BC sampler, the bioaerosols touching the wall of the cyclone (microcentrifuge tube) will remain on the wall (the BC sampler can be operated with or without the liquid added to the microcentrifuge tube; therefore, if the liquid is added to the tube, some bioaerosols will also be collected in the liquid added at the bottom of the tube), and the whole microcentrifuge tube containing the bioaerosols can then be used by bioanalytical instruments for microbiological analysis. In the PAS-5 sampler, the bioaerosols following the air flow toward the cyclone wall will be captured by the recirculating liquid film on the wall, and then be transported to the liquid cartridge at the bottom of the sampler. The bioaerosols contained in the collection liquid in the cartridge can then be used for post-sampling analyses, such as the standard culture and colony enumeration method.
Small wind tunnel
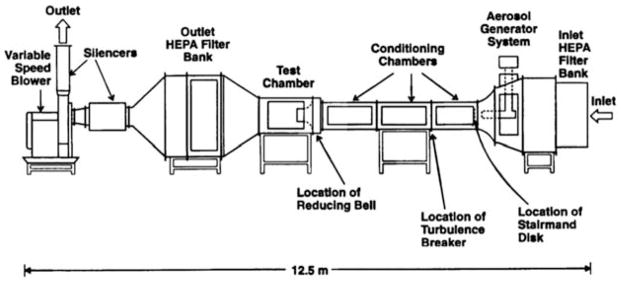
A small wind tunnel facility was chosen for conducting the performance evaluation tests based on the fact that it can generate a well-defined moving air profile, and economize the amount of the inert aerosols used in the current study and the bioaerosols in the future study. The scientific basis for using a small wind tunnel to evaluate the performance of personal samplers has been well established and widely applied in many health-related personal aerosol sampler studies.18–20 Fig. 2 shows the schematic diagram of the small wind tunnel used in this evaluation. The wind tunnel is constructed of stainless steel for easy cleaning and interior corrosion prevention. The total length of the wind tunnel is 12.5 m, and the air-flow arrangement for the wind tunnel is an open-loop design. There are several functional sections in this wind tunnel and each section is supported by a steel frame. When operating the wind tunnel, room air is drawn into the tunnel by a 45-horse power, variable-speed blower. The blower is monitored and stabilized by a digital frequency controller. The incoming air first passes through a 1.4 × 1.4 m2 high efficiency particulate air (HEPA) filter bank in the inlet. Following the filter module at the entrance, there is an aerosol generation chamber. This is where the aerosolized test particles are added to the air stream. The aerosols and air are then mixed by a Stairmand disk and three flow-conditioning chambers. Each flow-conditioning chamber is 1.2 m long and 0.6 × 0.6 m2 in cross-sectional area. These flow-conditioning chambers function to reduce turbulence, straighten the flow, and mix the test aerosols and air uniformly before they enter the test chamber of the wind tunnel. The test chamber of the wind tunnel is 1.4 m long and has a 0.76 × 0.76 m2 cross-sectional area equipped with a clear polycarbonate window that allows the investigator to observe test processes. At the entrance of the test chamber, there is a 0.3 m long, bell-shaped inlet that enhances the uniformity of the air velocity in the test chamber. At the test chamber outlet, there is another series of HEPA filter banks installed to ensure that the air released back into the room is free of particles.
Fig. 2.
The small wind tunnel facility at Lovelace Respiratory Research Institute (showing individually labeled components).
Test aerosols
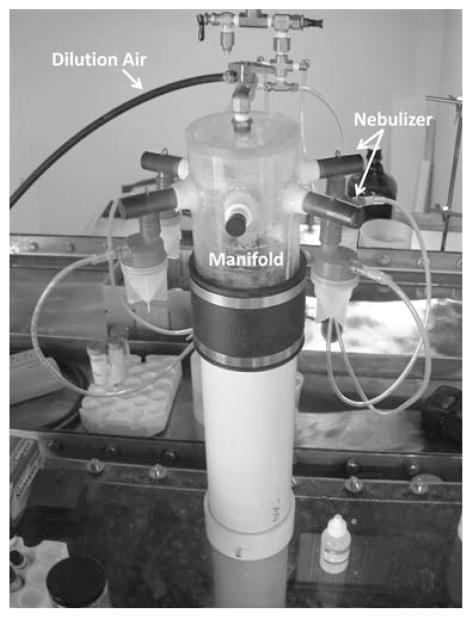
Fluorescent polystyrene latex (PSL) particles (Thermo Fisher Scientific Inc., Waltham, MA) were used in this evaluation as the test aerosols for acquiring the aspiration efficiencies of the two test personal samplers. The sizes of the test aerosols were 0.5, 2, 5, and 10 μm diameter, which cover the size range of most bacteria and general fungal spores. Bacteria and fungal spores are known to be the two most common bioaerosols in the environment.21 The test aerosols were generated by four medication nebulizers (Up-Mist, Hospitak Inc., Farmingdale, NY). These nebulizers were connected to a manifold located on the top of the aerosol generation chamber (Fig. 3). Diluted air was used to accelerate liquid droplet evaporation and also to help transport the aerosols to the center of the wind tunnel. The monodispersed aerosols were passed through a Kr85 neutralizer before being introduced into the main air stream in the wind tunnel.
Fig. 3.
Test aerosol generation system.
Experimental setup and procedure
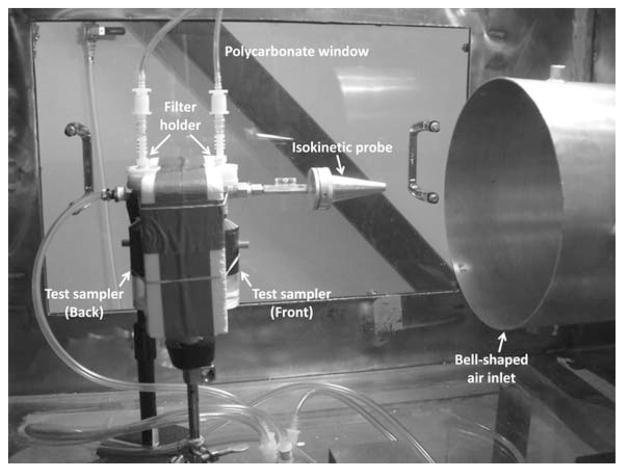
The wind tunnel experiments were conducted at three wind speeds (0.5, 1.0, and 2.0 m s−1) to simulate wind velocities that workers might encounter in various workplaces.22 Three sampling orientations with respect to the wind direction were used to represent the conditions of a personal sampler in typical occupational environments.23 The three orientations were with the sampler facing directly into the wind (0°), perpendicular to the wind (90°), and directly opposed to the wind (180°). The personal samplers were installed on a polystyrene board supported by a laboratory stand in the test chamber to simulate personal samplers worn on a worker’s body.20,24 For each test run, two identical samplers were placed on both sides of the polystyrene board. The flow rate used for operating the BC sampler was 2 l min−1, and 0.3 ml deionized water was added to the microcentrifuge tube. The flow rate used for the PAS-5 sampler was 10 l min−1 with 8 ml deionized water in its liquid cartridge. The outlets of both samplers were connected to individual 25 mm filter holders with a cellulose filter (TE-1441-025, TISCH Environmental Inc., Cleves, OH) for collecting aerosols passing through the entire sampler. One conical-shaped, sharp-edged isokinetic probe was placed in the test chamber close to the opening of the bell-shaped air inlet for obtaining representative aerosol concentration in the test chamber. The isokinetic probe used a 47 mm polycarbonate membrane filter (Isopore™, Millipore Corp., Billerica, MA) for collecting the test aerosols, and the sampling flow rate was adjusted to have the sampler inlet velocity matching the wind velocity in the test chamber. Fig. 4 shows the experimental setup of the test personal samplers with the isokinetic probe in the test chamber. The sampling time for each test run was 20 min. Under this short sampling time, the effect of the particle mass loading on the cyclone penetration efficiency could be neglected.25 In this evaluation test, all experimental conditions were repeated a minimum of three times.
Fig. 4.
Experimental setup of the test sampler and isokinetic probe in the wind tunnel test chamber.
After each test run, the inner walls of the test samplers were flushed with isopropyl alcohol to recover the deposited test aerosols. Then, the flushing solutions, the distilled water remaining in the microcentrifuge tube of the BC sampler and the liquid cartridge of the PAS-5 sampler, together with the filters from the test samplers and the isokinetic probe, were placed in individual vials. Solutions of equal parts by volume of distilled water, isopropyl alcohol, and ethyl acetate were then prepared for each vial (the ethyl acetate was used to extract the fluorescent aerosol tracer). All relevant solutions from each test run were measured by a fluorometer (Model 450, Turner Corp., Mountain View, CA) to acquire the fluorescent intensity. In this way, the aerosol concentrations in each solution could be obtained, and the aspiration efficiency of the personal bioaerosol sampler in a specific sampling condition could then be calculated by
| (1) |
where θ is the sampling orientation (the angle between the centerline of the sampler inlet and the wind direction); CS-liquid, CS-filter, and CS-wall are the aerosol concentrations of the collection liquid, the backup filter, and the inner wall flushing acquired from the test sampler; and CI-filter and CI-wall are the aerosol concentrations obtained from the filter and the inner wall flushing of the isokinetic probe. Once the aspiration efficiencies for all three sampling orientations were obtained, the orientation-averaged aspiration efficiency (A) was then calculated by
| (2) |
where A0, A90, and A180 are the aspiration efficiencies of the test samplers at 0°, 90°, and 180° to the wind, respectively. Similar to eqn (1), the capture efficiency of the test samplers in a specific sampling orientation (Cpθ) can be expressed as
| (3) |
where CS-medium is the aerosol concentration acquired by the collection medium used in the sampler. For the BC sampler, CS-medium = CS-liquid + CS-wall, because the test aerosols collected from both the water in, and the wall of, the microcentrifuge tube can be used for further analysis. However, for the PAS-5 sampler, CS-medium = CS-liquid because the recirculating liquid is the only collection medium. The orientation-averaged capture efficiency (Cp) for the personal bioaerosol samplers was calculated as
| (4) |
Results
Fig. 5 shows the orientation-averaged aspiration efficiencies (A) of the two test samplers as a function of the aerodynamic diameter (dae) of the test aerosols. The aspiration efficiencies are shown at wind speeds of 0.5, 1.0, and 2.0 m s−1 (Fig. 5a–c, respectively). Also shown in Fig. 5 are the data from a reference sampler, IOM (SKC Inc., Eighty Four, PA), obtained in separate experiments using the same wind tunnel, test aerosols, filters, wall washing solution, and post-experimental procedure. The solid line shown in Fig. 5 is the aspiration efficiency curve recommended by ACGIH for the IPM fraction of the personal sampler15
Fig. 5.
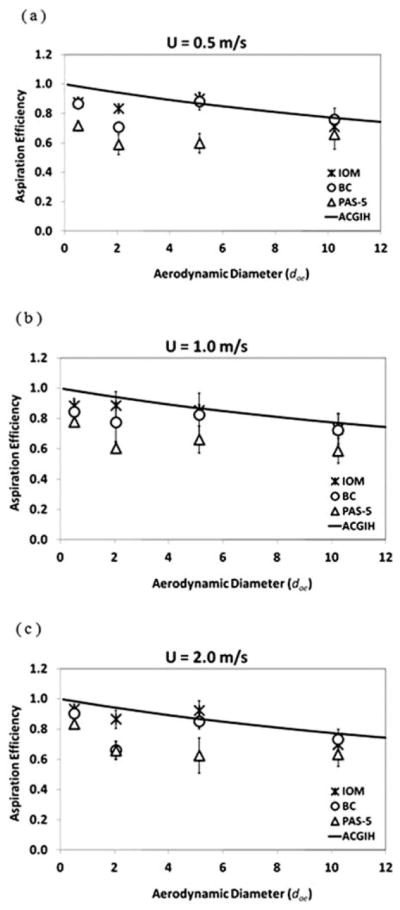
The orientation-averaged aspiration efficiency as a function of the aerodynamic diameter for the two test personal bioaerosol samplers and the reference sampler, (a) U = 0.5 m s−1, (b) U = 1.0 m s−1, and (c) U = 2.0 m s−1 (error bars represent the standard deviation of the experiments).
| (5) |
The reason for comparing the aspiration efficiencies of the two test samplers with the ACGIH inhalable convention is that it is believed to be appropriate to apply the health-related, particle size-selective inhalability criterion for inert aerosol sampling to bioaerosol sampling because certain bioaerosols are considered hazardous when inhaled into the respiratory tract no matter where they are deposited.
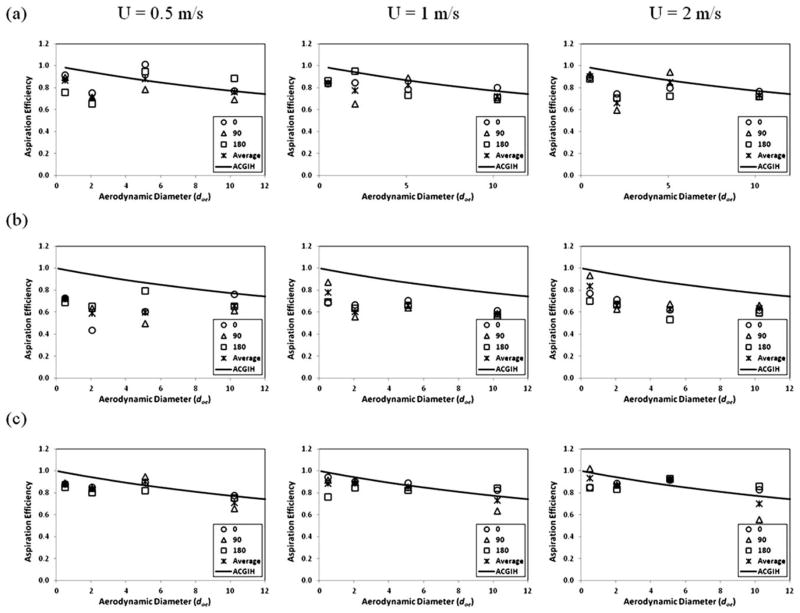
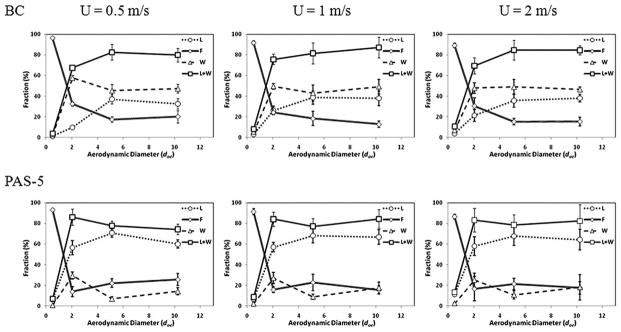
The plots in Fig. 6 show the aspiration efficiencies against the aerodynamic diameter of the test aerosols in various sampling orientations for the two test samplers and the reference sampler. The data are also shown at different wind speeds from 0.5 to 2.0 m s. −1 Fig. 7 shows the orientation-averaged capture efficiencies for the two samplers as a function of the aerodynamic diameter of the test aerosols at different wind speeds. For the BC sampler, the capture efficiencies are presented as the sum of the fractions of the liquid collection and wall deposition. For the PAS-5 sampler, the capture efficiencies are shown as the fraction of the aerosols collected by the liquid.
Fig. 6.
The aspiration efficiency as a function of the aerodynamic diameter in different sampling orientations for the test personal bioaerosol samplers and the reference sampler shown in (a) BC, (b) PAS-5, and (c) IOM.
Fig. 7.
The capture efficiency, filter collection, and wall deposition of the test samplers at different wind speeds: U = 0.5 m s−1, U = 1.0 m s−1, and U = 2.0 m s−1 (L: Liquid; F: Filter; W: Wall; L + W: Liquid + Wall; and error bars represent the standard deviation of the experiments.
Discussions
As shown in Fig. 5, the orientation-averaged aspiration efficiencies for both personal bioaerosol samplers were relatively higher at the smallest aerosol size range and decreased gradually as the aerosol size increased. This trend agrees with the ACGIH inhalable convention, however the data values for the test samplers seem slightly lower than the convention. Within the size range of the test particles, the aspiration efficiency of the BC was on an average 0.1 (S.D. = 0.09) lower than the inhalable convention, and the aspiration efficiency of PAS-5 was on an average 0.23 (S.D. = 0.08) lower than the convention. In contrast, the reference sampler (IOM) agreed quite well with the inhalable convention both qualitatively and quantitatively with only 0.05 lower than the convention in average. When comparing the datasets of different wind speeds in Fig. 5, it can be found that the aspiration efficiencies are not a function of wind speed. Given the same particle size, for both test samplers, the aspiration efficiencies at three wind speeds are not significantly different at the α = 0.05 level based on the ANOVA test. Therefore, it can be stated that within the aerosol size ranging from 0.5 to 10 μm, the performance of the BC and PAS-5 personal bioaerosol samplers in terms of the aspiration efficiency closely meets the criterion for inhalable aerosol samplers. Fig. 5 shows that the aspiration efficiencies of the BC sampler were generally higher than those of the PAS-5 sampler. The cause for this is not immediately clear, but it may be due to the difference in the sampler body dimensions. The size and shape of the BC and PAS-5 samplers may cause the flow fields around the two samplers to differ, which may prevent the test aerosols from being drawn into the sampler inlet and thus results in the discrepancy in the aspiration efficiency.
Fig. 6a and b show that the aspiration efficiencies of both BC and PAS-5 samplers in different sampling orientations were comparable. No specific sampling orientation was shown to give significantly higher aspiration efficiency. This result implies that the sampling orientation has a very limited effect on the aspiration efficiencies of these two personal bioaerosol samplers. Therefore, it is fair to say that the aspiration efficiencies of the BC and PAS-5 samplers are independent of the sampling orientation within the range of aerosol sizes and wind speeds employed in this evaluation. In contrast, the trend of the aspiration efficiency of the IOM reference sampler (Fig. 6c) seems to be a function of the sampling orientation. The discrepancy between different sampling orientations is especially obvious at medium-to-high wind speeds (1.0 and 2.0 m s−1) with large test aerosols (10 μm). The IOM sampler had a relatively lower aspiration efficiency in the 90° sampling orientation than the other two sampling orientations (0° and 180°). This result is similar to those reported by Li et al. using an IOM personal sampler and by Aizenberg et al. using a Button personal sampler.26,27 In those studies, it was reported that the aspiration efficiency of an IOM or a Button sampler is a function of its sampling orientation with the 90° sampling orientation having a lower aspiration efficiency than both the 0° and 180° sampling orientations. The fact that the sampling orientation of the current test samplers had little impact on the aspiration efficiency might be due to the possibility that a convergent air flow was generated around the inlets of these two samplers in the wind tunnel. Because the inlet diameters of the BC (0.24 cm) and PAS-5 (0.75 cm) samplers are significantly smaller than that of the IOM sampler (1.5 cm), and the flow rate used to operate the BC and PAS-5 samplers (4 and 10 l min−1, respectively) are higher than that of the IOM sampler (2 l min−1), stronger sampling flow fields with much higher sampling velocities (14.7 and 3.8 m s−1 for the BC and PAS-5 samplers, respectively, at the inlet plane) are generated by the two test samplers than that generated by the IOM sampler (0.2 m s−1). As a result, a powerful convergent flow field is formed around the sampler inlets of the two test samplers at all three wind speeds used in this evaluation (0.5, 1.0 to 2.0 m s−1). The strong air movement can therefore draw more aerosols having considerable inertia (such as the 10 μm particles used in this evaluation) from the vicinity of the sampler inlet to move toward into the sampler inlet regardless of the sampling orientation. Conversely, the relatively weak sampling movement of the IOM sampler generated a divergent flow field around the sampler inlet at the wind speeds used in this evaluation. As a consequence, while sampling aerosols with considerable inertia, it may produce oversampling when sampling into the wind (0°) and undersampling when sampling perpendicular to the wind (90°). Although the above explanation can reasonably explain the results obtained in this evaluation, it is believed that if the test wind speed increases sufficiently, making the flow fields around the test samplers change from convergent to divergent, the aspiration efficiencies of the BC and PAS-5 samplers will be influenced by their sampling orientations. However, in such sampling conditions, the associated wind speeds may already be outside the range of wind speeds commonly found in the general workplace.
Fig. 7 shows the fractions of capture efficiency, wall deposition, and filter collection for the two test samplers as a function of dae at different wind speeds. As previously noted, the capture efficiency is defined as the fraction of bioaerosols that entered the sampler and then were captured by the collection medium. For the BC sampler, the capture efficiency is the fraction of bioaerosols deposited on the tube wall as well as the liquid added. For PAS-5, the capture efficiency is the fraction of bioaerosols captured by the recirculating liquid (the recirculating liquid is the only collection medium for PAS-5). Having a high capture efficiency indicates that the bioaerosol concentration obtained by a sampler more accurately represents the true bioaerosol concentration in the sampling environment. As can be seen in Fig. 7, the capture efficiency of the BC sampler (as represented by the fraction L + W) shows similar trends at the different wind speeds. The same phenomenon was also found in the PAS-5 sampler (the capture efficiency of PAS-5 is presented by the fraction L only). These results imply that the capture efficiencies of the test personal bioaerosol samplers were not affected by the wind speed. Both samplers had low capture efficiencies when the aerosol size was small, and as the aerosol size increased, the capture efficiency increased. The capture efficiency of the BC sampler leveled off at 80% for aerosols larger than 5 μm. In comparison, the capture efficiency of the PAS-5 sampler averaged about 70% for the same aerosol size range. The high capture efficiency obtained from the PAS-5 sampler implies that the recirculating liquid film functions well and that it can successfully capture a greater percentage of bioaerosols entering the sampler. On the other hand, when taking a close look at the capture efficiency of the BC sampler, it was found that a considerable portion of the aerosols captured was recovered from the wall of the microcentrifuge tube, while the aerosols that were captured by the water in the tube were relatively low.
The fraction of the aerosols that entered the sampler and remained in the sampler (represented by L + W, which is the sum of the fractions captured by the liquid and deposited on the wall) can be used for estimating the 50% cut-off diameter for the two test personal bioaerosol samplers. The 50% cut-off diameter of a sampler indicates that more than 50% of the particles larger than this diameter will deposit in the sampler, and most of the particles smaller than this diameter will pass through the sampler. Görner et al. used a similar means to obtain the cut-off diameter for the CIP 10-M bioaerosol sampler.9 As shown in Fig. 7, the L + W fractions of both BC and PAS-5 samplers increased as the aerosol size increased. In consequence, the fraction of the aerosols collected by the backup filter (represented by F, which are the aerosols that entered the sampler, but later passed through the sampler) was higher for the smallest aerosol size and then decreased sharply as the aerosol size increased. The trends of the L + W and F shown in Fig. 7 seem unaffected by the wind speeds used in the test for both samplers. The L + W fraction of the BC sampler increased from an average of 10% at 0.5 μm to about 80% at 10 μm with a corresponding 50% cut-off diameter at about 1.35 μm. For the PAS-5 sampler, the same fraction also increased from an average of 10% at 0.5 μm to about 80% at 10 μm with a corresponding 50% cut-off diameter at about 1.55 μm. Although the cut-off diameter reported here for the PAS-5 sampler is larger than that reported previously where the 50% cut-off diameter was around 0.7 μm,13 it is worth noting that the previous tests were conducted in an aerosol mixing chamber while the current test was conducted in a wind tunnel.
Based on the experimental data acquired from this evaluation, it can be concluded that, overall, the BC and PAS-5 samplers both performed slightly below, but still within, acceptable aspiration efficiencies. Although the BC sampler had a relatively higher capture efficiency than the PAS-5 sampler, a large portion of the captured bioaerosols was deposited on the wall of its microcentrifuge tube. This result suggests that the application of the BC sampler would be limited to specific bioaerosols that can be collected on a dry surface. In contrast, most of the test aerosols captured by the PAS-5 sampler were in the collection liquid which shows that the PAS-5 sampler has a broader application so that it can be used in different work environments for various bioaerosol sampling techniques.
Conclusions
This series of wind tunnel evaluation tests provides a detailed assessment of the working function of two newly developed personal bioaerosol samplers (BC and PAS-5) that are designed based on the principle of a cyclone. The performance evaluation focused on the physical sampling characteristics of the two test samplers in terms of aspiration efficiency and capture efficiency. The results showed that the aspiration efficiencies of these two samplers closely agreed with the slightly lower ACGIH inhalable convention in the aerosol size range from 0.5 to 10 μm. The capture efficiency of the BC sampler reached 80% for aerosols larger than 5 μm, and the capture efficiency of the PAS-5 sampler averaged about 70% within the same aerosol size range. The physical performance of both samplers was found to be unaffected by the wind speeds used in the evaluation tests. Overall, the BC sampler showed a higher aspiration efficiency and capture efficiency than the PAS-5 sampler. Nevertheless, it is believed that the PAS-5 sampler may perform better than the BC sampler in terms of biological sampling efficiency due to its design to collect the bioaerosols onto a recirculating liquid film instead of a dry wall which can greatly maintain the viability of the captured bioaerosols. Future studies will concentrate on using model bioaerosols to evaluate the biological sampling efficiencies of the two samplers in the same wind tunnel to fully evaluate their ability to perform bioaerosol sampling.
Acknowledgments
The authors are grateful to Jiajie Sun for technical assistance. This project is sponsored by National Institute for Occupational Safety and Health grant numbers R01 OH008913 and R01 OH009801.
References
- 1.Lacey J, Dutkiewicz J. J Aerosol Sci. 1994;25(8):1371–1404. [Google Scholar]
- 2.Fakhri ZI. In: Encyclopedia of Occupational Health and Safety. Stellman JM, editor. ch 38. International Labour Office; Geneva: 1998. p. 38.2. [Google Scholar]
- 3.Aizenberg V, Reponen T, Grinshpun SA. Am Ind Hyg Assoc J. 2000;61(6):855–864. doi: 10.1080/15298660008984598. [DOI] [PubMed] [Google Scholar]
- 4.Agranovski IE, Agranovski V, Reponen T, Willeke K, Grinshpun SA. Atmos Environ. 2002;36(5):889–898. [Google Scholar]
- 5.Singh M, Misra C, Sioutas C. Atmos Environ. 2003;37:4781–4793. [Google Scholar]
- 6.Jensen PA, Todd WF, Davis GN, Scarpino PV. AIHAJ. 1992;53(10):660–667. doi: 10.1080/15298669291360319. [DOI] [PubMed] [Google Scholar]
- 7.Willeke K, Lin X, Grinshpun SA. Aerosol Sci Technol. 1998;28:439–456. [Google Scholar]
- 8.Chen BT, Feather GA, Maynard A, Rao CY. Aerosol Sci Technol. 2004;38:926–937. [Google Scholar]
- 9.Görner P, Fabriès JF, Duquenne P, Witschger O, Wrobel R. J Environ Monit. 2006;8:43–48. doi: 10.1039/b508671j. [DOI] [PubMed] [Google Scholar]
- 10.Lindsley WG, Schmechel D, Chen BT. J Environ Monit. 2006;8:1136–1142. doi: 10.1039/b609083d. [DOI] [PubMed] [Google Scholar]
- 11.Carvalho E, Sindt C, Verdier A, Galan C, O’Donoghue L, Parks S, Thibaudon M. Aerobiologia. 2008;24(4):191–201. [Google Scholar]
- 12.Kingand AR, McFarland MD. Aerosol Sci Technol. 2012;46:82–93. [Google Scholar]
- 13.Tolchinsky AD, Sigaev VI, Sigaev GI, Varfolomeev AN, Uspenskaya SN, Cheng YS, Su WC. J Environ Sci Health, Part A: Toxic/Hazard Subst Environ Eng. 2011;46:1690–1698. doi: 10.1080/10934529.2011.623957. [DOI] [PubMed] [Google Scholar]
- 14.Xu Z, Wu Y, Shen F, Chen Q, Tan M, Yao M. Aerosol Sci Technol. 2011;45:1337–1349. [Google Scholar]
- 15.American Conference of Governmental Industrial Hygienists. Particle Size-Selective Sampling in the Workplace. Report of the ACGIH air sampling procedures committee; Cincinnati, Ohio. 1985. [Google Scholar]
- 16.Olenin OD. Device for Aerosol Vaccination Control. 1977. Russian Inventor’s Certificate #578600, Russian Patent & Trademark Office, Moscow, The bulletin of inventions and discoveries, #40. [Google Scholar]
- 17.Sigaev GI, Tolchinsky AD, Sigaev VI, Soloviev KG, Varfolomeev AN, Chen BT. Aerosol Sci Technol. 2006;40(5):293–308. [Google Scholar]
- 18.Sreenath A, Vincent JH, Ramachandran G. Appl Occup Environ Hyg. 1999;14(9):624–631. doi: 10.1080/104732299302431. [DOI] [PubMed] [Google Scholar]
- 19.Brixey LA, Paik SY, Evans DE, Vincent JH. J Environ Monit. 2002;4:633–641. doi: 10.1039/b202274p. [DOI] [PubMed] [Google Scholar]
- 20.Paik SY, Vincent JH. Ann Occup Hyg. 2004;48(1):3–11. doi: 10.1093/annhyg/meg088. [DOI] [PubMed] [Google Scholar]
- 21.Hinds WC. Aerosol Technology. John Wiley & Sons; New York: 1999. p. 395. [Google Scholar]
- 22.Baron P, John W. In: Particle Size-selective Sampling for Particulate Air Contaminants. Vincent JH, editor. ACGIH Air Sampling Procedures Committee; 1999. pp. 141–154. [Google Scholar]
- 23.Aizenberg V, Grinshpun SA, Willeke K, Smith J, Baron PA. J Aerosol Sci. 2000;31(2):169–179. doi: 10.1080/15298660008984550. [DOI] [PubMed] [Google Scholar]
- 24.Görner P, Simon X, Wrobel R, Kauffer E, Witschger O. Ann Occup Hyg. 2010;54(2):165–187. doi: 10.1093/annhyg/mep079. [DOI] [PubMed] [Google Scholar]
- 25.Tsai CJ, Shiau HG, Lin KC, Shih TS. J Aerosol Sci. 1999;30(3):313–323. [Google Scholar]
- 26.Li SN, Lundgren DA, Rovell-Rixx D. Am Ind Hyg Assoc J. 2000;61(4):506–516. doi: 10.1080/15298660008984562. [DOI] [PubMed] [Google Scholar]
- 27.Aizenberg V, Grinshpun SA, Willeke K, Smith J, Baron PA. Am Ind Hyg Assoc J. 2000;61(3):398–404. doi: 10.1080/15298660008984550. [DOI] [PubMed] [Google Scholar]


