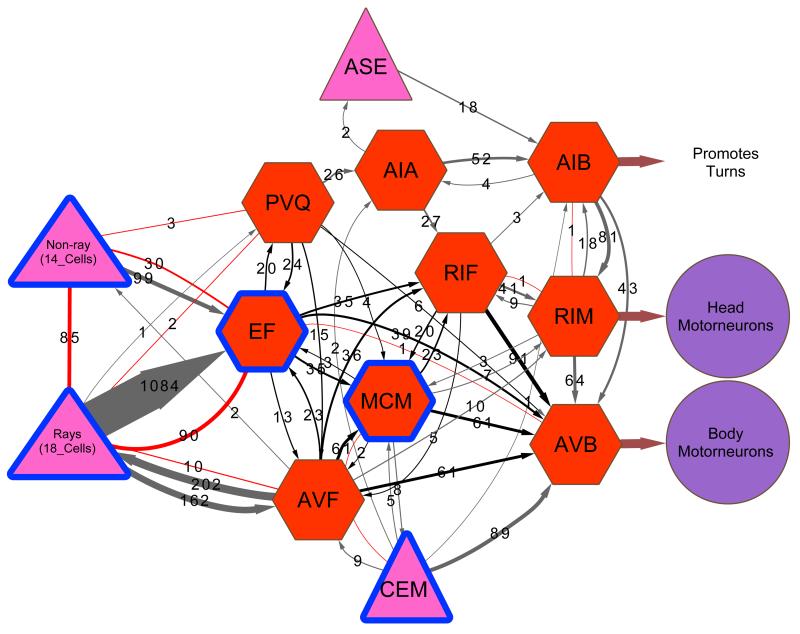
Figure 2. MCM connectivity.
a, Connectivity diagram of the MCMs showing the main inputs and outputs. The connections to the neurons known to regulate sexual conditioning (rays and CEMs), chemosensory plasticity (AIA, RIF), and salt sensation (ASE) are included. Grey and red connections indicate chemical and electrical synapses, respectively. The triplet motifs created by the MCMs are highlighted in black. The thickness of the lines is proportional to the anatomical strength of the connections, indicated in numbers (the number of EM serial sections of scored synaptic connectivity). Pink triangles, sensory neurons; red octagons, interneurons; purple circles, motor neurons; blue outline, male-specific.

