

Abstract
Background
Studies had investigated the associations between proprotein convertase subtilisin/kexin type 9 (PCSK9) E670G polymorphism and coronary artery disease (CAD) and lipid levels, but the results were controversial. Thus, we performed this meta-analysis to investigate the association between PCSK9 E670G polymorphism and lipid levels and the susceptibility to CAD.
Methods
All relevant articles according to the inclusion criteria were retrieved and included in the present meta-analysis. Odds ratios (ORs) with 95 % confidence interval (CI) were used to analyze the strength of the association between PCSK9 E670G polymorphism and the susceptibility to CAD. At the same time, the pooled standardized mean difference (SMD) with 95 % CI was used for the meta-analysis of PCSK9 E670G polymorphism and lipid levels. The publication bias was examined by using Begg’s funnel plots and Egger’s test.
Results
A total of seventeen studies met the inclusion criteria. For CAD association, the pooled effects indicated that the G allele carriers had higher risk of CAD than non-carriers in dominant genetic model (OR:1.601, 95 % CI: 1.314–1.951, P < 0.001), as well as in allelic genetic model (OR: 1.546, 95 % CI: 1.301–1.838, P < 0.001). When the subgroup analysis stratified by ethnicity and HWE was performed, the positive result existed in most of the subgroups. For lipid levels association, the pooled effects indicated that the G allele carriers had higher TC and LDL-C levels than the non-carriers (for TC, SMD: 0.126, 95 % CI: 0.023–0.229, P = 0.016; for LDL-C, SMD: 0.170, 95 % CI: 0.053–0.287, P = 0.004, respectively). There was no difference in the levels of TG and HDL-C between the G carriers and the non-carriers in the whole population (SMD: 0.031, 95 % CI: −0.048–0.110, P = 0.440; SMD: −0.123, 95 % CI: −0.251–0.006, P = 0.061, respectively). When the studies were stratified by ethnicity and type of study, the G carriers had higher TC levels than the non-carriers (SMD: 0.126, 95 % CI: 0.014–0.238, P = 0.027) in the non-Asian subgroup. The similar results existed in cohort subgroup. The association between PCSK9 E670G polymorphism and LDL-C levels was significant in all subgroups. Meanwhile, the G carriers had higher TG levels than the non-carriers (SMD: 0.113, 95 % CI: 0.012–0.214, P = 0.028) in the case–control subgroup. AG + GG genotypes had lower HDL-C levels than AA genotype in Asian subgroup (SMD: −0.224, 95 % CI: −0.423– −0.025, P = 0.027) and in case–control subgroup (SMD: −0.257, 95 % CI: −0.467–−0.048, P = 0.016).
Conclusions
The present meta-analysis concluded that PCSK9 E670G polymorphism was associated with CAD risk and lipid levels.
Electronic supplementary material
The online version of this article (doi:10.1186/s12944-015-0154-7) contains supplementary material, which is available to authorized users.
Keywords: Proprotein convertase subtilisin/kexin type 9, Dyslipidemia, Polymorphism, Gene, Coronary artery disease, Meta-analysis
Background
Coronary artery disease (CAD) is the major manifestations of atherosclerotic process, which is expected to remain one of the leading causes of mortality until at least 2030 [1]. Epidemiological studies demonstrated that elevated serum low-density lipoprotein cholesterol (LDL-C) levels had consistently been shown to be the risk factors for the occurrence and development of CAD. In addition, genetic and other environmental factors are involved in the pathogenesis of CAD [2].
Proprotein convertase subtilisin/kexin type 9 (PCSK9), originally named neural apoptosis regulated convertase-1 (NARC-1), is the ninth member of the proprotein convertase family [3]. PCSK9 is mainly expressed in liver, kidney and intestine. The pro-PCSK9 undergoes auto-catalytic intramolecular cleavage at FAQ15↓2SIP residue in endoplasmic reticulum (ER) and Golgi apparatus. After the auto-catalytic procession, the mature and active PCSK9 protein is generated and secreted. By the catalytic domain, PCSK9 binds to the epidermal growth factor-like repeat A domain (EGF-A) of LDL receptor (LDLR) and enhances the degradation of LDLR, which increases the serum lipid levels and accelerates the procession of atherosclerosis. Recently, numerous studies revealed that PCSK9 was closely associated with lipid levels and the risk of CAD.
The coding gene for human PCSK9 protein is located on chromosome 1p32.3 and it encompasses 12 exons and encodes a 692 amino acid glycoprotein. It contains a signal peptide (1–30), a pro-domain (31–152) and a catalytic domain (153–451) followed by a cysteine-histidine rich domain (526–692). The pro-domain acts as an intramolecular chaperone, which ensures the catalytic domain to fold correctly in the ER.
The mutations of PCSK9 were identified as the cause of a third monogenetic form of autosomal-dominant hypercholesterolemia (ADH), except LDLR and apolipoprotein B (apoB) genes [4]. Recently, there is an increasing interest in the role of the gene polymorphisms of PCSK9 in the serum lipids homeostasis and the pathogenesis of CAD.
Up to date, a total of 163 mutations in PCSK9 gene have been found, including 153 substitutions, eight insertions and two deletion mutations (www.ucl.ac.uk/ldlr/LOVDv.1.1.0/, the last update February 10, 2011). These mutations are divided into gain-of-function (GOF) and loss-of-function (LOF) mutations. LOF mutations in PCSK9 gene increase the concentration of LDLR on the cell surface, which promotes the uptake of serum LDL-C and prevents the procession of CAD.GOF mutations enhance the degradation of LDLR, which reduces the uptakes of LDL-C and ultimately increases the circulating LDL-C levels. In addition, it may also regulate the production and secretion of apoB and enhance the levels of very low-density lipoprotein (VLDL) [5].
PCSK9 E670G variant (rs505151), a common variant in exon 12, is located within the cysteine-rich C-terminal domain, which participates in the regulation of auto-catalysis [6]. The guanine is substituted for adenine at nucleotide 23,968, leading to a change from E to G at the position 670 of the PCSK9 protein, and this change may increase the affinity of PCSK9 for the LDLR. The frequency of 670G was varied greatly in different ethnic populations. Previous studies have revealed that E670G polymorphism was associated with high levels of total cholesterol (TC) and LDL-C and the risk of CAD [7, 8], but the results was inconsistent [9, 10]. For instance, Slimani A et al. found that the plasma TC and LDL-C levels were significantly higher in 670G carriers than in non-carriers and 670G increased the risk and the severity of CAD [8]. On the contrary, in a Chinese study, this variant was associated neither with elevated LDL-C levels, nor with the CAD susceptibility [10].
To enhance statistical power to produce a more precise result, we performed this meta-analysis based on available data aimed to derive a more precise association of the PCSK9 gene polymorphism and lipid levels and the risk of CAD.
Methods
Studies selection
The meta-analysis followed the Perferred Reporting Items for Systematic Reviews and Meta-analysis (Additional file 1: PRISMA) criteria [11]. The electronic databases, such as PubMed, Foreign Medical Journal Service (FMJS) and Embase, were searched for relevant papers on the association between PCSK9 E670G polymorphism and serum lipid levels and/or the risk of CAD. We also searched the Chinese electronic databases, such as Wanfang Data and China National Knowledge Infrastructure (CNKI) databases for Chinese literatures. The following keywords were used in the search: “PCSK”, “proprotein convertase subtilisin/kexin type 9”, “neural apoptosis regulated convertase-1”, “NARC-1”, “polymorphism”, “gene”, “rs505151”, “mutation”, “variant”, “lipid”, “dyslipidemia”, “coronary heart disease”,“myocardial infarction”, “coronary artery disease”, “ischemic heart disease”, “acute coronary syndrome”, “CAD” and “CHD”. The reference lists of the relevant papers that we identified were also checked.
Inclusion and exclusion criteria
The eligible study must met the following criteria: 1) Case–control study or cohort study investigating the relationships between PCSK9 E670G polymorphism and serum lipid levels and/or the risk of CAD; 2) For the lipid levels, the data were presented as mean ± standard deviations (SD) and the study had one of the serum lipid levels, at least including TC, triglyceride (TG), LDL-C or high density lipoprotein cholesterol (HDL-C); 3) For risk of CAD, the frequencies of genotypes in controls and CAD groups were clear.
Exclusion criteria: 1) The study was not conducted in human; 2) Family-based study. If there are several multiple publications from the same population, the most recent literature with the largest sample size was adopted.
Data extraction
A special form was prepared for recording the available information. Two reviewers (Cai and Zhang) independently extracted the following data from each eligible study: first author, year of publication, country, ethnicity, genotype and allele distributions, geontyping method, lipid levels, type of study, Hardy-Weinberg equilibrium (HWE). The disagreements were resolved by consulting with the third author (Shi).
Data analysis
The deviation from the HWE for the PCSK9 E670G genotype distributions was assessed by Fisher’s exact test. The odds ratios (ORs) with 95 % confidence interval (CI) were applied to evaluate the strength of the association between the PCSK9 E670G polymorphism and the susceptibility to CAD. Because the frequency of genotype GG in most of studies was low, the pooled ORs were only performed for allelic model (G vs. A) and dominant model (AG + GG vs. AA). The pooled standardized mean difference (SMD) with 95 % CI was used for the meta-analysis of PCSK9 E670G polymorphism and lipid levels. We defined PCSK9 670G carriers as having the AG and GG genotypes. If the unit of the lipids is presented as mg/dl, we converted it to mmol/l. In several studies, the subjects were divided into different subgroups (e.g. male or female, drinker or non-drinker, CAD or ischemic stroke), so we treated each subpopulation as a separate comparison in our meta-analysis. Between-study heterogeneity was investigated and measured by using Cochran’s Q test. It was also detected by using the I2 statistic. If the between-study heterogeneity was significant (I2 > 50 %, P ≤ 0.05), a random-effect model (a Dersimonian-Laird method) was used to calculate the results. Otherwise, the fixed effect model (a Mantel-Haenszel method) was adopted [12].
Because of the significant heterogeneity among studies, we carried out sensitivity analysis while evaluating the results again by omitting one single study each time. We also performed the subgroup analysis stratified by ethnicity (“Asian” or “non-Asian”) and type of study (“case–control” or “cohort”) to explore the sources of heterogeneity. The publication bias of literature was examined by Begg’s funnel plots, which was verified by Egger’s linear regression test.
The STATA version 12.0 (StataCorp LP, College Station, Texas 77845 USA) was used for the meta-analysis.
Results
Characteristics of included studies
Through the initial retrieval, a total of 147 records were selected. 123 records were excluded according to abstract. Full-text articles were retrieved and seven literatures were excluded for the following reasons: (1) data were repetitive or overlapping (n = 2); (2) data were obviously wrong (n = 2); (3) data were not obtained (n = 2); (4) family-based study (n = 1). In the end, 17 literatures met all the inclusion criteria and are involved in the present meta-analysis [7, 8, 10, 13–26]. The flow diagram of the study selection process is presented in Fig 1.
Fig. 1.
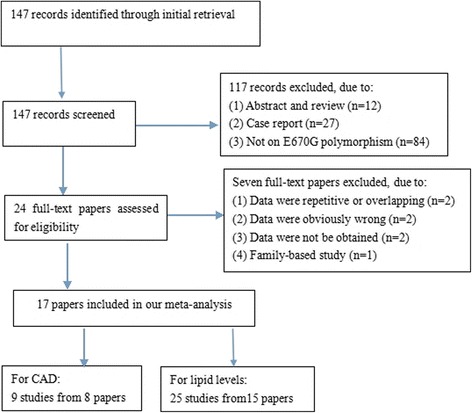
Flow diagram of article selection process for PCSK9 E670G polymorphism and CAD and lipid levels
All of the eligible studies included in this study had been approved by the Ethics Committee of their affiliations and our study was approved by the Ethics Committee of Wujin hospital, affiliated to Jiangsu University.
The characteristics of the included studies were listed in Tables 1 and 2. For CAD, nine comparisons from eight articles including 1517 cases and 1795 controls dealt with the association between PCSK9 E670G polymorphism and risk of CAD. All of them were case–control studies and the minor allelic frequencies (MAF) varied greatly from 2.3 to 48.3 %. None of the distribution of genotypes in controls deviated from HWE, except Gao et al’s study. Among them, seven studies were performed among Asians, one among Caucasians and one among Africans, respectively. The genotyping method in most studies was PCR-RFLP, except for Mo et al’s study.
Table 1.
Main characteristics of studies involved in this meta-analysis of PCSK9 E670G polymorphism and CAD risk
| First author | Year | Country | Ethnicity | Mean age (years) (case/control) | Type of study | Sample size (case/control) | Cases | Controls | Genotyping method | MAF (control, %) | HWE (P) | ||||
|---|---|---|---|---|---|---|---|---|---|---|---|---|---|---|---|
| AA | AG | GG | AA | AG | GG | ||||||||||
| Salazar LA [16] | 2007 | Chile | Caucasian | -/ - | C-C | 110/108 | 105 | 5 | 0 | 103 | 5 | 0 | PCR-RFLP | 2.3 | >0.05 |
| Hsu LA [10] | 2009 | China | Asian | 55.6 + 10.5/ 45.9 + 10.4 | C-C | 202/614 | 182 | 20 | 0 | 541 | 72 | 1 | PCR-RFLP | 6.0 | >0.05 |
| Zeng J [19] | 2011 | China | Asian | 65.9 ± 10.2/ 57.0 ± 8.7 | C-C | 212/184 | 167 | 38 | 7 | 165 | 17 | 2 | PCR-RFLP | 5.7 | >0.05 |
| Meng YH [7] | 2011 | China | Asian | 66.49 ± 9.92/ 64.34 ± 15.35 | C-C | 165/180 | 146 | 19 | 0 | 166 | 14 | 0 | PCR-RFLP | 3.9 | >0.05 |
| Slimani A [8] | 2014 | Tunisian | African | 61[55–67]/ 49[45–55] | C-C | 192/232 | 148 | 37 | 7 | 199 | 32 | 1 | PCR-RFLP | 7.3 | >0.05 |
| Zhang L [23] | 2014 | China | Asian | 59.85 + 8.71/ 58.83 + 9.35 | C-C | 416/257 | 291 | 117 | 8 | 212 | 42 | 3 | PCR-RFLP | 15.3 | >0.05 |
| Mo YQ [26] | 2015 | China | Asian | 56.4 + 11.7/ 54.7 + 10.2 | C-C | 100/100 | 87 | 13 | 0 | 92 | 8 | 0 | DNA sequencing | 4.0 | >0.05 |
| Gao Y a [25] | 2015 | China | Asian | -/- | C-C | 60/60 | 19 | 21 | 20 | 20 | 22 | 18 | PCR-RFLP | 48.3 | <0.05 |
| Gao Y b [25] | 2015 | China | Asian | -/- | C-C | 60/60 | 15 | 21 | 24 | 23 | 18 | 19 | PCR-RFLP | 46.7 | <0.05 |
aChinese Han population
bMongols population
C-C case–control, PCR-RFLP polymerase chain reaction- restriction fragment length polymorphism, MAF minor allelic frequencies, HWE Hardy-Weinberg equilibrium
Table 2.
Characteristics of individual studies included in the meta-analysis of PCSK9 E670G polymorphism and lipid levels
| First author | Year | Country | Ethnicity | Type of study | Subpopulation | Genotype | Number (n) | TC (mmol/l) | TG (mmol/l) | HDL-C (mmol/l) | LDL-C (mmol/l) | Genotyping method | ||||
|---|---|---|---|---|---|---|---|---|---|---|---|---|---|---|---|---|
| M | SD | M | SD | M | SD | M | SD | |||||||||
| Chen SN 1 [13] | 2005 | American | Mixed | Cohort | LCAS population | AA | 324 | 5.69 | 0.62 | 1.83 | 0.64 | 1.14 | 0.29 | 3.72 | 0.51 | Allelic discrimination assays |
| AG + GG | 48 | 5.82 | 0.66 | 1.66 | 0.63 | 1.16 | 0.31 | 3.89 | 0.57 | |||||||
| Chen SN 2 [13] | 2005 | American | Caucasian | Cohort | TexGen population | AA | 292 | NA | NA | NA | NA | NA | NA | 2.28 | 0.65 | Allelic discrimination assays |
| AG + GG | 27 | NA | NA | NA | NA | NA | NA | 2.43 | 0.55 | |||||||
| Evans D 1 [14] | 2006 | Germany | Caucasian | Cohort | Male group | AA | 190 | 6.05 | 1.4 | 1.39 | 0.45 | 1.16 | 0.31 | 4.29 | 1.34 | PCR-RFLP |
| AG + GG | 26 | 6.57 | 1.48 | 1.55 | 0.44 | 1.2 | 0.29 | 4.65 | 1.37 | |||||||
| Evans D 2 [14] | 2006 | Germany | Caucasian | Cohort | Female group | AA | 210 | 6.83 | 1.45 | 1.32 | 0.45 | 1.55 | 0.44 | 4.65 | 1.45 | PCR-RFLP |
| AG + GG | 18 | 6.65 | 1.47 | 1.22 | 0.23 | 1.58 | 0.52 | 4.5 | 1.37 | |||||||
| Scartezini M [15] | 2007 | UK | Caucasian | Cohort | NPHSII men | AA | 930 | 5.73 | 0.99 | NA | NA | 0.81 | 0.24 | 3.98 | 0.94 | PCR-RFLP |
| AG + GG | 135 | 5.65 | 0.96 | NA | NA | 0.83 | 0.26 | 3.92 | 0.94 | |||||||
| Polisecki E 1 [17] | 2008 | American | Caucasian | Cohort | Male group | AA | 2455 | 5.25 | 0.03 | NA | NA | NA | NA | 3.47 | 0.03 | Taqman |
| AG + GG | 165 | 5.26 | 0.06 | NA | NA | NA | NA | 3.47 | 0.06 | |||||||
| Polisecki E 2 [17] | 2008 | American | Caucasian | Cohort | Female group | AA | 2638 | 5.71 | 1.73 | NA | NA | NA | NA | 3.73 | 1.59 | Taqman |
| AG + GG | 158 | 5.85 | 0.95 | NA | NA | NA | NA | 3.84 | 0.84 | |||||||
| Hsu LA 1 [10] | 2009 | Taiwan | Asian | C-C | CAD group | AA | 541 | 5.14 | 0.96 | 1.59 | 1.3 | 1.42 | 0.37 | 3.02 | 0.85 | PCR-RFLP |
| AG | 73 | 4.95 | 0.96 | 1.72 | 1.53 | 1.44 | 0.36 | 2.78 | 0.82 | |||||||
| Hsu LA 2 [10] | 2009 | Taiwan | Asian | C-C | Control group | AA | 182 | 5.29 | 1.31 | 2.32 | 2.07 | 1.04 | 0.27 | 3.25 | 1.17 | PCR-RFLP |
| AG | 20 | 5.28 | 0.74 | 2.48 | 1.4 | 1.07 | 0.33 | 3.41 | 0.6 | |||||||
| Norata GD 1 [18] | 2010 | Italy | Caucasian | Cohort | PLIC study | AA | 1466 | 5.71 | 0.98 | 1.2 | 0.79 | 1.42 | 0.38 | 3.74 | 0.9 | Taqman |
| AG + GG | 75 | 5.99 | 1.2 | 1.16 | 0.58 | 1.45 | 0.35 | 4.01 | 1.07 | |||||||
| Norata GD 2 [18] | 2010 | Italy | Caucasian | Cohort | Ventimiglia study | AA | 728 | 4.76 | 0.99 | NA | NA | NA | NA | 3.02 | 0.86 | Taqman |
| AG + GG | 48 | 4.89 | 0.98 | NA | NA | NA | NA | 3.23 | 0.87 | |||||||
| Zeng J [19] | 2011 | China | Asian | C-C | CAD group | AA | 167 | 3.73 | 0.8 | 1.5 | 0.59 | 1.26 | 0.38 | 2.16 | 0.73 | PCR-RFLP |
| AG + GG | 45 | 4.25 | 1.38 | 1.87 | 1.16 | 1.26 | 0.41 | 2.58 | 1.08 | |||||||
| Meng YH [7] | 2011 | China | Asian | C-C | CAD group | AA | 146 | 4.41 | 0.72 | 0.99 | 0.62 | 1.48 | 0.51 | 2.22 | 0.63 | PCR-RFLP |
| AG | 19 | 4.63 | 1.21 | 1.17 | 0.97 | 0.98 | 0.84 | 3.02 | 0.97 | |||||||
| Aung LHH 1 [21] | 2013 | China | Asian | Cohort | non-drinker group | AA | 744 | 4.59 | 0.99 | 1.23 | 0.92 | 1.82 | 0.49 | 2.55 | 0.82 | PCR-RFLP |
| AG | 41 | 5.01 | 1.25 | 1.09 | 0.78 | 1.86 | 0.51 | 2.68 | 0.86 | |||||||
| Aung LHH 2 [21] | 2013 | China | Asian | Cohort | Drinker group | AA | 543 | 4.84 | 1.07 | 1.02 | 0.73 | 1.74 | 0.44 | 2.94 | 0.81 | PCR-RFLP |
| AG | 24 | 4.55 | 0.64 | 1.1 | 0.58 | 1.63 | 0.5 | 2.69 | 0.44 | |||||||
| Mayne J [20] | 2013 | Canada | Caucasian | Cohort | African Canadian population | AA | 192 | 5.56 | 1.14 | 1.59 | 0.77 | 1.2 | 0.4 | 3.64 | 1.01 | PCR + full exonic sequencing |
| AG | 15 | 5.11 | 1.12 | 1.27 | 0.48 | 1.1 | 0.3 | 3.45 | 1.11 | |||||||
| Slimani A 1 [8] | 2014 | Tunisian | African | C-C | CAD group | AA | 148 | NA | NA | 1.69 | 0.86 | 1 | 0.36 | NA | NA | PCR-RFLP |
| AG + GG | 44 | NA | NA | 1.97 | 0.96 | 1.03 | 0.16 | NA | NA | |||||||
| Slimani A 2 [8] | 2014 | Tunisian | African | C-C | IS group | AA | 90 | NA | NA | 1.58 | 0.75 | 1.35 | 0.4 | NA | NA | PCR-RFLP |
| AG + GG | 24 | NA | NA | 1.47 | 0.58 | 1.04 | 0.19 | NA | NA | |||||||
| Anderson JM 1 [22] | 2014 | Brazil | Caucasian | C-C | HC group | AA | 91 | 7.21 | 0.96 | 1.87 | 0.8 | 1.45 | 0.36 | 4.89 | 0.88 | Taqman |
| AG + GG | 37 | 7.4 | 0.96 | 1.81 | 0.76 | 1.5 | 0.31 | 4.94 | 0.8 | |||||||
| Anderson JM 2 [22] | 2014 | Brazil | Caucasian | C-C | NL group | AA | 131 | 4.47 | 0.47 | 0.91 | 0.32 | 1.53 | 0.36 | 2.53 | 0.47 | Taqman |
| AG + GG | 40 | 4.5 | 0.49 | 0.95 | 0.3 | 1.47 | 0.26 | 2.59 | 0.47 | |||||||
| Zhang L 1 [23] | 2014 | China | Asian | C-C | CAD group | AA | 291 | 4.07 | 1.16 | 1.82 | 0.79 | 1.37 | 0.16 | 2.29 | 0.77 | PCR-RFLP |
| AG + GG | 125 | 4.49 | 1.31 | 1.87 | 1.09 | 1.31 | 0.25 | 2.5 | 0.74 | |||||||
| Zhang L 2 [23] | 2014 | China | Asian | C-C | Control group | AA | 212 | 4.67 | 0.62 | 1.45 | 1.16 | 1.49 | 0.21 | 2.67 | 0.81 | PCR-RFLP |
| AG | 45 | 4.53 | 0.33 | 1.37 | 0.88 | 1.4 | 0.21 | 2.63 | 0.8 | |||||||
| Jeenduang N 1 [24] | 2015 | Thai | Asian | Cohort | Male group | AA | 132 | 5.54 | 1.3 | 1.46 | 0.84 | 1.32 | 0.35 | 3.66 | 1.13 | PCR-RFLP |
| AG | 3 | 5.82 | 2.25 | 1.4 | 0.92 | 1.19 | 0.21 | 4 | 2.06 | |||||||
| Jeenduang N 2 [24] | 2015 | Thai | Asian | Cohort | Female group | AA | 347 | 5.54 | 1.22 | 1.22 | 0.74 | 1.45 | 0.34 | 3.62 | 0.95 | PCR-RFLP |
| AG | 13 | 5.99 | 0.94 | 1.01 | 0.35 | 1.49 | 0.23 | 4.04 | 0.94 | |||||||
| Mo YQ [26] | 2015 | China | Asian | C-C | CAD group | AA | 87 | 4.48 | 0.81 | 0.97 | 0.58 | 1.49 | 0.47 | 2.12 | 0.72 | DNA sequencing |
| AG | 13 | 4.56 | 0.97 | 1.05 | 0.89 | 0.97 | 0.73 | 3.01 | 0.83 | |||||||
C-C case–control, CAD coronary artery disease, IS ischemic stroke, NA not available, HC hypercholesterolemics, NL normolipidemics, UK United Kingdom, PCR-RFLP polymerase chain reaction- restriction fragment length polymorphism
For lipid levels, ten papers separately provided data for more than one subpopulation (such as male and female groups, drinker and nondrinker groups, and so on), and we treated each subpopulation as a separate comparison. Therefore, 25 comparisons from 15 papers were used to evaluate the relationship between PCSK9 E670G polymorphism and serum lipid levels, including 14,558 participants. Of these, 22 comparisons from 14 papers, 20 comparisons from 13 papers, 21 comparisons from 14 papers and 23 comparisons from 14 papers presented the data on TC, TG, HDL-C and LDL-C, respectively. 11 comparisons were conducted in Asians, 11 in Caucasians, and 3 in other ethnic populations. Genotype distributions in 19 populations or subpopulations were consistent with HWE. Seven papers were case–control studies and eight papers were cohort studies.
Meta-analysis results
Association of the PCSK9 E670G polymorphism with the risk of CAD
Due to the rare GG genotype, the dominant and allelic contrast genetic models were used to evaluate the association of the PCSK9 E670G polymorphism with the risk of CAD. Because of absence of significant between-study heterogeneity, the fixed-effect model was applied. The pooled effects indicated that the G allele carriers had higher risk of CAD than non-carriers in dominant model (OR:1.601, 95 % CI: 1.314–1.951, P < 0.001), as well as in allelic model (OR: 1.546, 95 % CI: 1.301-1.838, P < 0.001) (Table 3, Fig. 2a, b).
Table 3.
Summary of meta-analysis of association of PCSK9 E670G polymorphism and CAD risk
| N | n (CAD/controls) | Dominant model | Allelic model | |||||||
|---|---|---|---|---|---|---|---|---|---|---|
| OR (95 % CI) | POR | I 2 (%) | PQ | OR (95 % CI) | POR | I 2 (%) | PQ | |||
| All | 9 | 1517/1795 | 1.601 (1.314–1.951) | <0.001 | 30.4 | 0.175 | 1.546 (1.301–1.838) | <0.001 | 36.3 | 0.128 |
| Ethnicity | ||||||||||
| Asians | 7 | 1215/1455 | 1.590 (1.278–1.978) | <0.001 | 44.0 | 0.098 | 1.503 (1.244–1.816) | <0.001 | 45.5 | 0.088 |
| non-Asians | 2 | 302/340 | 1.652 (1.040–2.626) | 0.034 | 0.0 | 0.386 | 1.788 (1.166–2.743) | 0.008 | 0 | 0.318 |
| HWE | ||||||||||
| P > 0.05 | 7 | 1397/1675 | 1.633 (1.321–2.018) | <0.01 | 41.7 | 0.11 | 1.627 (1.335–1.983) | <0.001 | 43.6 | 0.100 |
| P < 0.05 | 2 | 120/120 | 1.411 (0.819–2.430) | 0.215 | 0 | 0.327 | 1.306 (0.912–1.869) | 0.145 | 0 | 0.360 |
OR odds ratio, CI confidence interval, P OR p values for odds ratio, P Q p values for heterogeneity form Q-test, HWE Hardy-Weinberg equilibrium, N number of study, n number of individuals
Fig. 2.
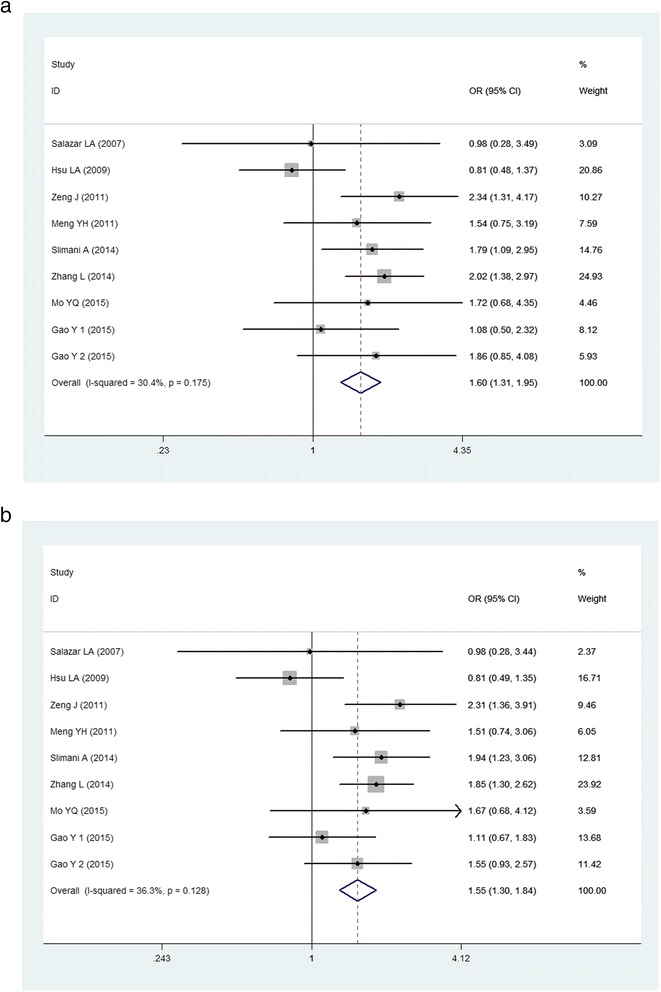
Forest plot of the association between PCSK9 E670G polymorphism and the risk of CAD (a): dominant genetic model, AG + GG vs AA; (b): allelic genetic model, G vs A)
Then the subgroup analyses stratified by ethnicity and HWE were performed. In the subgroup analyses stratified by ethnicity, significant associations were found among both Asians (for dominant model, OR: 1.590, 95 % CI: 1.278–1.978, P < 0.001; for allelic model, OR: 1.503, 95 % CI: 1.244–1.816, P < 0.001) and non-Asians (for dominant model, OR: 1.652, 95 % CI: 1.040–2.626, P = 0.034; for allelic model, OR: 1.788, 95 % CI: 1.166–2.743, P = 0.008). Subgroup analysis was also performed by HWE, significant association only existed in subgroup in HWE (for dominant model, OR: 1.633, 95 % CI: 1.321–2.018, P < 0.001; for allelic model, OR: 1.627, 95 % CI: 1.335–1.983, P < 0.001), suggesting that the results are credible.
Association of the PCSK9 E670G polymorphism with serum lipid levels
As shown in Table 4, in the whole population, the pooled effects indicated that the G allele carriers had higher TC and LDL-C levels than the non-carriers (for TC, SMD: 0.126, 95 % CI: 0.023–0.229, P = 0.016; for LDL-C, SMD: 0.170, 95 % CI: 0.053–0.287, P = 0.004, respectively) (Fig. 3a, b). There was no difference in the levels of TG and HDL-C between the G carriers and the non-carriers in the whole population (SMD: 0.031, 95 % CI: -0.048–0.110, P = 0.440; SMD: -0.123, 95 % CI: -0.251–0.006, P = 0.061, respectively) (Fig. 3c, d).
Table 4.
Summary of meta-analysis of association of PCSK9 E670G polymorphism and lipid levels
| TC | TG | HDL-C | LDL-C | |||||||||||||||||
|---|---|---|---|---|---|---|---|---|---|---|---|---|---|---|---|---|---|---|---|---|
| Group and subgroups | N/n | SMD (95 % CI) | P | I 2 (%) | PQ | N/n | SMD (95 % CI) | P | I 2 (%) | PQ | N/n | SMD (95 % CI) | P | I 2 (%) | PQ | N/n | SMD (95 % CI) | P | I 2 (%) | PQ |
| All | 22/13933 | 0.126 (0.023–0.229) | 0.016 | 57.4 | <0.001 | 20/6982 | 0.031 (−0.048–0.110) | 0.440 | 28.6 | 0.114 | 21/8147 | −0.123 (−0.251-0.006) | 0.061 | 63.7 | <0.001 | 23/14252 | 0.170 (0.053–0.287) | 0.004 | 68.2 | <0.001 |
| Ethnicity | ||||||||||||||||||||
| Asian | 11/3813 | 0.133 (−0.067–0.334) | 0.193 | 67.3 | <0.001 | 11/3813 | 0.075 (−0.031–0.180) | 0.164 | 12.6 | 0.325 | 11/3813 | −0.224 (−0.423–−0.025) | 0.027 | 66.5 | 0.001 | 11/3813 | 0.286 (0.021–0.551) | 0.034 | 81.4 | <0.001 |
| non-Asian | 11/10120 | 0.126 (0.014–0.238) | 0.027 | 46.5 | 0.044 | 9/3169 | −0.024 (−0.142–0.094) | 0.688 | 41.5 | 0.090 | 104234 | −0.017 (−0.165–0.132) | 0.825 | 48.5 | 0.042 | 12/10439 | 0.097 (0.011–0.184) | 0.027 | 18.8 | 0.259 |
| Type of study | ||||||||||||||||||||
| Cohort | 13/11668 | 0.133 (0.010–0.256) | 0.034 | 53.9 | 0.011 | 9/4411 | −0.097 (−0.222–0.029) | 0.132 | 14.4 | 0.31 | 10/5476 | 0.050 (−0.053–0.153) | 0.342 | 0.0 | 0.883 | 14/11987 | 0.100 (0.004–0.197) | 0.042 | 31.7 | 0.122 |
| C-C | 9/2265 | 0.119 (−0.077–0.315) | 0.235 | 65.4 | 0.003 | 11/2571 | 0.113 (0.012–0.214) | 0.028 | 7.1 | 0.376 | 11/2571 | −0.257 (−0.467–−0.048) | 0.016 | 74.3 | <0.001 | 9/2265 | 0.307 (0.027–0.588) | 0.031 | 83.3 | <0.001 |
C-C case–control, SMD standardized mean difference, CI confidence interval, P OR p values for odds ratio, P Q p values for heterogeneity form Q-test, TC total cholesterol, TG triglyceride, HDL-C high density lipoprotein cholesterol, LDL-C low-density lipoprotein cholesterol, N number of study, n number of individuals
Fig. 3.
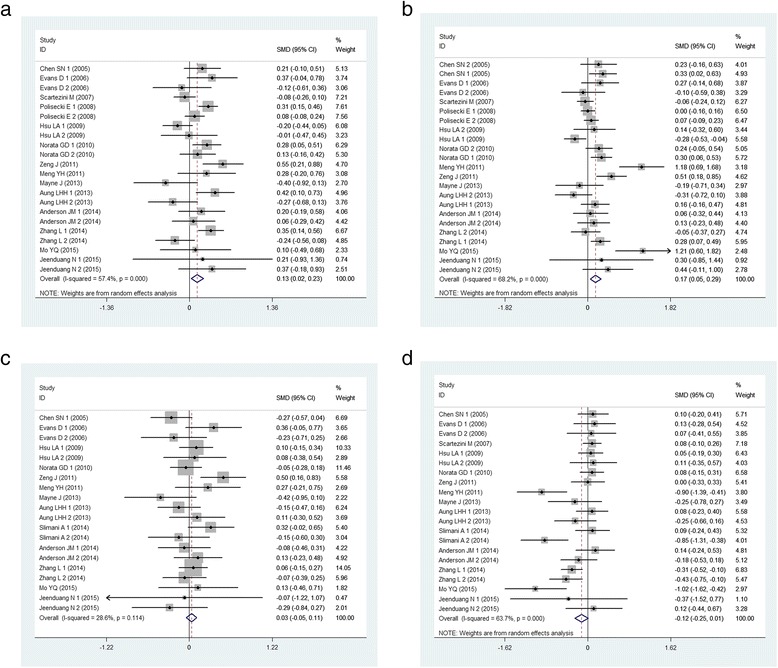
Forest plot of the associations between PCSK9 E670G polymorphism and lipid levels. (a): for TC levels, random-effect model; (b): for LDL-C levels, random-effect model; (c): for TG levels, fixed effect model; (d): for HDL-C levels, random-effect model)
The subgroup analyses stratified by ethnicity and type of study were also performed. In the non-Asian subgroup, the G carriers had higher TC levels than the non-carriers (SMD: 0.126, 95 % CI: 0.014-0.238, P = 0.027). The similar results existed in cohort subgroup. The association between PCSK9 E670G polymorphism and LDL-C levels was significant in all subgroups. Meanwhile, the G carriers had higher TG levels than the non-carriers (SMD: 0.113, 95 % CI: 0.012-0.214, P = 0.028) in the case–control subgroup. AG + GG genotypes had lower HDL-C levels than AA genotype in Asian subgroup (SMD: -0.224, 95 % CI: -0.423- -0.025, P = 0.027) and in case–control subgroup (SMD: -0.257, 95 % CI: -0.467--0.048, P = 0.016).
Heterogeneity analysis
For CAD, the between-study heterogeneity was not significant (for dominant model, I2 = 30.4 %, P = 0.175; for allelic model, I2 = 36.3 %, P = 0.128). For lipid levels, there was significant heterogeneity among the total comparisons for TC, HDL-C and LDL-C (for TC, I2 = 57.4 %, Pheterogeneity < 0.001; for HDL-C, I2 = 63.7 %, Pheterogeneity < 0.001; for LDL-C, I2 = 68.2 %, Pheterogeneity < 0.001). In order to explore the possible sources of heterogeneity, subgroup analyses stratified by ethnicity (Asian or non-Asian) and type of study (cohort or case–control) were performed. But the between-study heterogeneity was not obviously reduced under the subgroup analyses.
Sensitivity analysis
To evaluate the influence of single study on the whole result, the sensitivity analysis was carried out by calculating pooled estimates again when omitting a single study each time. The results suggested that no single study could influence the stability of the overall pooled estimates not only for CAD, but also for lipid levels (Additional file 2: Figure S1A-E).
Publication bias
The Begg’s funnel plot was performed to assess the publication bias and no visual publication bias was found in all the comparisons, which was confirmed by Egger’s test (for CAD: P = 0.095; for TC: P = 0.143; for TG: P = 0.585; for HDL-C: P = 0.295; for LDL-C: P = 0.464, respectively) (Additional file 3: Figure S2A-E).
Discussion
To our knowledge, the current meta-analysis was the first study to investigate the relationships between PCSK9 gene E670G polymorphism and lipid levels and the risk of CAD. Our study concluded that PCSK9 E670G polymorphism might be associated with lipid levels and the susceptibility to CAD.
A growing body of evidence indicated that PCSK9 might influence the serum lipid levels and the progression of atherosclerosis in vitro and in vivo. Through a post-transcriptional pathway, PCSK9 regulates the level of LDLR and then plays a major role in cholesterol homeostasis. In addition to the degradation of LDLR, PCSK9 may also have a potential effect on the apoB100, which may be another factor to atherosclerosis. The monoclonal antibodies of PCSK9 are going to the phase III clinical trials, which are expected to be the new hope for the patients with ADH.
In 2003, Abifadel et al. [27] firstly identified the mutation in the PCSK9 gene. Since then, a large number of LOF and GOF mutations were reported. Among them, E670G, as the GOF mutation, is one of the most commonly investigated PCSK9 gene polymorphisms. The association of PCSK9 genetic polymorphism with the disorders of lipid profile and risk of CAD has been intensively studied, but the results are inconclusive [9, 13–15, 18, 26, 28]. Even in the same ethnic population, the results were also inconsistent [7, 10, 21]. The discrepancies of the associations between PCSK9 E670G polymorphism and lipid levels and CAD among various populations may be due to the different characteristics of the study population, such as age, gender, ethnicity and/or environmental factors [29]. In addition, a small sample size may also be one cause. To diminish these influences, we retrieved all the relevant articles and analyzed the potential associations between PCSK9 E670G polymorphism and lipid levels and susceptibility to CAD. The present meta-analysis showed that 670G carriers had higher levels of TC and LDL-C than non-carriers and higher risk of CAD in overall populations (SMD: 0.126, 95 % CI: 0.023-0.229, P = 0.016; SMD: 0.170, 95 % CI: 0.053-0.287, P = 0.004, respectively). The dominant model suggested that 670G carriers were at a 1.601-fold higher risk of CAD than non-carriers. In the whole population, there was no difference in the levels of TG and HDL-C between the 670G carriers and non-carriers.
For the lipid study, there was a significant between-study heterogeneity, which may affect the interpretation of the results. To explore the heterogeneity, the subgroup analyses stratified by ethnicity and type of study were performed. But, we still could not explain the source of heterogeneity entirely. In the subgroup analyses, we found that 670G carriers had high TC levels in non-Asian populations (SMD: 0.126, 95 % CI: 0.014-0.238, P = 0.027) and in cohort studies (SMD: 0.133, 95 % CI: 0.010-0.256, P = 0.034). The association between this mutation and LDL-C levels was significant in all subgroups. Interestingly, the 670G carriers had higher TG levels in case–control subgroup (SMD: 0.113, 95 % CI: 0.012-0.214, P = 0.028). Moreover, the 670G carriers had lower HDL-C levels in Asian population (SMD: -0.224, 95 % CI: -0.423- -0.025, P = 0.027) and case–control subgroup (SMD: -0.257, 95 % CI: -0.467- -0.048, P = 0.016). The sensitivity analysis found that the pooled effects did not change after excluding single study each time, which indicated that the results were stable.
As other meta-analyses, there were several inherent limitations in this study. Firstly and mainly, the between-study heterogeneity is significant, which was a potential problem that may affect the interpretation of the results. As we all know, the between-study heterogeneity may be influenced by age, sex, sample size, type of study, and so on. Although the subgroup analyses were performed, the heterogeneity was not explained entirely. Secondly, the relationships between this SNP and CAD risk and lipid levels did not consider the confounding factors, such as age, sex, smoking, drinking and other lifestyle factors. In the study conducted by Evans et al, E670G polymorphism was associated with increased LDL-C levels in man but not in women. Thirdly, the number of studies included in the meta-analysis was small for CAD risk. Only one study was conducted in Caucasian population and one study was in African population. Fourthly, although the Egger’s tests indicated no remarkable publication bias in our meta-analysis, the inevitable publication bias may remain in the results because the papers having negative result were probably more difficult to be accepted for publication. Finally, the present meta-analysis was not able to assess gene-gene and gene-environment interactions.
Conclusions
Despite the limitations, the present meta-analysis concluded that PCSK9 E670G polymorphism was associated with CAD risk and lipid levels.
Acknowledgments
We thank all our colleagues working at the Department of Cardiology, Wujin hospital affiliated to Jiangsu University. This study was supported by the Science and technology project of Wujin (WS201317).
Additional files
Checklist S1 PRISMA Checklist. (DOC 54 kb)
Analysis of influence of individual study on the pooled estimate in dominant model for CAD risk and lipid levels. Open circle indicates that the pooled odds ratio, given named study is omitted. Horizontal lines represent the 95 % confidence intervals. (S1A: for CAD; S1B: for TC levels; S1C: for TG levels; S1D: for HDL-C levels; S1E: for LDL-C levels). (ZIP 385 kb)
Funnel plot for study of the associations between PCSK9 E670G polymorphism and the risk of CAD and lipid levels. Each point represents a separate study for the indicated association. Logor (y axis): the log of OR; s. e. of logor (x axis): the standard error of log (OR). (S2A: for CAD; S2B: for TC levels; S2C: for TG levels; S2D: for HDL-C levels; S2E: for LDL-C levels). (ZIP 108 kb)
Footnotes
Gaojun Cai and Bifeng Zhang contributed equally to this work.
Competing interests
The authors have declared that no competing interests exist.
Authors’ contributions
Conceived and designed the experiments: GJC. Performed the experiments: GJC BFZ GWS YBS CYM WJW. Analyzed the data: GJC BFZ. Contributed reagents/materials/analysis tools: GJC BFZ. Wrote the paper: GJC BFZ.
References
- 1.Mathers CD, Loncar D. Projections of global mortality and burden of disease from 2002 to 2030. PLoS Med. 2006;3:e442. doi: 10.1371/journal.pmed.0030442. [DOI] [PMC free article] [PubMed] [Google Scholar]
- 2.Cai GJ, Huang ZY, Zhang BF, Weng WJ, Shi GW. The associations between endothelial lipase 584C/T polymorphism and HDL-C level and coronary heart disease susceptibility: a meta-analysis. Lipids Health Dis. 2014;13:85. doi: 10.1186/1476-511X-13-85. [DOI] [PMC free article] [PubMed] [Google Scholar]
- 3.Zhang LL, Song KP, Zhu MT, Shi JL, Zhang HJ, Xu L, et al. Proprotein convertase subtilisin/kexin type 9 (PCSK9) in lipid metabolism, atherosclerosis and ischemic stroke. Int J Neurosci 2015, 1-14. Epub ahead of print. [DOI] [PubMed]
- 4.Soutar AK, Naoumova RP. Mechanisms of disease: genetic causes of familial hypercholesterolemia. Nat Clin Pract Cardiovasc Med. 2007;4:214–225. doi: 10.1038/ncpcardio0836. [DOI] [PubMed] [Google Scholar]
- 5.Sun H, Samarghandi A, Zhang N, Yao Z, Xiong M, Teng BB. Proprotein convertase subtilisin/kexin type 9 interacts with apolipoprotein B and prevents its intracellular degradation, irrespective of the low-density lipoprotein receptor. Arterioscler Thromb Vasc Biol. 2012;32:1585–1595. doi: 10.1161/ATVBAHA.112.250043. [DOI] [PubMed] [Google Scholar]
- 6.Naureckiene S, Ma L, Sreekumar K, Purandare U, Lo CF, Huang Y, et al. Functional characterization of Narc 1, a novel proteinase related to proteinase K. Arch Biochem Biophys. 2003;420:55. doi: 10.1016/j.abb.2003.09.011. [DOI] [PubMed] [Google Scholar]
- 7.Meng YH, Liu ZM. A study on the correlation between E670G polymorphism of PCSK9 gene and coronary artery disease in the Guangdong population. J Trop Med. 2011;11:137–140. [Google Scholar]
- 8.Slimani A, Harira Y, Trabelsi I, Jomaa W, Maatouk F, Hamda KB, et al. Effect of E670G polymorphism in PCSK9 gene on the risk and severity of coronary heart disease and ischemic stroke in a Tunisian cohort. J Mol Neurosci. 2014;53:150–157. doi: 10.1007/s12031-014-0238-2. [DOI] [PubMed] [Google Scholar]
- 9.Huang CC, Fornage M, Lloyd-Jones DM, Wei GS, Boerwinkle E, Liu K. Longitudinal association of PCSK9 sequence variations with low-density lipoprotein cholesterol levels: the Coronary Artery Risk Development in Young Adults Study. Circ Cardiovasc Genet. 2009;2:354–361. doi: 10.1161/CIRCGENETICS.108.828467. [DOI] [PMC free article] [PubMed] [Google Scholar]
- 10.Hsu LA, Teng MS, Ko YL, Chang CJ, Wu S, Wang CL, et al. The PCSK9 gene E670G polymorphism affects low-density lipoprotein cholesterol levels but is not a risk factor for coronary artery disease in ethnic Chinese in Taiwan. Clin Chem Lab Med. 2009;47:154–158. doi: 10.1515/CCLM.2009.032. [DOI] [PubMed] [Google Scholar]
- 11.Moher D, Liberati A, Tetzlaff J, Altman DG. Perferred reporting items for systematic reviews and meta-analyses: the PRISMA statement. Ann Intern Med. 2009;151:264–269. doi: 10.7326/0003-4819-151-4-200908180-00135. [DOI] [PubMed] [Google Scholar]
- 12.DerSimonian R, Kacker R. Random-effects model for meta-analysis of clinical trials: an update. Contemp Clin Trials. 2007;28:105–114. doi: 10.1016/j.cct.2006.04.004. [DOI] [PubMed] [Google Scholar]
- 13.Chen SN, Ballantyne CM, Gotto AM, Jr, Tan Y, Willerson JT, Marian AJ. A common PCSK9 haplotype, encompassing the E670G coding single nucleotide polymorphism, is a novel genetic marker for plasma low-density lipoprotein cholesterol levels and severity of coronary atherosclerosis. J Am Coll Cardiol. 2005;45:1611–1619. doi: 10.1016/j.jacc.2005.01.051. [DOI] [PMC free article] [PubMed] [Google Scholar]
- 14.Evans D, Beil FU. The E670G SNP in the PCSK9 gene is associated with polygenic hypercholesterolemia in men but not in women. BMC Med Genet. 2006;7:66. doi: 10.1186/1471-2350-7-66. [DOI] [PMC free article] [PubMed] [Google Scholar]
- 15.Scartezini M, Hubbart C, Whittall RA, Cooper JA, Neil AH, Humphries SE. The PCSK9 gene R46L variant is associated with lower plasma lipid levels and cardiovascular risk in healthy U.K. men. Clin Sci (Lond) 2007;113:435–441. doi: 10.1042/CS20070150. [DOI] [PubMed] [Google Scholar]
- 16.Salazar LA, Zambrano T, Jaramillo P, Lanas C, Lanas F. PCSK9 23968A/G gene polymorphism in Chilean individuals with coronary artery disease and controls. Atherosclerosis Supplements. 2007;8:24–24. doi: 10.1016/S1567-5688(07)71973-6. [DOI] [Google Scholar]
- 17.Polisecki E, Peter I, Robertson M, McMahon AD, Ford I, Packard C, et al. Genetic variation at the PCSK9 locus moderately lowers low-density lipoprotein cholesterol levels, but does not significantly lower vascular disease risk in an elderly population. Atherosclerosis. 2008;200:95–101. doi: 10.1016/j.atherosclerosis.2007.12.005. [DOI] [PMC free article] [PubMed] [Google Scholar]
- 18.Norata GD, Garlaschelli K, Grigore L, Raselli S, Tramontana S, Meneghetti F, et al. Effects of PCSK9 variants on common carotid artery intima media thickness and relation to ApoE alleles. Atherosclerosis. 2010;208:177–182. doi: 10.1016/j.atherosclerosis.2009.06.023. [DOI] [PubMed] [Google Scholar]
- 19.Zeng J, Liu Y, Zeng Z, Chen YC. Study on association between polymorphisms in pcsk9 gene and coronary heart disease. J Modern Medicine and Health. 2011;27:3202–3205. [Google Scholar]
- 20.Mayne J, Ooi TC, Raymond A, Cousins M, Bernier L, Dewpura T, et al. Differential effects of PCSK9 loss of function variants on serum lipid and PCSK9 levels in Caucasian and African Canadian populations. Lipids Health Dis. 2013;12:70. doi: 10.1186/1476-511X-12-70. [DOI] [PMC free article] [PubMed] [Google Scholar]
- 21.Aung LH, Yin RX, Wu DF, Cao XL, Hu XJ, Miao L. Proprotein convertase subtilisin/kexin type 9 gene E670G polymorphism interacts with alcohol consumption to modulate serum lipid levels. Int J Med Sci. 2013;10:124–132. doi: 10.7150/ijms.5296. [DOI] [PMC free article] [PubMed] [Google Scholar]
- 22.Anderson JM, Cerda A, Hirata MH, Rodrigues AC, Dorea EL, Bernik MM, et al. Influence of PCSK9 polymorphisms on plasma lipids and response to atorvastatin treatment in Brazilian subjects. J Clin Lipidol. 2014;8:256–264. doi: 10.1016/j.jacl.2014.02.008. [DOI] [PubMed] [Google Scholar]
- 23.Zhang L, Liu Y. The relationship between PCSK9 E670G gene polymorphism and efficacy of atorvastatin treatment with coronary heart disease. (Thesis), Tianjin Medical University, 2014. (Chinese).
- 24.Jeenduang N, Porntadavity S, Wanmasae S. Combined PCSK9 and APOE polymorphisms are genetic risk factors associated with elevated plasma lipid levels in a Thai population. Lipids. 2015;50:543–553. doi: 10.1007/s11745-015-4017-9. [DOI] [PubMed] [Google Scholar]
- 25.Gao Y, Wang CM, Huang ZL, Hao SM. Relationship between E670G polymorphism of PCSK9 gene and susceptibility to coronary heart disease in the Mongolian nationality. China Medical Herald. 2015;12:18–22. [Google Scholar]
- 26.Mo YQ, Li WQ, Zhong MR, Zhang XM. Dongguan Han patients with coronary artery PCSK9 gene SNP and its prognosis. Int J Lab Med. 2015;36:1725–1727. [Google Scholar]
- 27.Abifadel M, Varret M, Rabes JP, Allard D, Ouguerram K, Devillers M, et al. Mutations in PCSK9 cause autosomal domiant hypercholesterolemia. Nat Genet. 2003;34:154–156. doi: 10.1038/ng1161. [DOI] [PubMed] [Google Scholar]
- 28.Tsai CW, North KE, Tin A, Haack K, Franceschini N, Saroja Voruganti V, et al. Both rare and common variants in PCSK9 influence plasma low-density lipoprotein cholesterol level in American Indians. J Clin Endocrinol Metab. 2015;100:E345–E349. doi: 10.1210/jc.2014-3340. [DOI] [PMC free article] [PubMed] [Google Scholar]
- 29.Davignon J, Dubuc G, Seidah NG. The influence of PCSK9 polymorphisms on serum low-density lipoprotein cholesterol and risk of atherosclerosis. Curr Atheroscler Rep. 2010;12:308–315. doi: 10.1007/s11883-010-0123-6. [DOI] [PubMed] [Google Scholar]