Summary
Progesterone receptor (PR) expression is employed as a biomarker of estrogen receptor-α (ERα) function and breast cancer prognosis. We now show that PR is not merely an ERα-induced gene target, but is also an ERα-associated protein that modulates its behaviour. In the presence of agonist ligands, PR associates with ERα to direct ERα chromatin binding events within breast cancer cells, resulting in a unique gene expression programme that is associated with good clinical outcome. Progesterone inhibited estrogen-mediated growth of ERα+ cell line xenografts and primary ERα+ breast tumour explants and had increased anti-proliferative effects when coupled with an ERα antagonist. Copy number loss of PgR is a common feature in ERα+ breast cancers, explaining lower PR levels in a subset of cases. Our findings indicate that PR functions as a molecular rheostat to control ERα chromatin binding and transcriptional activity, which has important implications for prognosis and therapeutic interventions.
There is compelling evidence that inclusion of a progestogen as part of hormone replacement therapy (HRT) increases risk of breast cancer, implying that PR signalling can contribute towards tumour formation1. However, the increased risk of breast cancer associated with progestogen-containing HRT is mainly attributed to specific synthetic progestins, in particular medroxyprogesterone acetate (MPA), which is known to also have androgenic properties2. The relative risk is not significant when native progesterone is used3. In ERα+ breast cancers, PR is often used as a positive prognostic marker of disease outcome4, but the functional role of PR signalling remains unclear. While activation of PR may promote breast cancer in some women and in some model systems, progesterone treatment has been shown to be antiproliferative in ERα+ PR+ breast cancer cell lines5-7 and progestogens have been shown to oppose estrogen-stimulated growth of an ERα+ PR+ patient-derived xenograft8. In addition, exogenous expression of PR in ERα+ breast cancer cells blocks estrogen-mediated proliferation and ERα transcriptional activity9. Furthermore, in ERα+ breast cancer patients, PR is an independent predictor of response to adjuvant tamoxifen10, high levels of PR correlate with decreased metastatic events in early stage disease11 and administration of a progesterone injection prior to surgery can provide improved clinical benefit12. These observations imply that PR activation in the context of estrogen-driven, ERα+ breast cancer, can have an anti-tumourigenic effect. In support of this, PR agonists can exert clinical benefit in ERα+ breast cancer patients that have relapsed on ERα antagonists13.
Breast cancers are typically assessed for ERα, PR and HER2 expression to define histological subtype and guide treatment options. PR is an ERα-induced gene14 and ERα+ PR+ HER2- tumours tend to have the best clinical outcome because PR positivity is thought to reflect a tumour that is driven by an active ERα complex and therefore likely to respond to endocrine agents such as tamoxifen or aromatase inhibitors10,15. While ERα+ PR+ tumours have a better clinical outcome than ERα+ PR− tumours4, clinical response to ERα antagonists can vary, even among tumours with similar ERα and PR status15,16 and recent evidence suggests that PR may be prognostic, but not predictive17. Some ERα+ PR− tumours that are resistant to one class of ERα antagonists gain clinical benefit from another class, suggesting that in a subset of ERα+ PR− breast cancers, the lack of PR expression does not reflect a nonfunctional ERα complex. It has been proposed that the non-functional ERα complex theory cannot completely explain PR negativity18. An alternative hypothesis is that other factors contribute to the loss of PR expression, which consequently influences breast tumour responses to ERα target therapies.
PR is recruited to the ERα complex
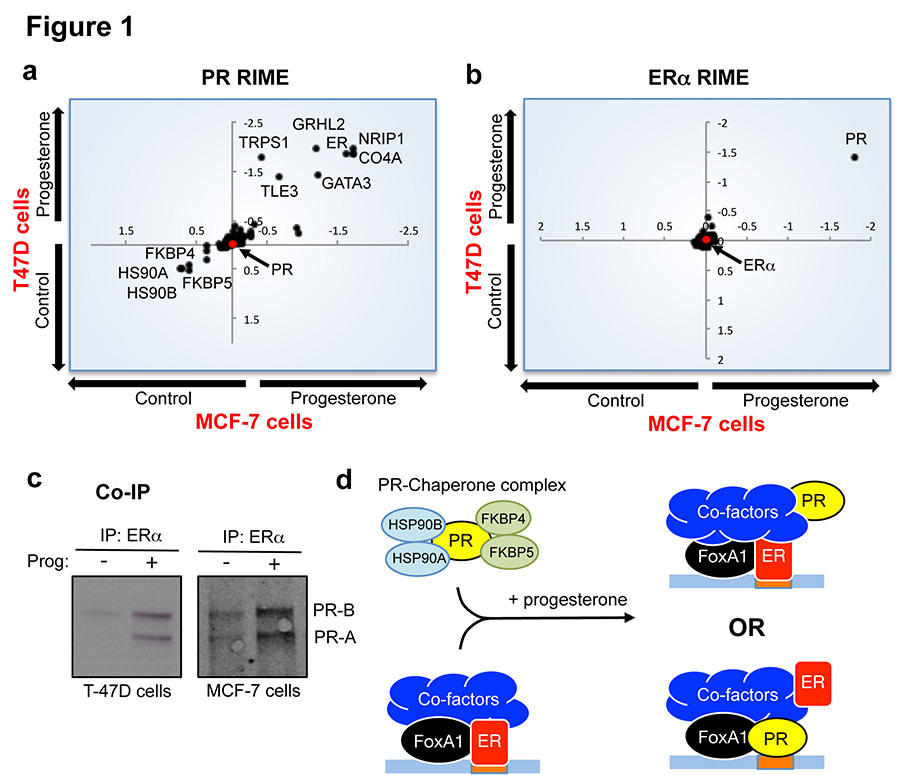
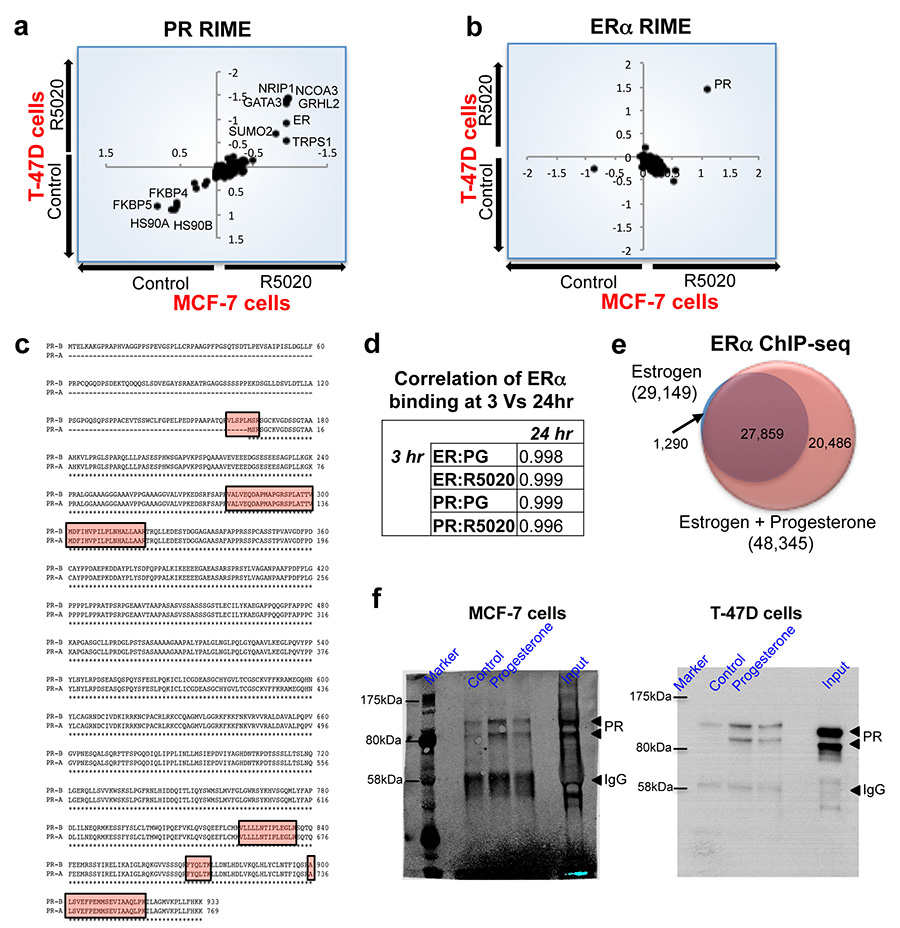
Given the controversial and complex interplay between the ERα and PR pathways in breast cancer, we explored the possible functional crosstalk between these two transcription factors and the implications for clinical prognosis in ERα+ disease. Ligand-activated ERα and PR protein complexes were purified to ascertain interplay between these two transcription factors. Asynchronous ERα+ PR+ MCF-7 and T-47D breast cancer cells were grown in SILAC-labelled growth media, which contains sufficient estrogen to elicit maximal ERα binding to chromatin19. Estrogen treatment is required to induce detectable levels of PR in MCF-7 cells but not T-47D cells20. The two cell lines were subsequently treated with vehicle or one of two progestogens: native progesterone or the synthetic progestin R5020. Cells were cross-linked following hormone treatment and endogenous PR was immunopurified followed by mass spectrometry, using a technique we recently developed called RIME21. Under estrogenic conditions, progesterone treatment significantly induced an interaction between PR and ERα in the MCF-7 and T-47D cell lines, in support of previous findings showing a physical interaction between these two nuclear receptors22. In addition to ERα, progesterone treatment induced interactions between PR and known ERα-associated co-factors, including NRIP1, GATA3 and TLE321 in both cell lines (Figure 1a). As expected, treatment with natural ligand decreased interaction between PR and chaperone/co-chaperone proteins such as HSP90 and FKBP4/5 (Figure 1a). The same findings were observed when R5020 was used as a synthetic ligand (Extended data figure 1). Interestingly, when ERα was purified under the same treatment conditions, PR was the only differentially recruited protein in both cell lines (Figure 1b). Moreover, the interaction between ERα and known ERα-associated co-factors was not differentially affected by progesterone treatment. A list of all interacting proteins under all experimental conditions is provided in Supplementary table 1. The progesterone-induced ERα-PR interaction was confirmed by standard co-IP experiments in both MCF-7 and T-47D cells (Figure 1c). We conclude that activation of PR results in a robust association between PR and the ERα complex. However, it remains unclear what impact this may have on ERα/PR DNA binding or what the primary DNA tethering mechanism may be (Figure 1d).
Figure 1. PR is a novel ERα interacting protein following progesterone treatment.
MCF-7 and T-47D breast cancer cells were SILAC labelled, treated with hormones and harvested for RIME (endogenous protein purification-mass spectrometry) of either PR (a) or ERα (b). Differential proteins identified in both cell lines are plotted and all proteins are provided in Supplementary table 1. The axes represent log fold change. c. Co-IP validation of PR interactions with ERα. Both PR isoforms interact with ERα. d. Model showing possible mechanisms of interplay between PR and ERα (ER)-co-factor complex.
Progesterone reprograms ERα binding events
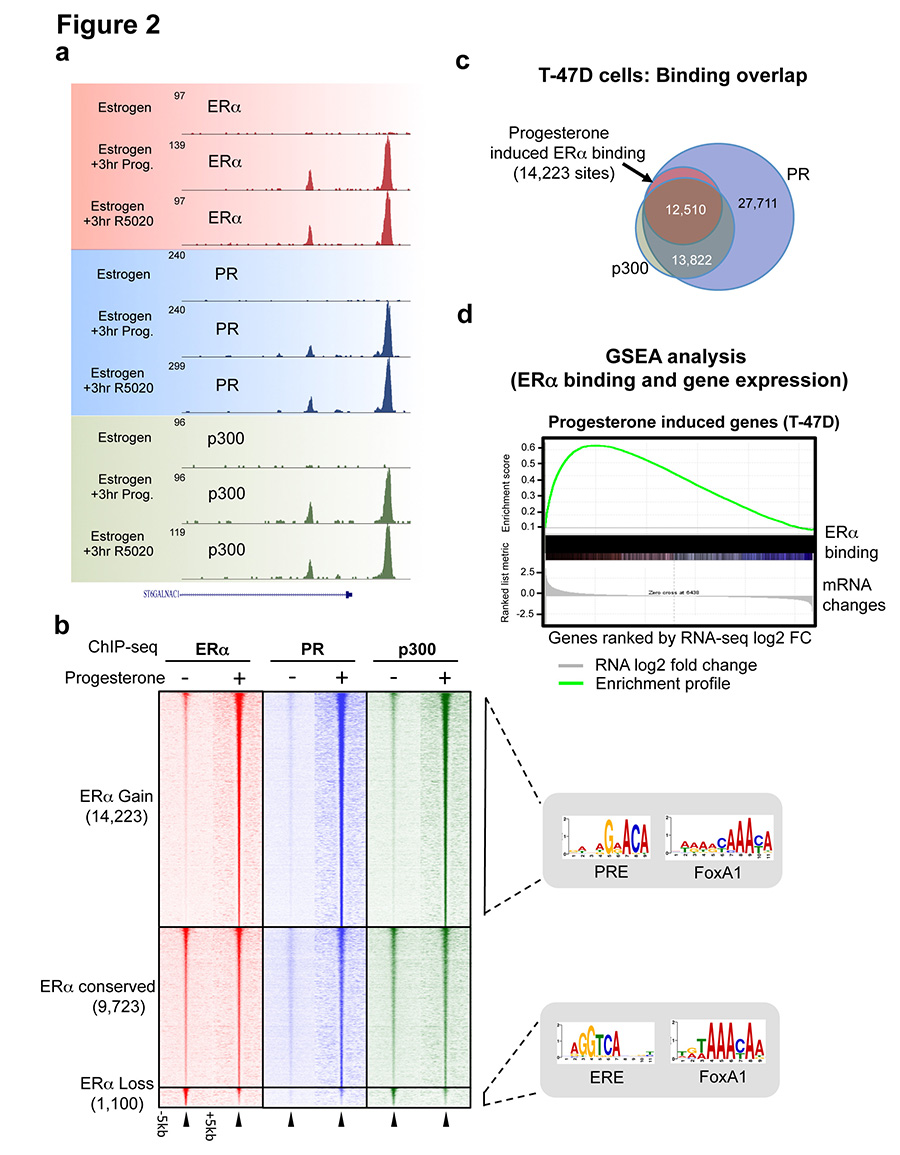
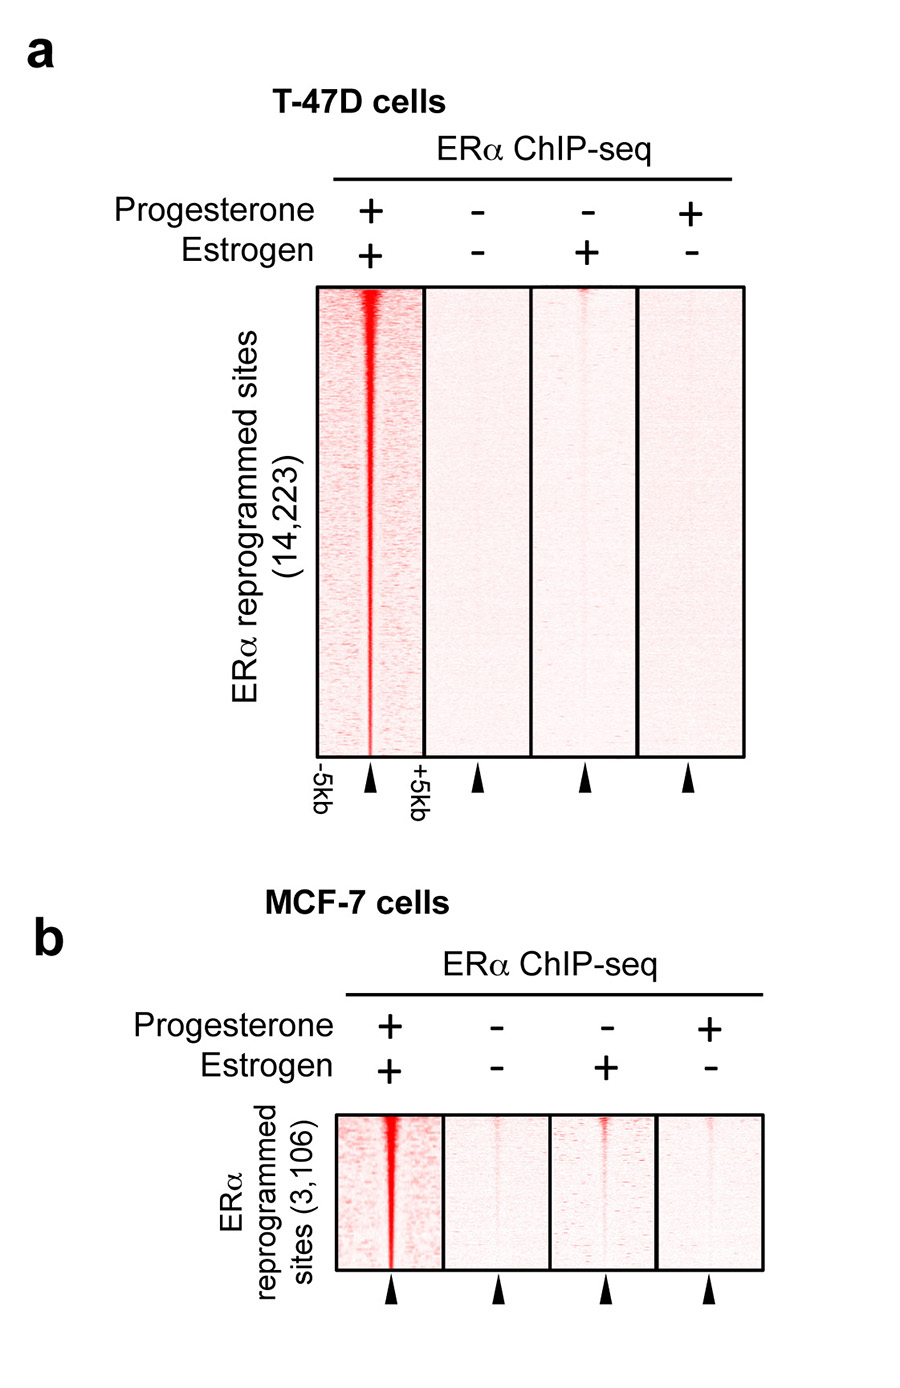
Since PR is a transcription factor, we hypothesised that the progestogen-induced interaction between PR and ERα alters chromatin binding properties of the ERα-co-factor complex. MCF-7 and T-47D cell lines grown in complete (estrogenic) media were stimulated with progesterone, R5020 or vehicle control for 3 or 24 hours, followed by analysis of genome-wide ERα and PR and the co-activator p300 profiles by ChIP-seq. p300 deposits the H3K27Ac mark, which is indicative of functional enhancers23. We found comparable ERα, PR and p300 binding at 3 hours and 24 hours (Extended data figure 1 and data not shown) and chose 3hr for the remaining experiments. All ChIP-seq experiments were subsequently repeated in triplicate following 3 hours of treatment (sample clustering is provided in Extended data figure 2). Whereas robust ERα binding (29,149 sites in MCF-7 cells and 8,438 sites in T-47D cells) was observed in estrogenic conditions, limited PR binding events were seen under these conditions (Supplementary table 2). Treatment with progesterone or the synthetic progestin R5020 in estrogen-rich media resulted in robust PR recruitment to chromatin, with 46,191 PR binding events observed in T-47D cells with both ligands and 29,554 PR binding events in MCF-7 cells. Using DiffBind to identify differential peaks24 that occurred following treatment of cells with progesterone or R5020, a rapid and robust redistribution of ERα binding to novel genomic loci was observed (Figure 2a and 2b). In T-47D cells, 14,223 ERα binding events were reproducibly gained following 3 hours of treatment with progesterone, a finding that was similar following stimulation with R5020, confirming a predictable redistribution of ERα chromatin binding following stimulation of the PR pathway. A similar rapid redirection of ERα was observed in MCF-7 cells after progesterone or R5020 treatment (Extended data figure 1). The ERα sites reprogrammed by progesterone are likely to be functional, as indicated by the global recruitment of the co-activator p300 (Figure 2b and Extended data figure 2). These ERα binding events appear to be mediated by PR, since 99% of the gained ERα binding sites in T-47D cells overlapped with a PR binding event (Figure 2c) (the overlap in MCF-7 cells was 94%) and motif analysis of the ERα gained sites revealed the presence of progesterone responsive elements (PREs), but not estrogen responsive elements (EREs) (Figure 2b). This suggests that PR mediates the interaction between the ERα/PR/p300 complex and DNA. ERα ChIP-seq was repeated in MCF-7 and T-47D cells following hormone deprivation and subsequent treatment with vehicle, estrogen alone or progesterone alone. Single hormone treatments did not induce the ERα binding events observed under dual hormone conditions (Extended data figure 3), confirming that the ERα reprogramming is dependent on having both receptors activated simultaneously. In addition, Forkhead motifs were enriched at the ERα gained sites and 49% of the gained ERα/PR binding events were shown to overlap with FoxA1 binding (Extended data figure 4), consistent with previous findings showing that PR binding involves the pioneer factor FoxA125. In keeping with the anti-proliferative effects of progestogens in ERα+ breast cancer cells, analysis of the genes bound by ERα following progesterone treatment revealed enrichment for cell death, apoptosis and differentiation pathways (Supplementary table 3).
Figure 2. Progesterone redirects estrogen-stimulated ERα binding events to novel chromatin loci and transcriptional targets.
ChIP-seq for ERα, PR and the co-activator p300 in T-47D cells grown in estrogen-rich media and treated with progesterone or R5020. a. Example binding region of a progesterone/R5020 induced ERα, PR and p300 binding event. b. Heatmap of ERα, PR and p300 ChIP-seq data from T-47D cells after 3hr of progesterone treatment. The heatmap is shown in a horizontal window of −/+ 5kb. Also shown are the enriched motifs within each category. c. Overlap between progesterone-induced ERα, PR and p300 binding sites, representing only the progestogen-induced ERα binding events. d. RNA-seq was performed after progesterone or R5020 treatment for 3hr under estrogenic condition (control). GSEA analysis was conducted, comparing progestogen-induced transcripts with progestogen-induced ERα binding events within T-47D cells.
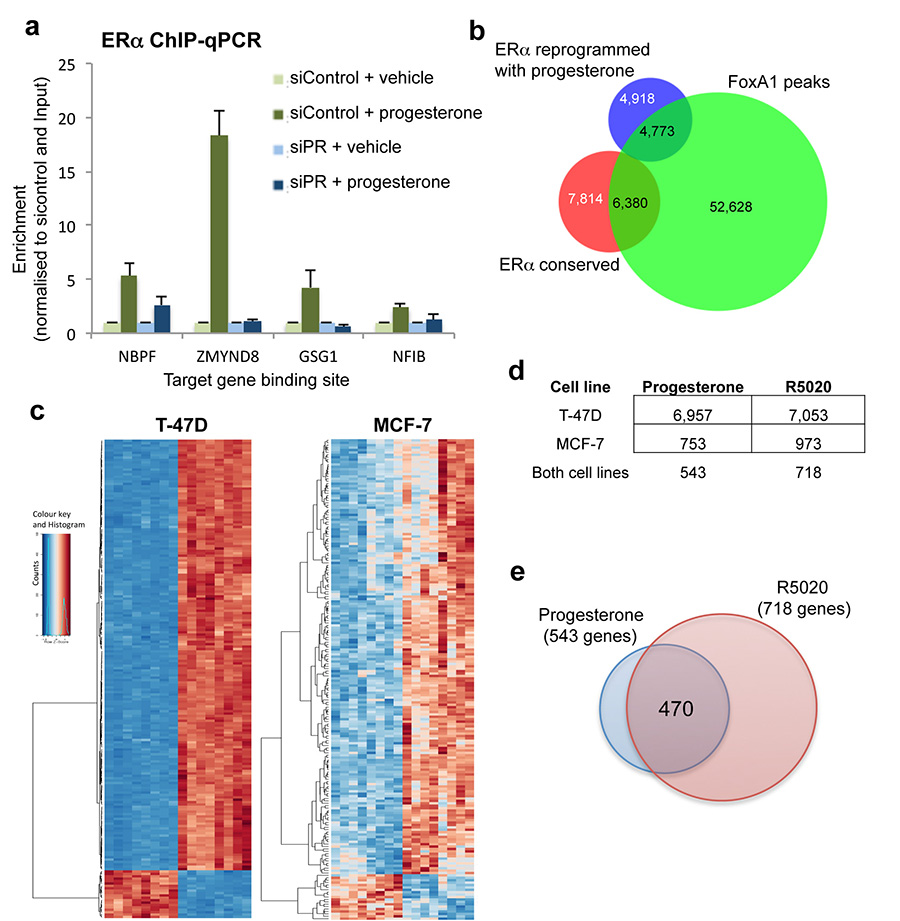
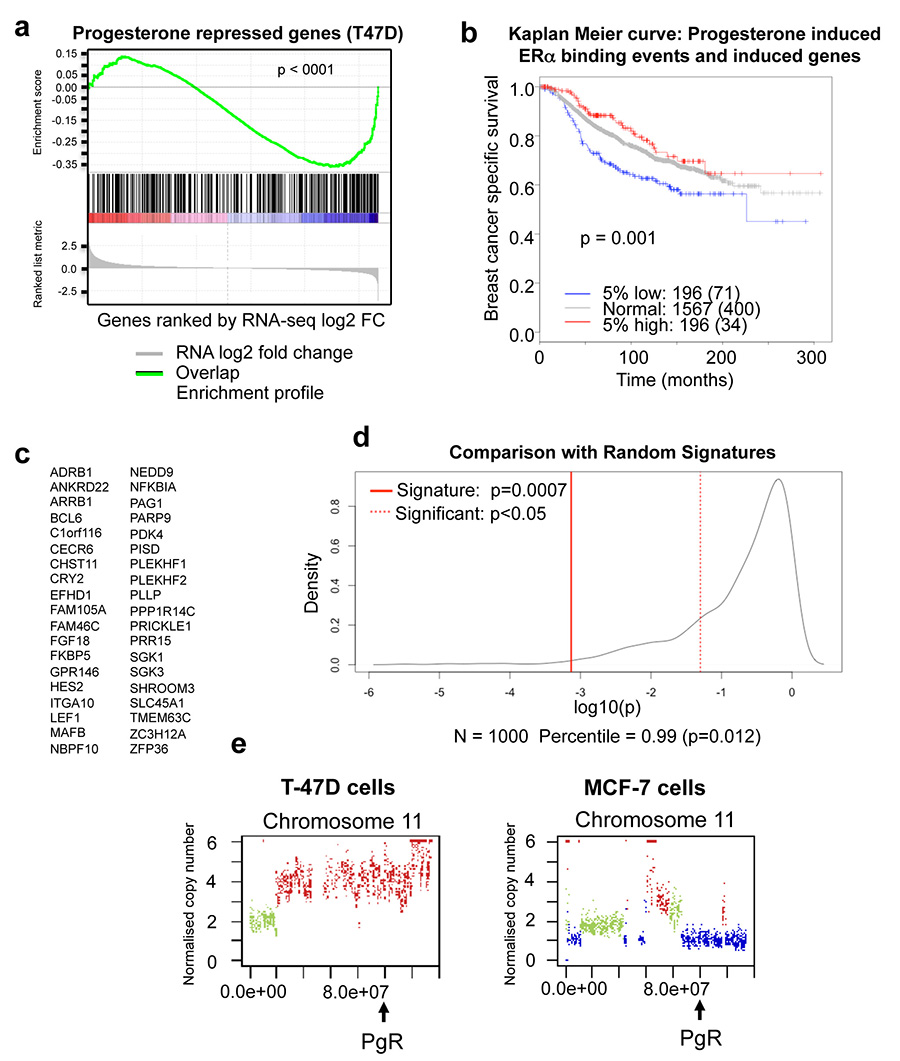
To identify the transcriptional targets of the progestogen-induced ERα binding events, we treated estrogen-stimulated MCF-7 and T-47D cells with progesterone, R5020 or vehicle for 3 hours and performed eight replicates of RNA-seq. In total, 470 genes were differentially regulated by dual treatment with estrogen and progesterone or R5020 compared to estrogen alone in both T-47D and MCF7 cell lines (Extended data figure 4). GSEA analysis revealed a pronounced enrichment of progestogen-induced ERα binding events near genes up-regulated by progestogen treatment in the presence of estrogen (Figure 2d). Collectively, these findings suggest that the progestogen-mediated changes in ERα binding events are functionally significant, since they co-recruit p300 and lead to new gene expression profiles (Figure 2d and Extended data figure 4). Importantly, increased expression of a gene signature that results from progesterone-stimulated ERα binding confers good prognosis in a cohort of 1,959 breast cancer patients (Extended data figure 5).
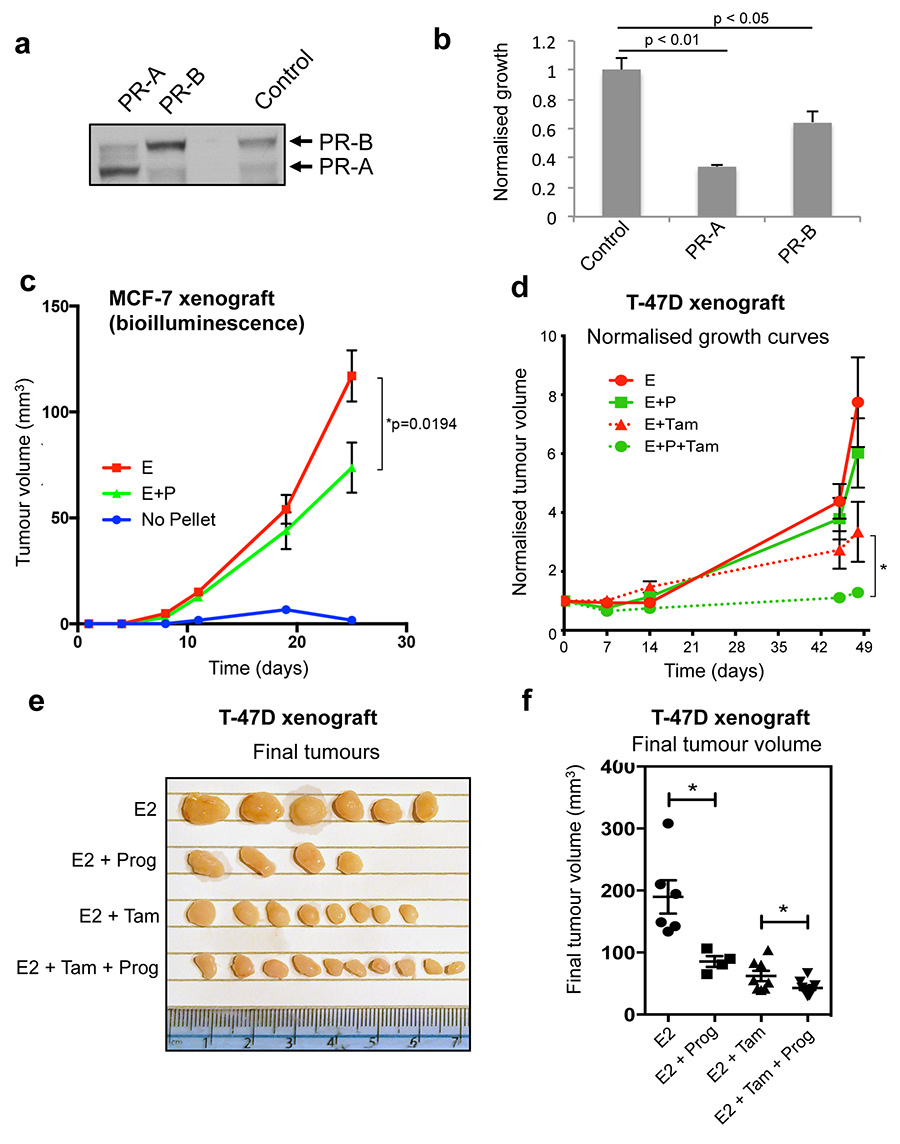
The relative degree of ERα reprogramming and gene expression changes following progesterone treatment was higher in T-47D cells compared to MCF-7 cells (Supplementary table 2), possibly due to the differences in PR levels between these two cell lines20. We assessed the PR gene (PgR) in these cell lines, which revealed copy number gain of the PgR gene in T-47D cells and a heterozygous loss of the PgR gene in MCF-7 cells (Extended data figure 5). Exogenous expression of PR (both isoforms) in the MCF-7 cell line resulted in growth inhibition (Extended data figure 6), confirming an anti-proliferative role for PR, via modulation of ERα transcriptional activity9.
Progesterone blocks ERα+ tumour growth
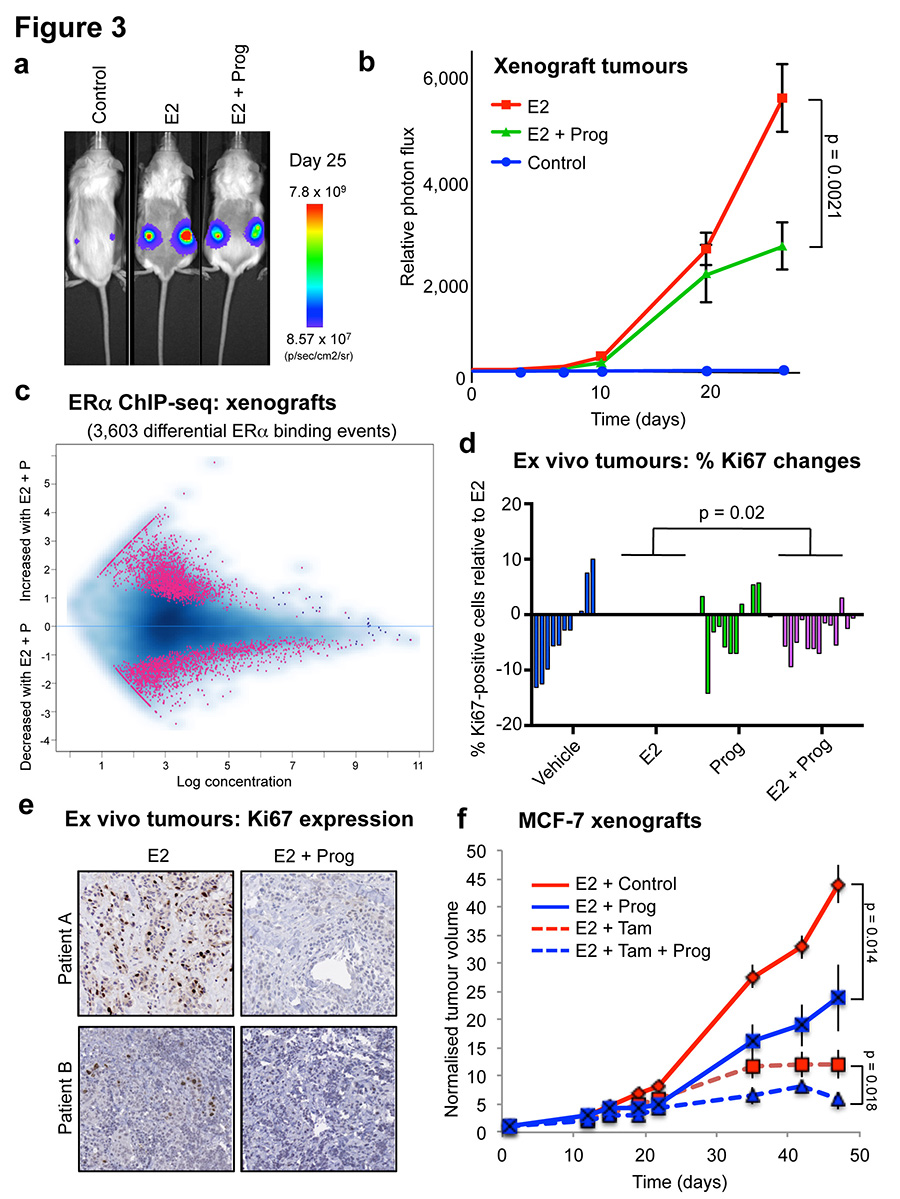
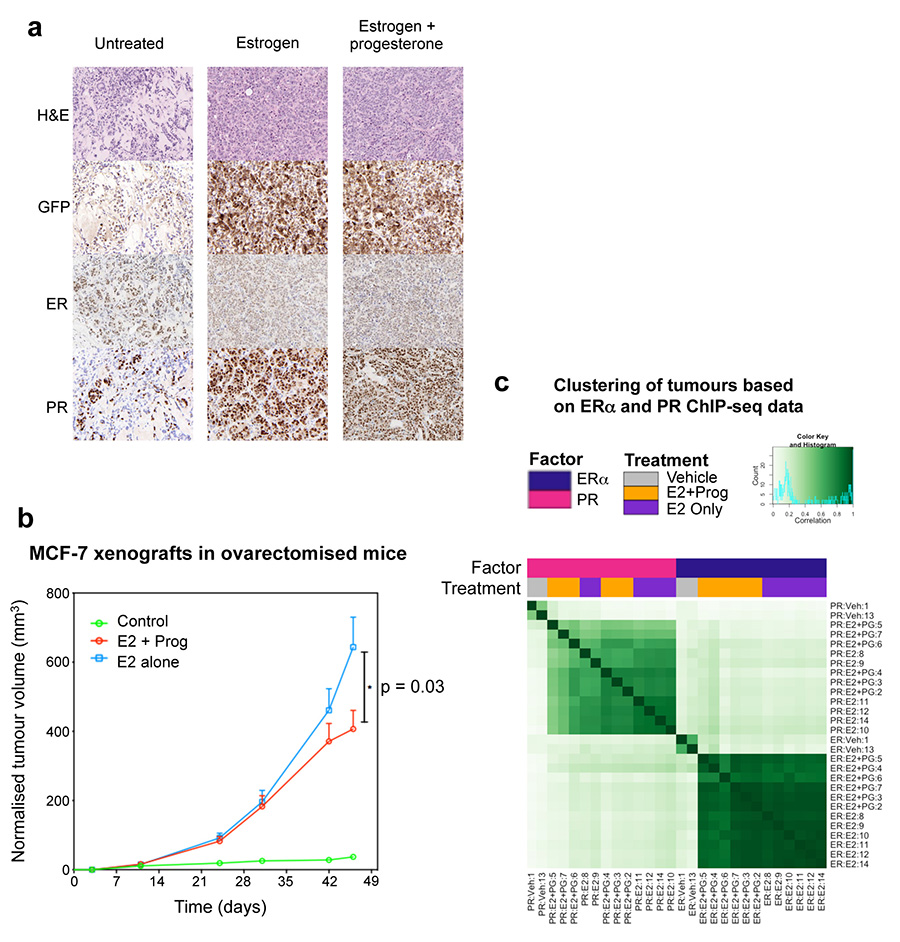
To explore the hypothesis that progesterone stimulation could have beneficial effects on ERα+ tumour growth in vivo, we established MCF-7-Luciferase xenografts in NOD/SCID/IL2Rg-/- (NSG) mice and exposed the mice to control (i.e. no hormone), slow release estrogen pellets or slow release estrogen plus standard high concentration progesterone pellets26. Ten tumours for each condition were implanted (two tumours per mouse and five mice per condition) and tumour formation was monitored using bioluminescent imaging. After 25 days, in the absence of any hormone, tumours did not grow, but stimulation with estrogen alone resulted in tumour growth. Co-treatment with estrogen plus progesterone resulted in a significant decrease in tumour volume, as compared to estrogen alone, when measured by bioluminescence (Figure 3a and 3b) (p = 0.0021) or tumour volume (p = 0.019) (Extended data figure 6). Immunohistochemistry confirmed that PR expression was induced under both estrogen and estrogen plus progesterone conditions (Extended data figure 7), but importantly, PR will only be active under dual hormone conditions. We repeated the MCF-7 xenograft experiment in ovariectomised mice, in order to eliminate any confounding issues related to endogenous mouse hormones. Assessment of tumour growth (Extended data figure 7) confirmed the previous finding (Figure 3b) that progesterone inhibited tumour formation. We performed ERα and PR ChIP-seq on six randomly selected sets of matched estrogen or estrogen plus progesterone stimulated xenograft tumours (taken from the final time point) and identified differentially bound ERα binding events. The major variable driving clustering of ERα binding events within tumour xenografts was the treatment condition (Extended data figure 7). As observed in the short-term cell line experiments (Figure 2), estrogen-stimulated ERα binding in the xenograft tumours was substantially altered by progesterone treatment. We observed 3,603 differentially regulated ERα binding events in xenograft tumours from estrogen plus progesterone conditions, when compared to estrogen-only conditions (Figure 3c). As such, progesterone induced a global reprogramming of ERα binding events in vivo, even following long-term hormonal treatment.
Figure 3. Progesterone treatment inhibits ERα+ tumour progression.
a. MCF-7-Luciferase cells were implanted in NSG mice with control, estrogen (E2) pellets or estrogen plus progesterone (E2 + Prog) pellets (n = 10). b. Graphical representation of tumour formation, as assessed by bioluminescence. c. ERα ChIP-seq was conducted on randomly chosen (n = 6) xenograft tumours from ovariectomised NSG mice treated with estrogen alone or estrogen plus progesterone. MA plot representing changes in ERα binding. d. Proliferative responses (Ki67 staining) of primary breast cancer tissues cultured ex vivo with estrogen (E2) or progestin (R5020) alone or both in combination (n = 14 samples/treatment; except for vehicle (n = 11) and R5020 treatments (n =12)). The p-value was calculated using a linear mixed effect analysis. e. Representative images of Ki67 immunostaining in ex vivo cultured breast tumour tissue sections from two patients (scale bar = 100um). f. MCF-7 xenografts were grown in NSG mice in the presence of estrogen pellets. Mice were treated with vehicle, tamoxifen, progesterone or tamoxifen plus progesterone and normalised tumour volume is shown. The data was analysed using a t-test and the error bars represent +/- SEM.
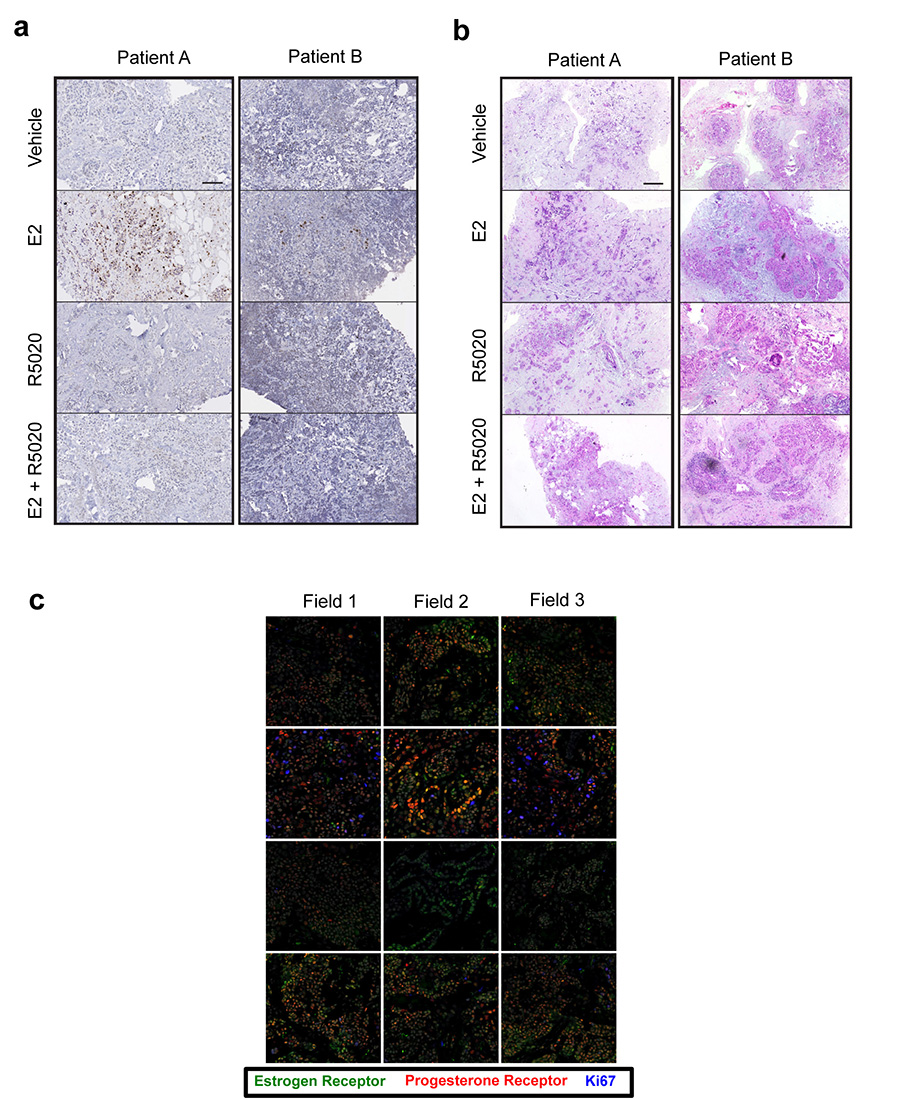
To extend our findings into primary tumours, we employed a novel ex vivo primary tumour culture system27,28 to cultivate ERα+ PR+ primary tumours for short time periods, in order to study the effect of hormonal treatment on cell growth. Fourteen independent ERα+ PR+ primary tumours were used for the analysis. Each tumour was cut into small pieces and randomised onto gelatine sponges half-submersed in media to sustain tissue architecture and viability. Tumour explants were then cultivated under hormone-deprived conditions for 36 hours, followed by a 48 hour treatment with vehicle control, estrogen, the synthetic progestin R5020 or estrogen plus R5020. Tumours retained normal cellular and morphological features after treatment in the ex vivo context (Extended data figure 8). Fixed tissues were stained for Ki67 to assess changes in proliferation. Most of the tumours responded to estrogen with a coincident increase in the percentage of cells that expressed Ki67. Co-treatment with progestin significantly inhibited estrogen-stimulated proliferation (Figure 3d and Extended data figure 8), showing that progesterone can antagonise estrogen-induced growth in primary human breast tumours cultivated as explants. Example images are shown in Figure 3e. Importantly, the addition of progestin alone did not increase growth rates (Figure 3d and Extended data figure 8), in support of our hypothesis that progesterone lacks proliferative potential and importantly, is anti-proliferative in an estrogen-driven context. ERα and PR co-localisation was confirmed in the explant tumour samples using immunofluorescence, as was the reduction in Ki67 following progestogen treatment (Extended data figure 8).
Given our findings that progestogens are anti-proliferative in an estrogen-driven tumour context, we combined progesterone treatment with a standard of care therapy in xenograft models. MCF-7 xenografts were implanted in NSG mice and supplemented with slow-release estrogen pellets. Mice were subsequently treated with vehicle, progesterone alone, tamoxifen alone or progesterone plus tamoxifen and tumour growth was monitored. As previously seen (Figure 3b and Extended data figure 6), progesterone antagonised estrogen-induced tumour formation, as did tamoxifen alone, but the combination of tamoxifen plus progesterone had the greatest tumour inhibitory effect (Figure 3f). This experiment was repeated in a second xenograft model (T-47D cells), confirming the finding that tumour volume was inhibited by progesterone alone, but the greatest degree of tumour inhibition was observed under conditions where an ERα antagonist (tamoxifen) was coupled with a PR agonist (progesterone) (Extended data figure 6).
PgR copy number alterations are common
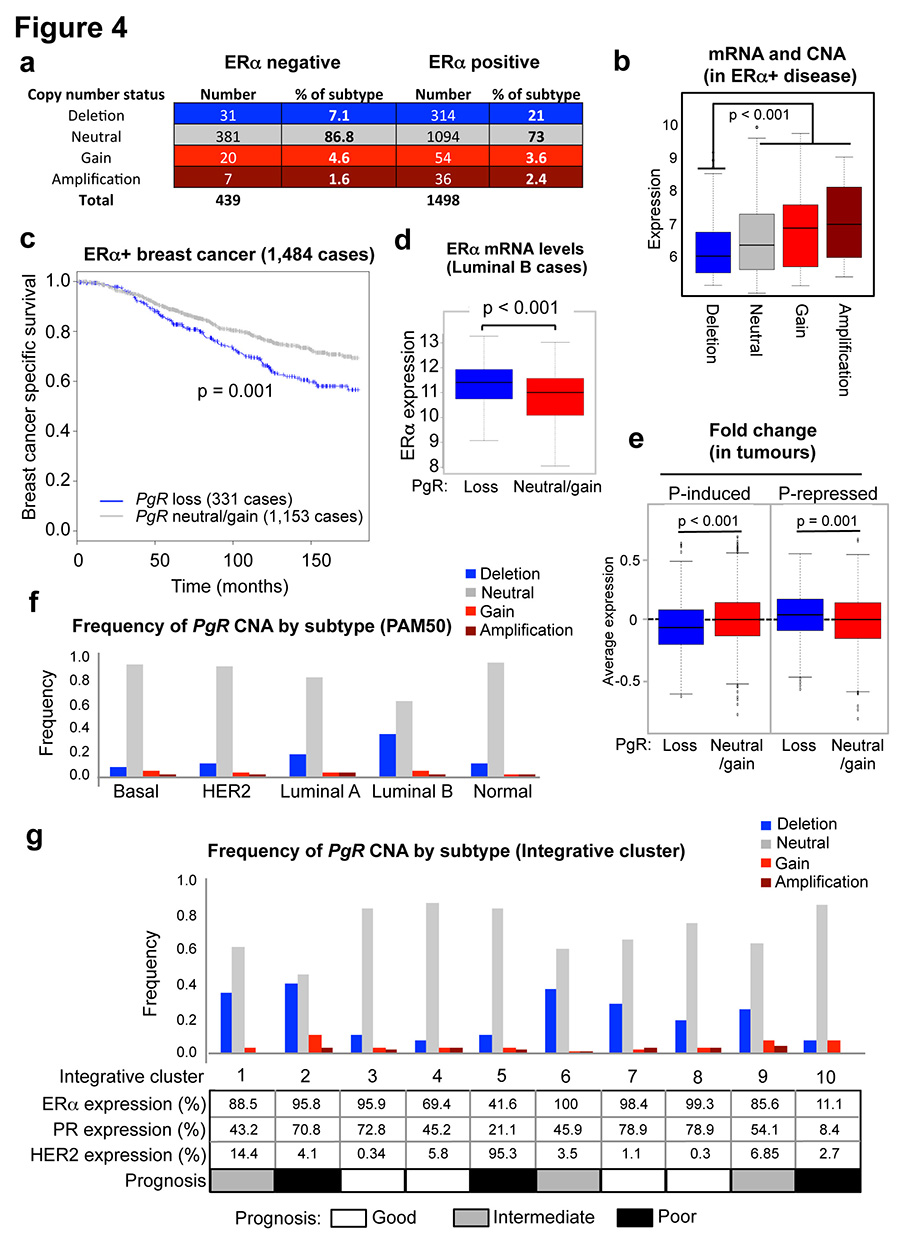
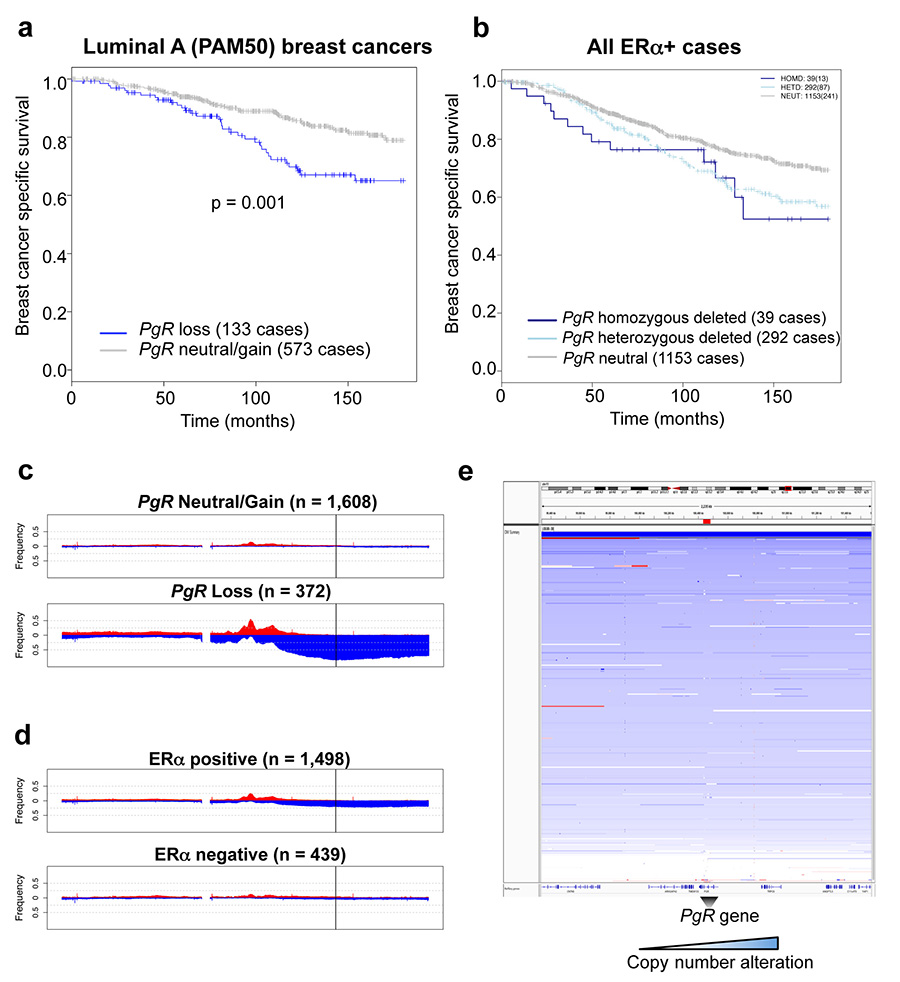
Given the PgR copy number loss observed in the MCF-7 cell line (Extended data figure 5), we explored whether this was a common phenomenon observed in breast cancer patients, by assessing genomic copy number alterations (CNA) within the METABRIC cohort of ~2,000 breast cancers29. This analysis revealed that 18.5% of all breast cancers possess a copy number loss in the PgR genomic locus and these are biased towards ERα+ cases (Figure 4a). This level of loss of heterozygosity (LOH) has been previously observed at this genomic locus in a small cohort of patients30. In total, 21% of ERα+ breast cancers contain a heterozygous or a homozygous deletion of the PgR genomic locus and these tumours had significantly (p < 0.001) lower PR mRNA levels (Figure 4b). Importantly, within the 1,484 ERα+ cases, tumours with copy number loss of the PgR genomic region had a poorer clinical outcome (p = 0.001) (Figure 4c), suggesting that inactivation of the PgR gene contributes to worse outcome within this subset of ERα tumours.
Figure 4. The PgR genomic locus undergoes copy number loss in ERα+ breast cancer.
a. METABRIC breast cancers (1,937 in total) were assessed for copy number change in the PgR genomic locus. b. Correlation between PR mRNA levels and copy number status within all ERα+ cases. The estimate of differences is 0.3551, 95% confidence interval: [0.244, 0.463]. c. Kaplan Meier curve showing breast cancer specific survival in all ERα+ cases. Cox model analysis: Hazard ratio = 1.46 [1.156, 1.843]. d. Changes in ERα mRNA levels in luminal B tumours within the METABRIC cases. The estimate of differences is 0.4436, 95% confidence interval: [0.269, 0.618]. e. The expression levels of the stringent progestogen-induced or repressed genes from the cell lines cultured under estrogenic conditions, were assessed in the ERα+ METABRIC tumours. Relative fraction of tumours with PgR CNA events within molecular subtypes, based on the PAM50 gene expression profile (f) and the ten integrative clusters (g).
ERα mRNA levels are significantly higher in tumours with PgR copy number loss (Figure 4d). Copy number loss of PgR affects gene expression events, since the expression level of genes shown to be progestogen-induced under estrogenic conditions in the cell lines was significantly lower (p < 0.001) in tumours with PgR copy number loss and, inversely, the expression level of genes repressed by progestogens was significantly elevated (p = 0.001) in tumours with an inactivated PgR gene (Figure 4e).
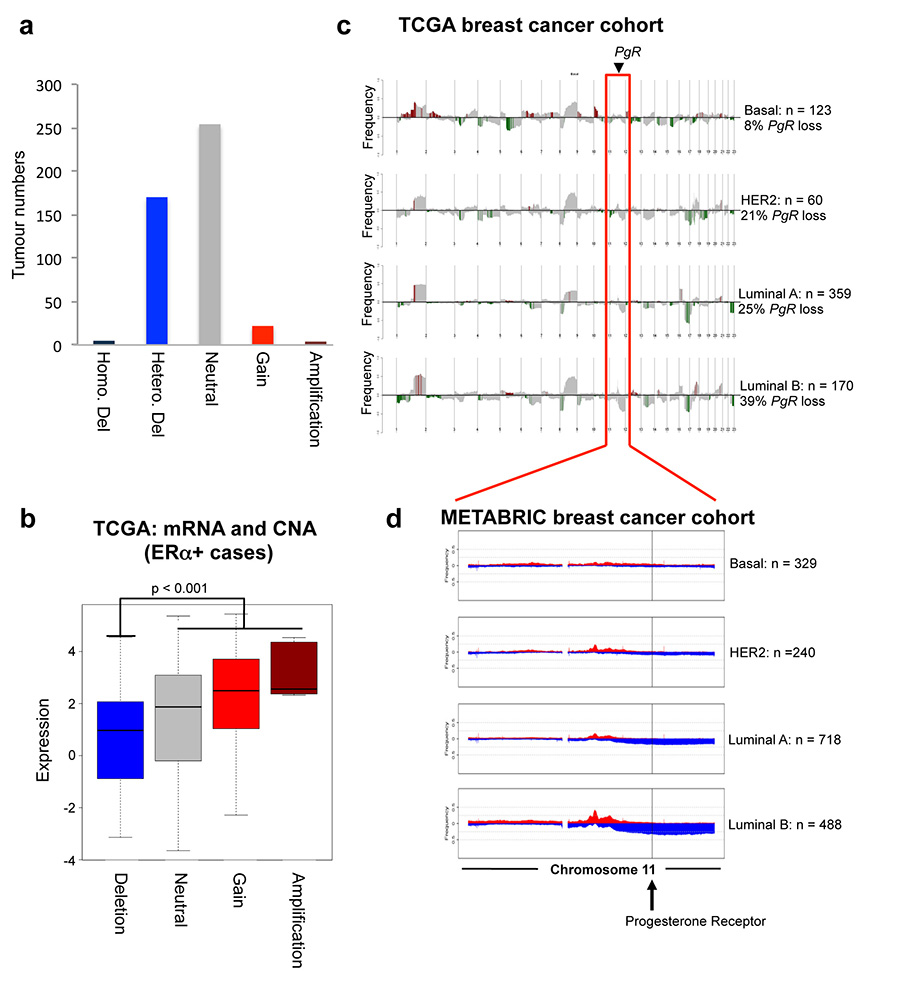
Using PAM50 breast cancer subtype stratification, 33% of luminal B tumours (typically poor prognosis and PR low/negative) possessed copy number loss of the PgR genomic region (Figure 4f), explaining the lower PR protein levels in one third of this breast cancer subtype. In addition, even within the luminal A tumours only (which tend to have a better outcome), 19% have a copy number loss of PgR and this subset of luminal A tumours have a poorer clinical outcome (Extended data figure 9). Tumours were then stratified based on the ten recently described genomic integrative clusters29, revealing three ERα+ subtypes (int. clusters 1, 2 and 6) with at least 35% PgR copy number loss (Figure 4g). All three of these integrative clusters have intermediate or poor clinical outcome (Figure 4g). Data showing genomic copy number changes on the chromosome 11 arm that encompasses the PgR gene are shown in Extended data figure 9. This level of PgR copy number loss was even higher in an independent cohort of breast cancer patients: 29% of luminal (ERα+) breast cancers from TCGA31 (Extended data figure 10). Within luminal B tumours only, 39% of TCGA breast cancer cases had a PgR copy number loss.
Our data show that PR and ERα are functionally linked in breast cancer cells with a greater complexity than previously recognised. Good prognosis luminal A ERα+ PR+ breast tumours, when exposed to both estrogens and progestogens, have an ERα chromatin binding profile that is dictated by PR binding events. The functional significance of this steroid receptor crosstalk is regulation of a gene expression program associated with low tumourigenicity; hence, better disease outcome. Genomic alterations in the PgR genomic locus appear to be a relatively common mechanism for reduction of PR expression, which may consequently lead to altered ERα chromatin binding and target gene expression patterns that increase breast tumourigenicity and confers a poor clinical outcome. This ERα-PR crosstalk may be directly influenced by many variables, including the relative receptor levels and the hormonal milieu. The presence or absence of estrogen may significantly alter the outcome of PR-ERα interactions, such that the anti-proliferative effects of PR activation may be limited to estrogenic conditions. Our findings show that PR is not simply a marker of a functional ERα complex18. Rather, we propose that PR is a critical determinant of ERα function due to crosstalk between PR and ERα. In this scenario, under estrogenic conditions, an activated PR functions as a proliferative brake in ERα+ breast tumours by re-directing ERα chromatin binding and altering the expression of target genes that induce a switch from a proliferative to a more differentiated state6.
Methods
Cell lines and SILAC labeling of cell lines
MCF-7 and T-47D human cell lines were obtained directly from ATCC and grown in DMEM, supplemented with 10% FBS. All cell lines were regularly genotyped using STR profiling using the Promega GenePrint 10 system. Cell lines were regularly tested for mycoplasma infection.
Rapid IP-Mass Spectrometry of Endogenous Protein (RIME)
Rapid Immuno precipitation-MS experiments were performed as previously described21. MCF-7 and T-47D cells were grown in R/K-deficient SILAC DMEM (PAA; E15-086), 10% dialyzed serum (Sigma-Aldrich; F0392), and supplemented with 800 mM L-Lysine 13C6 15N2Hydrochloride and 482 mM L-Arginine 13C6 15N4 hydrochloride (Sigma- Aldrich) for ‘heavy’-labeled media or 800 mM L-Lysine 12C6 14N2-Hydrochloride and 482 mM L-Arginine 12C6 14N4 hydrochloride for ‘light’-labeled media. Antibodies used were ERα (Santa Cruz - sc-543, lot- A2213) and PR (Santa Cruz- sc-7208, lot H2312). 20 μgs of each antibody was used for each RIME experiment.
Each RIME experiment was performed by mixing 20 million cells from each label after respective drug treatments. Cells were treated with either progesterone (100 nM), R5020 (10 nM) or vehicle (ethanol). Two replicates of each experiment was performed and the results were validated by switching the SILAC labels. The RIME method, Mass spectrometry and data analysis were performed as previously described21.
Western Blot and Co-Immunoprecipitation
Immunoprecipitation experiments for ERα and PR were performed using Santa Cruz antibodies. Antibodies used were ERα (sc-543) and PR (sc-7208). Western blots for ERα and PR were performed using Novocastra antibodies (ERα: NCL-L-ER6F11 and PR: NCL-L-PGR-AB).
ChIP-seq
ChIP-seq experiments were performed as described32. Antibodies used are ERα (Santa Cruz - sc-543, lot- A2213), PR (Santa Cruz- sc-7208, lot H2312) and p300 (Santa Cruz sc-585, lot −E2412). 10 μg of antibody was used for each experiment. Cells were treated with either progesterone (100 nM), R5020 (10 nM) or vehicle (ethanol) and experiment was performed in triplicates.
For xenograft experiments, ERα ChIP-seq experiments were performed from six sets of randomly chosen tumours under estrogen only or progesterone and estrogen treatment condition. Also included were two tumours from vehicle (control) conditions.
ChIP-seq data analysis
Statistical tests and cutoffs were selected based on published recommendations24.
RNA-seq
RNA-Sequencing experiments were performed in MCF-7 and T-47D cells. Cells were treated with progesterone (100 nM) or R5020 (10 nM) for 3 hours and RNA extracted. Experiment was performed in eight replicates for each cell line.
RNA-seq analysis
Single-end 40bp reads generated on the Illumina HiSeq sequencer were aligned to the human genome version GRCh37.64 using TopHat v2.0.433. Read counts were then obtained using HTSeq-count v0.5.3p9 (http://www-huber.embl.de/users/anders/HTSeq/doc/overview.html). Read counts were then normalised and tested for differential gene expression using the DESeq34 workflow. Multiple testing correction was applied using the Benjamini-Hochberg method. Genes were selected as differentially expressed such that FDR <0.01.
GSEA analysis
Integration of the RNA-Seq data and the ChIP-Seq DBA results were carried out using Gene Set Enrichment Analysis (GSEA)35 as follows. All genes assessed by RNA-Seq were ranked and weighted by their mean log2 fold change on progesterone treatments. Lists of genes that overlapped with regions showing significant differential binding on progesterone treatment were derived. These data were then analysed using the GSEA v2.0.13 GSEA Preranked tool.
Gene signature analysis
We derive a prognostic gene signature of consisting of progesterone regulated genes. We included genes that were determined by RNA-seq (see above) as differentially up-regulated in T47-D cells when subjected to progesterone/progestin, as well as having a differentially bound ER binding site with increased binding affinity (determined using DiffBind) within 10kb of the transcription start site. 38 genes met these criteria(see Extended data figure 5). This signature was validated using the METABRIC expression dataset (15), showing that patients in the highest 10% of expression of genes in the signature exhibit significantly better breast cancer specific survival than patients in the lowest 10% of expression (p=7.36e-04); Extended data figure 5).
As it has been shown that many gene signatures have significant power to predict outcome in breast cancer (Venet et al), we subjected the signature to additional statistical tests using the Bioconductor package SigCheck (Stark et al). We used SigCheck to generate a null distribution of 1,000 signatures consisting of 38 genes selected at random, and computed their survival p-values using the survival data for the 392 patients with high or low expression over the progesterone induced genes. The progesterone induced signature performed in the 99th percentile, with 1.2% of random signatures demonstrating an equal or lessor p-value (empirical p-value=0.012; Extended data figure 5). Considering previously identified cancer signatures, of the 189 oncogenic signatures identified in MSigDB (Subramanian et al), 11 had equal or lessor p-values, placing the progesterone regulation signature in the 94th percentile (empirical p-value=0.058). All the code for analysis is available upon request.
Explant tissue experiments
Clinical samples
Breast tumour samples and relevant clinical data were obtained from women undergoing surgery at the Burnside Private Hospital, Adelaide, South Australia, with informed, written consent. This study was approved by the University of Adelaide Human Research Ethics Committee (approval numbers: H-065-2005; H-169-2011). Patients enrolled in the UT Southwestern study provided written consent allowing the use of discarded surgical samples for research purposes according to an Institutional Board-approved protocol. Tumours were obtained from the UT Southwestern Tissue Repository under Institutional Review Board (IRB) (STU 032011-187).
Tissue collection and processing
Excised tissue samples were delivered to the laboratory on ice within one hour following surgery and washed in culture medium comprised of phenol red-free RPMI (SAFC Biosciences, Kansas, USA), 200 mM glutamine (SAFC Biosciences), 1x antibiotic-antimycotic (Sigma-Aldrich, St Louis, MO, USA), 10 μg/ml insulin (Sigma-Aldrich), and 10 μg/ml hydrocortisone (Sigma-Aldrich). Breast tumour tissues were cultured ex vivo as previously described28. In brief, tumour pieces (explants) were pre-incubated on gelatine sponges (3-4 per sponge) for 36 hours in culture media containing 10% FCS, followed by treatment with hormones as indicated in culture media containing 10% steroid depleted FCS. The conditions used were: vehicle, estradiol (10 nM), R5020 (10 nM) and the combination of estradiol and R5020 (both at 10 nM) with hormone treatment conducted for 48 hours. Representative pieces of tissue were fixed in 4% formalin in phosphate-buffered saline (PBS) at 4°C overnight and subsequently processed into paraffin blocks. Sections (2 μm) were stained with hematoxylin and eosin and examined by a pathologist to confirm and quantify the presence/proportion of tumour cells.
Immunohistochemistry
Primary antibodies to detect ERα (ID5 1:300; DAKO #M7047, Glostrup, Denmark), PR (1:1000, Leica #NCL-PgR-AB, Wetzlar, Germany) or Ki67 (MIB1 1:400; DAKO #M7240 Glostrup, Denmark) were used in conjunction with a 1:400 dilution of a biotinylated anti-mouse secondary antibody for 30 min (DAKO #E0433, Glostrup, Denmark) followed by incubation with HRP-conjugated streptavidin (DAKO #P0397, Glostrup, Denmark). Visualization of immunostaining was performed using 3,3-Diaminobenzidine (Sigma #D9015), as previously described36.
Image capture and quantification of Ki67 immunostaining
Slides were scanned at 40X magnification (NanoZoomerTM Microscopy System, Hamamatsu, Japan) and the digitized images edited to exclude non-glandular structures. A minimum of 10 high-resolution images from Nanozoomer files of all segments were recorded. Brown pixels (Ki67) and blue pixels (haematoxylin) were extracted from each image using Adobe Photoshop and the Colour Range tool and a fuzziness factor of 20. Extracted pixels were converted to greyscale format and a consistent threshold applied. Absolute numbers and proportion of Ki67-positive cells were determined using ImageJ software and the Analyse Particles tool with a circularity index of 0.2-1. An average of 14,000 cells were quantified per sample. Accuracy of automatic quantification was determined using an independent set of images that were assessed by an offsite independent observer who manually counted Ki67-positive and Ki67-negative cells in high-resolution images systematically sampled from an individual patient sample (containing >6,500 cells). Identical images were analysed by automatic quantification with consistency between manual and automatic counting of >95%. A linear mixed-effects model of percentage Ki67-positive cells versus type of treatment, adjusting for clustering on patient, was used to assess statistical significance.
Immunofluorescence
5μm sections were cut and adhered to Superfost UltraPlus slides (Menzel-Glasser Braunscweig, Germany) and baked on a warm block at 60°C for 1 hour. Sections were dewaxed in 3 × 5 min immersions of xylene followed by 3 × 5 min immersions in 100% ethanol. Sections were rehydrated in 2 × 5 min immersions in 70% ethanol followed by 2 × 5 min immersions in distilled H2O. Next, antigen retrieval was performed in 600 mL of 1 mM Na-EDTA (pH 8.0) by heating in an 800W microwave until boiling (approximately 5 min), allowing slides to stand for 5 min before microwaving at 50% power for an additional 5 min. Slides were allowed to cool in antigen retrieval buffer for 60 min before transferring to PBS for 5 min. Sections were encircled with a wax pen and primary antibody diluted in PBS with 10% normal goat serum was applied overnight at 4°C (rat anti-ERα – 1:100 (Abcam #ab46186); mouse anti-PR – 1:500 (Dako #NCL-PgR-AB); rabbit anti-Ki67 – 1:100 (Abcam #ab16667). Sections were washed twice for 5 min in PBS, followed by incubation with secondary antibody diluted (all at 1:400) in PBS with 10% normal goat serum for 30 min at room temperature (goat anti-rat Alexa488 (#A11006); goat anti-mouse Alexa569 (#A11031); goat anti-rabbit Alexa647, (#A21246.), Life Technologies). Sections were washed twice for 5 min in PBS, followed by incubation with 1 nM DAPI diluted in PBS for 2 min at room temperature. Sections were mounted under DAKO fluorescent mounting media (#S3023) and each fluorescent channel captured separately using a Zeiss LSM700 confocal microscope.
PgR copy number analysis
Matched DNA and RNA were extracted for 1,980 tumours. The copy number analysis was performed using the Affymetrix SNP 6.0 platform. The arrays were first preprocessed and normalised using CRMAv237 method from the aroma.affymetrix R package. For each array, allelic-crosstalk calibration, probe sequence effects normalisation, probe-level summarisation and PCR fragment length normalisation were performed. Then the intensities were normalised against a pool of 473 normals for those samples that had no matched normal or against their matched normal when available. The log-ratios were segmented using the CBS algorithm38 in the DNAcopy Bioconductor package. Then, callings into five groups (homozygous deletion, heterozygous deletion, neutral copy number, gain and amplification), were made using thresholds based on the variability of each sample and their proportion of normal contamination. Then, samples were classified as PgR loss if they showed any type of loss in any part of the gene.
RNA analysis was performed using Illumina HT-12 v3 platform and analysed using beadarray package39. BASH40 algorithm was employed to correct for spatial artifacts. Bead-level data was summarized and a selection of suitable probes based on their quality was done using the re-annotation of the Illumina HT-12v3 platform41. The samples were classified into the five breast cancer subtypes using PAM5042 and the 10 integrative clusters29. Two-sided t-tests were performed between expression values and loss of PGR to determine significance. Kaplan-Meier estimates and log-rank tests were obtained using the survival R package (http://CRAN.R-project.org/package=survival). Comparison of the expression of the stringent progesterone/R5020 induced or repressed genes in samples with PGR lost and not lost was performed averaging the expression of all the genes and running a two-sided t-test.
Xenograft experiments
Mice were maintained, and regulated procedures performed, according to UK Home Office project license guidelines. Sample size was calculated using a combination of the NC3Rs recommended Resource Equation method, and also prior knowledge of the experimental variability of breast cancer cell line xenografts in NSG animals. All in vivo experiments were performed using age matched female NOD/SCID/IL2Rg−/− (NSG) mice and all experiments were blinded. Animals were selected using the following criteria: sex (female) and age matched (where possible litter mates were used) to reduce variability; only animals in excellent health used (verified pathogen free and in excellent physical health); all animals were certified as NSG strain. Animals were randomly assigned to treatment groups using a random number generator at the beginning of the study. Briefly, mice were injected subcutaneously into the No 4 inguinal mammary fat pad with a suspension of 105 MCF7-Luc2/YFP cells in 50% growth factor reduced MatrigelTM (BD Biosciences). Where appropriate, 90 day slow-releasing 17b-estradiol (0.72 mg/pellet) and/or progesterone (10 mg/pellet) hormone pellets (Innovative Research of America) were implanted subcutaneously in recipient mice. Tumour growth was monitored using regular bioluminescent imaging (IVIS) and caliper measurement. Data were analysed using the GraphPad Prism statistical software package. Standard deviations within groups were similar and substantially less than the variation between the treatment groups. Sample size was determined by a pilot experiment with smaller number of mice. Mice used for all experiments were age and litter matched (3 months) to reduce variability. 15 mice were injected with tumours and then 5 mice were selected at random for each treatment arm. Treatments were blinded using coded cages. Mice were regularly assessed for health and endpoint was determined on regulatory guidelines for tumour size.
For Tamoxifen experiments, age matched female NSG mice were injected as above with either 105 MCF7-Luc2/YFP cells or 107 T-47D-Luc2/mStrawberry cells in 50% growth factor reduced MatrigelTM (BD Biosciences). Concomitantly, a 90 day slow-release 17b-estradiol (0.72 mg/pellet) (Innovative Research of America) was implanted subcutaneously. One week later either 90 day slow-release progesterone (10 mg/pellet) hormone or placebo pellets (Innovative Research of America) were implanted subcutaneously, and Tamoxifen/Vehicle administration was commenced. 100 μL Tamoxifen (5 mg/mL) or vehicle (sterile filtered corn oil) were administered i.p. to a schedule of 3 days dosing/1 day rest for a total duration of 4 weeks (MCF7) or 8 weeks (T-47D). Tumour sizes were monitored as above. Each treatment arm consisted of 10 tumours.
For ovariectomisation experiments, age matched female NSG mice were injected as before with 105 MCF7-Luc2/YFP cells in 50% growth factor reduced MatrigelTM (BD Biosciences), and 90 day slow-release 17b-estradiol (0.72 mg/pellet) and/or progesterone (10 mg/pellet) and/or placebo hormone pellets (Innovative Research of America) were implanted subcutaneously in recipient mice. Concomitantly, ovariectomisation was performed. Tumour sizes were monitored as above for 7 weeks. Each treatment arm consisted of 10 tumours.
Extended Data
Extended data figure 1. Protein purification of ERα and PR interacting proteins, using RIME, following treatment with a synthetic progestin.
T-47D and MCF-7 breast cancer cells were grown in SILAC-isotope containing media and treated with either vehicle control or R5020, a synthetic progestin for 3hr. PR (a) or ERα (b) RIME was conducted and the proteins that were quantitatively enriched in both cell lines are shown. Only proteins that were enriched with a FDR < 1% were included. c. Peptide coverage of the PR protein following ERα RIME in T-47D cells. The identified peptides are highlighted and one of the peptides covers the ‘Bus’ region representing the PR-B isoform. d. Comparison of binding at different time points and treatment of MCF-7 breast cancer cells with progesterone. ERα ChIP-seq at 3hr and 24hrs results in comparable binding. Correlation between Progesterone (PG) and R5020 (RO) at 3 and 24 hrs. e. MCF-7 cells were grown in estrogen rich complete media and treated with progesterone or vehicle control for 3hr. ERα ChIP was conducted and peaks that occurred in at least two of three independent replicates were considered. Venn diagram showing the changes in ERα binding following progesterone treatment of MCF-7 cells. f. Uncropped Western blots from Figure 1c.
Extended data figure 2. Validation of genomic copy number loss in the PgR gene in an independent dataset.
a. TCGA ERα+ breast cancers were assessed for copy number changes in PgR. The number of tumours in each category, based on copy number changes. Only included were ERα+ breast cancers. b. Correlation between PR mRNA levels and copy number status in all luminal breast cancers within the TCGA cohort. The heterozygous and homozygous deletions are combined. c. Frequency of copy number alterations across entire genome in TCGA breast cancer cohort, stratified based on subtype using PAM50 signature. Chromosome 11, which encompasses PgR gene is highlighted and the frequency of copy number loss of the PgR genomic region is provided. d. Copy number changes on chromosome 11 within the METABRIC cohort, based on subtype stratification (PAM50 signature).
Extended data figure 3. ERα binding in single hormone conditions.
a. T47-D or MCF-7 (b) cells were hormone deprived and treated with vehicle control, estrogen alone or progesterone alone. ERα ChIP-seq was conducted and we assessed the binding at the regions previously shown to be reprogrammed by estrogen plus progesterone. The ERα reprogramming data under both estrogen and progesterone conditions in the T-47D cells is from Figure 2b. In the absence of estrogen, progesterone does not induce ERα binding. In the absence of progesterone, estrogen does not induce ERα binding to the locations shown to acquire reprogrammed ER binding events under dual hormone conditions.
Extended data figure 4. Validation of binding and gene expression changes.
a. Validation of dependence on PR for ERα binding and overlap between ERα binding and FoxA1 binding. T-47D cells were grown in full, estrogen-rich media and transfected with siControl or siRNA to PR. ERα ChIP was conducted followed by qPCR of several novel ERα binding events only observed under progesterone treatment conditions. In the absence of PR, ERα is not able to associate with the progesterone-induced binding sites. The figure represents one biological replicate of three competed replicates and the error bars represent standard deviation of the technical ChIP-PCR replicates. b. Venn diagram showing the ERα binding events that were conserved in T-47D cells (i.e. not altered by progesterone when compared to estrogen alone) and the ERα binding events that were reprogrammed by progesterone treatment, when overlapped with FoxA1 ChIP-seq data from T-47D cells. The FoxA1 ChIP-seq data from T-47D cells was from Hurtado, et al, Nature Genetics, 2011, 43:27-33. c. Differential gene changes in MCF-7 and T-47D cells following treatment with progesterone or R5020 for 3hr. Heatmap showing gene changes relative to matched controls. Eight replicates were included. d. Table showing the differentially regulated genes in the two cell lines and in the two treatment conditions. e. Overlap between genes regulated by progesterone (in both cell lines) and gene regulated by the synthetic progestin R5020 (in both cell lines).
Extended data figure 5. Analysis of gene expression changes and generation of gene signature.
a. RNA-seq was conducted after progesterone or R5020 treatment for 3hr. GSEA analysis was conducted on progesterone/R5020 repressed genes with lost ERα binding events observed in T47-D cells. The progesterone-decreased ERα binding regions correlate with progesterone down-regulated genes. b. Kaplan Meier survival curve in 1,959 breast cancer patients based on a gene signature derived from the progesterone regulated genes and progesterone regulated ERα binding events. For a gene to be considered it was differentially regulated by progesterone/progestin (as measured by RNA-seq) and the gene had a differentially regulated ERα binding event within 10kb of the transcription start site. This resulted in 38 genes (c). d. Performance of progesterone induced gene signature at separating based on survival over 392 patients in top or bottom 10% of expression compared to null distribution of p-values computed using 1000 randomly selected 38-gene signatures. e. Copy number alterations on chromosome 11 in T-47D and MCF-7 cells. Green is copy number neutral, blue is copy number loss and red is copy number gain. T-47D cells have an amplification of the chromosome 11 region encompassing the PgR gene and MCF-7 cells have a copy number loss of this genomic region.
Extended data figure 6. PR inhibits cell line growth and progesterone inhibits T-47D xenograft growth.
a. MCF-7 cells were transfected with control vector, PR-A or PR-B expressing vectors. Western blotting confirmed the expression of the appropriate PR isoform. b. Growth was assessed following estrogen plus progesterone treatment. The graph represents the average of three independent biological replicates and the error bars represent standard deviation. c. Assessment of MCF-7 xenograft tumour growth by physical measurement of tumour volume. Ten tumours for each condition (two in each of five mice per condition) were included. The data was analysed using a t-test and the error bars represent +/- SEM. d. T-47D xenografts were established in NSG mice. Ten tumours for each condition (two in each of five mice per condition) were included. All were grown in the presence of estrogen (E2) pellets and subsequently supplemented with vehicle, progesterone, tamoxifen or tamoxifen plus progesterone. Normalised tumour growth is shown. The data was analysed using a t-test and the error bars represent +/- SEM. e. Final T-47D xenograft tumour volumes are shown. f. Final T-47D xenograft tumour volumes plotted graphically.
Extended data figure 7. Histological analysis of xenograft tumours and ChIP-seq from xenograft tumours in ovariectomised mice.
a. Histological analysis of MCF-7 xenograft tumours in untreated, estrogen or estrogen plus progesterone conditions. Tumours were taken from 25 day treated conditions. The human xenograft cells expressed GFP, permitting discrimination between human tumour cells and mouse host cells. MCF-7 xenograft experiment in ovariectomised mice. b. In order to map ERα binding events by ChIP-seq in MCF-7 xenograft tumours, we repeated the experiment in ovariectomised mice to eliminate any issues related to the endogenous mouse progesterone. Ten tumours for each condition (two in each of five mice per condition) were included. Growth of xenograft tumours under different hormonal conditions, Control, estrogen alone (E2) and estrogen plus progesterone (E2 + Prog). The data was analysed using a t-test and the error bars represent +/- SEM. c. ChIP-seq for ERα and PR were conducted in six matched tumours from each hormonal condition. Also included were two tumours from no hormone conditions. Correlation heatmap of all samples.
Extended data figure 8. Primary tumours cultivated as ex vivo explants shown response to progesterone.
Representative images of primary breast cancer explant tissue sections treated with vehicle, estrogen (E2), the progestin R5020 or estrogen plus progestin (E2 + R5020). These sections were probed with anti-Ki67 (brown) to label proliferating cells (a) or Haematoxylin and Eosin (b) . Each image is of a single tissue segment from a selection of 3-4 sections per sample treatment. Scale bar = 100mm. c. Confocal microscopy images (representative fields from each of the triplicate fragments) of a representative primary breast cancer explant tissue treated with vehicle, estrogen (E2), the progestin R5020 (Progestin) or estrogen plus progestin (E2 + R5020) and probed with anti-ERα (green), anti-PR (red) and anti-Ki67 to assess proliferating cells (blue).
Extended data figure 9. Analysis of PgR copy number loss in the METABRIC cohort.
a. Kaplan Meier analysis of breast cancer specific survival within the METABRIC cohort. Only within luminal A tumours (based on PAM50 gene expression signature), tumours were stratified based on copy number loss of PgR or not. In total 19% of luminal A tumours contain a copy number loss of the PgR genomic locus and these patients have a poorer clinical outcome. b. All ERα+ cases were stratified based on PgR copy number status, showing tumours with heterozygous and homozygous deletions separately. c. Chromosome 11 in tumours with neutral or gained PgR versus those with copy number loss of the PgR gene (defined by line). d. Chromosome 11 copy number status between ERα positive and negative tumours. e. Visual representation of all ERα+ tumours with a copy number alteration at the PgR genomic locus, showing the copy number changes relative to the PgR gene (highlighted below) and the surrounding ~2.2 Mb of genomic sequence.
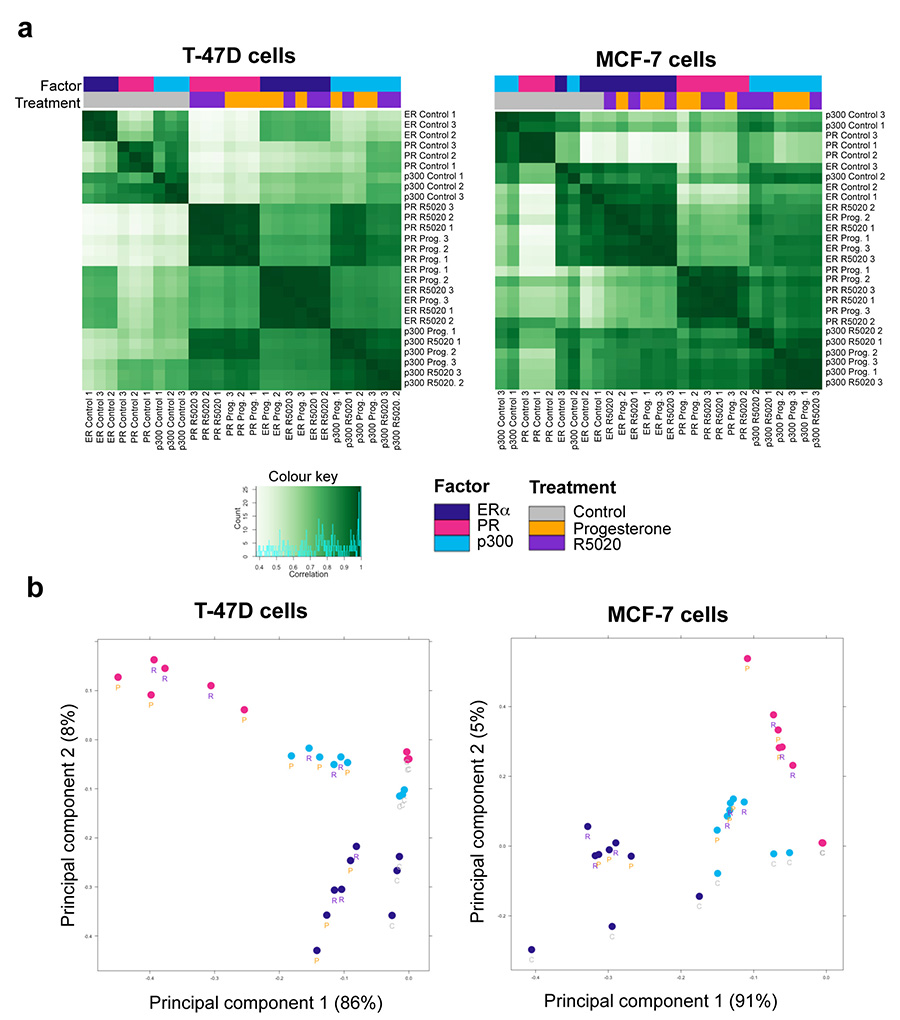
Extended data figure 10. Clustering of ERα, PR, and p300 ChIP-seq experiments in two ERα+ cell lines.
For each experiment, all binding sites identified as overlapping in at least two samples are merged and retained, and normalised read counts computed at each site for each sample. a. Clustering correlation heatmaps, based on Pearson correlations read scores (with replicate numbers in the labels), show good reproducibility between replicates and similarity of natural and synthetic hormone treatments. b. PCA plots showing the two most significant principal components (with samples labeled with treatment type: “C” for full-media control conditions, “P” for progesterone, and “R” for R5020). The data from the two cell lines is shown.
Supplementary Material
Supplementary Table 1 This Supplementary table contains all RIME proteomic SILAC data from Figures 1a, Figure 1b and Extended data figure 1.
Supplementary Table 2 Peak numbers following ERα, PR and p300 ChIP-seq in T-47D and MCF-7 cell lines. The number of peaks for the different conditions are shown and these include estrogen, estrogen plus progesterone and estrogen plus R5020 treatment. Also included are the common peaks observed under both estrogen plus progesterone and estrogen plus R5020 conditions.
Supplementary Table 3 Enriched pathways based on the ERα binding events induced by progesterone and R5020. Shown are the enriched pathways that occur in both T-47D and MCF-7 cells. The values represent the Odds ratio.
Acknowledgements
The authors would like to thank Sarah Leigh-Brown, the staff in the genomic core facility, Silvia Halim, the proteomic core facility and the bioinformatic core facility at Cancer Research UK. We acknowledge Dr Shalini Jindal, Ms Natalie Ryan and Ms Suzanne Edwards from the University of Adelaide for pathology review (S.J), technical assistance (N.R) and statistical analysis (S.E) with ex vivo culture. The MCF7-LucYFP cells were a kind gift from Dr Nathan Benaich (Kings College London). We thank Hinrich Gronemeyer (Strasbourg, France) for the PR-A and PR-B expressing vectors. We would like to acknowledge the support of the University of Cambridge, Cancer Research UK and Hutchison Whampoa Limited. Research reported in this manuscript was supported by the National Cancer Institute of the National Institutes of Health under award number 5P30CA142543 (to UT Southwestern) and Department of Defense grants W81XWH-12-1-0288-03 (GVR). W.D.T. is supported by grants from the National Health and Medical Research Council of Australia (ID 1008349; ID 1084416) and Cancer Australia (ID 627229) T.E.H held a Fellowship Award from the US Department of Defense Breast Cancer Research Program (BCRP; #W81XWH-11-1-0592) and currently is supported by a Florey Fellowship from the Royal Adelaide Hospital Research Foundation. J.S.C is supported by an ERC starting grant and an EMBO Young investigator award.
Footnotes
Data deposition
All microrray data are deposited in GEO accession number GSE68359.
All ChIP-seq data are deposited in GEO accession number GSE68359.
All proteomic data are deposited with the PRIDE database with the accession number PXD002104.
Conflict of interest
None of the authors have any conflicts of interest.
References
- 1.Chlebowski RT, et al. Estrogen plus progestin and breast cancer incidence and mortality in postmenopausal women. JAMA. 2010;304:1684–1692. doi: 10.1001/jama.2010.1500. doi:10.1001/jama.2010.1500 304/15/1684 [pii] [DOI] [PMC free article] [PubMed] [Google Scholar]
- 2.Bentel JM, et al. Androgen receptor agonist activity of the synthetic progestin, medroxyprogesterone acetate, in human breast cancer cells. Mol Cell Endocrinol. 1999;154:11–20. doi: 10.1016/s0303-7207(99)00109-4. doi:S0303-7207(99)00109-4 [pii] [DOI] [PubMed] [Google Scholar]
- 3.Fournier A, Berrino F, Clavel-Chapelon F. Unequal risks for breast cancer associated with different hormone replacement therapies: results from the E3N cohort study. Breast cancer research and treatment. 2008;107:103–111. doi: 10.1007/s10549-007-9523-x. doi:10.1007/s10549-007-9523-x. [DOI] [PMC free article] [PubMed] [Google Scholar]
- 4.Blows FM, et al. Subtyping of breast cancer by immunohistochemistry to investigate a relationship between subtype and short and long term survival: a collaborative analysis of data for 10,159 cases from 12 studies. PLoS Med. 2010;7:e1000279. doi: 10.1371/journal.pmed.1000279. doi:10.1371/journal.pmed.1000279. [DOI] [PMC free article] [PubMed] [Google Scholar]
- 5.Vignon F, Bardon S, Chalbos D, Rochefort H. Antiestrogenic effect of R5020, a synthetic progestin in human breast cancer cells in culture. J Clin Endocrinol Metab. 1983;56:1124–1130. doi: 10.1210/jcem-56-6-1124. [DOI] [PubMed] [Google Scholar]
- 6.Musgrove EA, Swarbrick A, Lee CS, Cornish AL, Sutherland RL. Mechanisms of cyclin-dependent kinase inactivation by progestins. Molecular and cellular biology. 1998;18:1812–1825. doi: 10.1128/mcb.18.4.1812. [DOI] [PMC free article] [PubMed] [Google Scholar]
- 7.Chen CC, Hardy DB, Mendelson CR. Progesterone receptor inhibits proliferation of human breast cancer cells via induction of MAPK phosphatase 1 (MKP-1/DUSP1) The Journal of biological chemistry. 2011;286:43091–43102. doi: 10.1074/jbc.M111.295865. doi:10.1074/jbc.M111.295865 M111.295865 [pii] [DOI] [PMC free article] [PubMed] [Google Scholar]
- 8.Kabos P, et al. Patient-derived luminal breast cancer xenografts retain hormone receptor heterogeneity and help define unique estrogen-dependent gene signatures. Breast cancer research and treatment. 2012;135:415–432. doi: 10.1007/s10549-012-2164-8. doi:10.1007/s10549-012-2164-8. [DOI] [PMC free article] [PubMed] [Google Scholar]
- 9.Zheng ZY, Bay BH, Aw SE, Lin VC. A novel antiestrogenic mechanism in progesterone receptor-transfected breast cancer cells. The Journal of biological chemistry. 2005;280:17480–17487. doi: 10.1074/jbc.M501261200. doi:M501261200 [pii] 10.1074/jbc.M501261200. [DOI] [PubMed] [Google Scholar]
- 10.Bardou VJ, Arpino G, Elledge RM, Osborne CK, Clark GM. Progesterone receptor status significantly improves outcome prediction over estrogen receptor status alone for adjuvant endocrine therapy in two large breast cancer databases. J Clin Oncol. 2003;21:1973–1979. doi: 10.1200/JCO.2003.09.099. doi:10.1200/JCO.2003.09.099 JCO.2003.09.099 [pii] [DOI] [PubMed] [Google Scholar]
- 11.Pichon MF, Pallud C, Brunet M, Milgrom E. Relationship of presence of progesterone receptors to prognosis in early breast cancer. Cancer research. 1980;40:3357–3360. [PubMed] [Google Scholar]
- 12.Badwe R, et al. Single-injection depot progesterone before surgery and survival in women with operable breast cancer: a randomized controlled trial. J Clin Oncol. 2011;29:2845–2851. doi: 10.1200/JCO.2010.33.0738. doi:10.1200/JCO.2010.33.0738 JCO.2010.33.0738 [pii] [DOI] [PubMed] [Google Scholar]
- 13.Bines J, et al. Activity of megestrol acetate in postmenopausal women with advanced breast cancer after nonsteroidal aromatase inhibitor failure: a phase II trial. Ann Oncol. 2014 doi: 10.1093/annonc/mdu015. doi:mdu015 [pii] 10.1093/annonc/mdu015. [DOI] [PubMed] [Google Scholar]
- 14.Lee YJ, Gorski J. Estrogen-induced transcription of the progesterone receptor gene does not parallel estrogen receptor occupancy. Proc Natl Acad Sci U S A. 1996;93:15180–15184. doi: 10.1073/pnas.93.26.15180. [DOI] [PMC free article] [PubMed] [Google Scholar]
- 15.Dowsett M, et al. Retrospective analysis of time to recurrence in the ATAC trial according to hormone receptor status: an hypothesis-generating study. J Clin Oncol. 2005;23:7512–7517. doi: 10.1200/JCO.2005.01.4829. doi:23/30/7512 [pii] 10.1200/JCO.2005.01.4829. [DOI] [PubMed] [Google Scholar]
- 16.Thurlimann B, et al. A comparison of letrozole and tamoxifen in postmenopausal women with early breast cancer. The New England journal of medicine. 2005;353:2747–2757. doi: 10.1056/NEJMoa052258. doi:353/26/2747 [pii] 10.1056/NEJMoa052258. [DOI] [PubMed] [Google Scholar]
- 17.Viale G, et al. Prognostic and predictive value of centrally reviewed expression of estrogen and progesterone receptors in a randomized trial comparing letrozole and tamoxifen adjuvant therapy for postmenopausal early breast cancer: BIG 1-98. J Clin Oncol. 2007;25:3846–3852. doi: 10.1200/JCO.2007.11.9453. doi:JCO.2007.11.9453 [pii] 10.1200/JCO.2007.11.9453. [DOI] [PubMed] [Google Scholar]
- 18.Cui X, Schiff R, Arpino G, Osborne CK, Lee AV. Biology of progesterone receptor loss in breast cancer and its implications for endocrine therapy. J Clin Oncol. 2005;23:7721–7735. doi: 10.1200/JCO.2005.09.004. doi:23/30/7721 [pii] 10.1200/JCO.2005.09.004. [DOI] [PubMed] [Google Scholar]
- 19.Hurtado A, Holmes KA, Ross-Innes CS, Schmidt D, Carroll JS. FOXA1 is a key determinant of estrogen receptor function and endocrine response. Nature genetics. 2011;43:27–33. doi: 10.1038/ng.730. doi:ng.730 [pii] 10.1038/ng.730. [DOI] [PMC free article] [PubMed] [Google Scholar]
- 20.Read LD, Snider CE, Miller JS, Greene GL, Katzenellenbogen BS. Ligand-modulated regulation of progesterone receptor messenger ribonucleic acid and protein in human breast cancer cell lines. Molecular endocrinology . 1988;2:263–271. doi: 10.1210/mend-2-3-263. (Baltimore, Md) [DOI] [PubMed] [Google Scholar]
- 21.Mohammed H, et al. Endogenous purification reveals GREB1 as a key estrogen receptor regulatory factor. Cell Rep. 2013;3:342–349. doi: 10.1016/j.celrep.2013.01.010. doi:10.1016/j.celrep.2013.01.010 S2211-1247(13)00017-X [pii] [DOI] [PMC free article] [PubMed] [Google Scholar]
- 22.Ballare C, et al. Two domains of the progesterone receptor interact with the estrogen receptor and are required for progesterone activation of the c-Src/Erk pathway in mammalian cells. Molecular and cellular biology. 2003;23:1994–2008. doi: 10.1128/MCB.23.6.1994-2008.2003. [DOI] [PMC free article] [PubMed] [Google Scholar]
- 23.Heintzman ND, et al. Histone modifications at human enhancers reflect global cell-type-specific gene expression. Nature. 2009;459:108–112. doi: 10.1038/nature07829. doi:nature07829 [pii] 10.1038/nature07829. [DOI] [PMC free article] [PubMed] [Google Scholar]
- 24.Stark R, Brown GD. DiffBind: differential binding analysis of ChIP-Seq peak data. Bioconductor. http://www.http://http://bioconductor.org/packages/release/bioc/html/DiffBind.html. [Google Scholar]
- 25.Clarke CL, Graham JD. Non-overlapping progesterone receptor cistromes contribute to cell-specific transcriptional outcomes. PLoS ONE. 2012;7:e35859. doi: 10.1371/journal.pone.0035859. doi:10.1371/journal.pone.0035859 PONE-D-12-00543 [pii] [DOI] [PMC free article] [PubMed] [Google Scholar]
- 26.Liang Y, Besch-Williford C, Brekken RA, Hyder SM. Progestin-dependent progression of human breast tumor xenografts: a novel model for evaluating antitumor therapeutics. Cancer research. 2007;67:9929–9936. doi: 10.1158/0008-5472.CAN-07-1103. doi:67/20/9929 [pii] 10.1158/0008-5472.CAN-07-1103. [DOI] [PubMed] [Google Scholar]
- 27.Centenera MM, et al. Evidence for efficacy of new Hsp90 inhibitors revealed by ex vivo culture of human prostate tumors. Clin Cancer Res. 2012;18:3562–3570. doi: 10.1158/1078-0432.CCR-12-0782. doi:10.1158/1078-0432.CCR-12-0782 1078-0432.CCR-12-0782 [pii] [DOI] [PubMed] [Google Scholar]
- 28.Dean JL, et al. Therapeutic response to CDK4/6 inhibition in breast cancer defined by ex vivo analyses of human tumors. Cell Cycle. 2012;11:2756–2761. doi: 10.4161/cc.21195. doi:10.4161/cc.21195 21195 [pii] [DOI] [PMC free article] [PubMed] [Google Scholar]
- 29.Curtis C, et al. The genomic and transcriptomic architecture of 2,000 breast tumours reveals novel subgroups. Nature. 2012;486:346–352. doi: 10.1038/nature10983. doi:10.1038/nature10983 nature10983 [pii] [DOI] [PMC free article] [PubMed] [Google Scholar]
- 30.Tomlinson IP, Nicolai H, Solomon E, Bodmer WF. The frequency and mechanism of loss of heterozygosity on chromosome 11q in breast cancer. J Pathol. 1996;180:38–43. doi: 10.1002/(SICI)1096-9896(199609)180:1<38::AID-PATH638>3.0.CO;2-C. doi:10.1002/(SICI)1096-9896(199609)180:1<38::AID-PATH638>3.0.CO;2-C [pii] 10.1002/(SICI)1096-9896(199609)180:1<38::AID-PATH638>3.0.CO;2-C. [DOI] [PubMed] [Google Scholar]
- 31.Cerami E, et al. The cBio cancer genomics portal: an open platform for exploring multidimensional cancer genomics data. Cancer Discov. 2012;2:401–404. doi: 10.1158/2159-8290.CD-12-0095. doi:10.1158/2159-8290.CD-12-0095 2/5/401 [pii] [DOI] [PMC free article] [PubMed] [Google Scholar]
- 32.Schmidt D, et al. ChIP-seq: Using high-throughput sequencing to discover protein-DNA interactions. Methods. 2009 doi: 10.1016/j.ymeth.2009.03.001. doi:S1046-2023(09)00047-4 [pii] 10.1016/j.ymeth.2009.03.001. [DOI] [PMC free article] [PubMed] [Google Scholar]
- 33.Trapnell C, Pachter L, Salzberg SL. TopHat: discovering splice junctions with RNA-Seq. Bioinformatics. 2009;25:1105–1111. doi: 10.1093/bioinformatics/btp120. doi:10.1093/bioinformatics/btp120 btp120 [pii] (Oxford, England) [DOI] [PMC free article] [PubMed] [Google Scholar]
- 34.Anders S, Huber W. Differential expression analysis for sequence count data. Genome biology. 2010;11:R106. doi: 10.1186/gb-2010-11-10-r106. doi:10.1186/gb-2010-11-10-r106 gb-2010-11-10-r106 [pii] [DOI] [PMC free article] [PubMed] [Google Scholar]
- 35.Subramanian A, et al. Gene set enrichment analysis: a knowledge-based approach for interpreting genome-wide expression profiles. Proc Natl Acad Sci U S A. 2005;102:15545–15550. doi: 10.1073/pnas.0506580102. doi:0506580102 [pii] 10.1073/pnas.0506580102. [DOI] [PMC free article] [PubMed] [Google Scholar]
- 36.Tilley WD, et al. Detection of discrete androgen receptor epitopes in prostate cancer by immunostaining: measurement by color video image analysis. Cancer research. 1994;54:4096–4102. [PubMed] [Google Scholar]
- 37.Bengtsson H, Wirapati P, Speed TP. A single-array preprocessing method for estimating full-resolution raw copy numbers from all Affymetrix genotyping arrays including GenomeWideSNP 5 & 6. Bioinformatics. 2009;25:2149–2156. doi: 10.1093/bioinformatics/btp371. doi:10.1093/bioinformatics/btp371 btp371 [pii] (Oxford, England) [DOI] [PMC free article] [PubMed] [Google Scholar]
- 38.Venkatraman ES, Olshen AB. A faster circular binary segmentation algorithm for the analysis of array CGH data. Bioinformatics. 2007;23:657–663. doi: 10.1093/bioinformatics/btl646. doi:btl646 [pii] 10.1093/bioinformatics/btl646. (Oxford, England) [DOI] [PubMed] [Google Scholar]
- 39.Dunning MJ, Smith ML, Ritchie ME, Tavare S. beadarray: R classes and methods for Illumina bead-based data. Bioinformatics. 2007;23:2183–2184. doi: 10.1093/bioinformatics/btm311. (Oxford, England) [DOI] [PubMed] [Google Scholar]
- 40.Cairns JM, Dunning MJ, Ritchie ME, Russell R, Lynch AG. BASH: a tool for managing BeadArray spatial artefacts. Bioinformatics. 2008;24:2921–2922. doi: 10.1093/bioinformatics/btn557. doi:btn557 [pii] 10.1093/bioinformatics/btn557. (Oxford, England) [DOI] [PMC free article] [PubMed] [Google Scholar]
- 41.Barbosa-Morais NL, et al. A re-annotation pipeline for Illumina BeadArrays: improving the interpretation of gene expression data. Nucleic Acids Res. 2010;38:e17. doi: 10.1093/nar/gkp942. doi:10.1093/nar/gkp942 gkp942 [pii] [DOI] [PMC free article] [PubMed] [Google Scholar]
- 42.Parker JS, et al. Supervised risk predictor of breast cancer based on intrinsic subtypes. J Clin Oncol. 2009;27:1160–1167. doi: 10.1200/JCO.2008.18.1370. doi:10.1200/JCO.2008.18.1370 JCO.2008.18.1370 [pii] [DOI] [PMC free article] [PubMed] [Google Scholar]
Associated Data
This section collects any data citations, data availability statements, or supplementary materials included in this article.
Supplementary Materials
Supplementary Table 1 This Supplementary table contains all RIME proteomic SILAC data from Figures 1a, Figure 1b and Extended data figure 1.
Supplementary Table 2 Peak numbers following ERα, PR and p300 ChIP-seq in T-47D and MCF-7 cell lines. The number of peaks for the different conditions are shown and these include estrogen, estrogen plus progesterone and estrogen plus R5020 treatment. Also included are the common peaks observed under both estrogen plus progesterone and estrogen plus R5020 conditions.
Supplementary Table 3 Enriched pathways based on the ERα binding events induced by progesterone and R5020. Shown are the enriched pathways that occur in both T-47D and MCF-7 cells. The values represent the Odds ratio.


