

Abstract
Key points
Cortico‐hippocampal feed‐forward circuits formed by the temporoammonic (TA) pathway exhibit a marked increase in excitation/inhibition ratio and abnormal spike modulation functions in Fmr1 knock‐out (KO) mice.
Inhibitory, but not excitatory, synapse dysfunction underlies cortico‐hippocampal feed‐forward circuit abnormalities in Fmr1 KO mice.
GABA release is reduced in TA‐associated inhibitory synapses of Fmr1 KO mice in a GABAB receptor‐dependent manner.
Inhibitory synapse and feed‐forward circuit defects are mediated predominately by presynaptic GABAB receptor signalling in the TA pathway of Fmr1 KO mice.
GABAB receptor‐mediated inhibitory synapse defects are circuit‐specific and are not observed in the Schaffer collateral pathway‐associated inhibitory synapses in stratum radiatum.
Abstract
Circuit hyperexcitability has been implicated in neuropathology of fragile X syndrome, the most common inheritable cause of intellectual disability. Yet, how canonical unitary circuits are affected in this disorder remains poorly understood. Here, we examined this question in the context of the canonical feed‐forward inhibitory circuit formed by the temporoammonic (TA) branch of the perforant path, the major cortical input to the hippocampus. TA feed‐forward circuits exhibited a marked increase in excitation/inhibition ratio and major functional defects in spike modulation tasks in Fmr1 knock‐out (KO) mice, a fragile X mouse model. Changes in feed‐forward circuits were caused specifically by inhibitory, but not excitatory, synapse defects. TA‐associated inhibitory synapses exhibited increase in paired‐pulse ratio and in the coefficient of variation of IPSPs, consistent with decreased GABA release probability. TA‐associated inhibitory synaptic transmission in Fmr1 KO mice was also more sensitive to inhibition of GABAB receptors, suggesting an increase in presynaptic GABAB receptor (GABABR) signalling. Indeed, the differences in inhibitory synaptic transmission between Fmr1 KO and wild‐type (WT) mice were eliminated by a GABABR antagonist. Inhibition of GABABRs or selective activation of presynaptic GABABRs also abolished the differences in the TA feed‐forward circuit properties between Fmr1 KO and WT mice. These GABABR‐mediated defects were circuit‐specific and were not observed in the Schaffer collateral pathway‐associated inhibitory synapses. Our results suggest that the inhibitory synapse dysfunction in the cortico‐hippocampal pathway of Fmr1 KO mice causes hyperexcitability and feed‐forward circuit defects, which are mediated in part by a presynaptic GABABR‐dependent reduction in GABA release.
Abbreviations
- AP
action potential
- APV
2‐amino‐5‐phosphonopentanoic acid
- CV
coefficient of variation
- DNQX
6,7‐dinitroquinoxaline‐2,3‐dione
- E/I
excitatory/inhibitory
- EPSP
excitatory postsynaptic potential
- FFI
feed‐forward inhibitory
- FMRP
fragile X mental retardation protein
- Fmr1
fragile X mental retardation 1
- FWHM
full‐width half‐maximum
- FXS
fragile X syndrome
- GABAAR
γ‐aminobutyric acid type A receptor
- GABABR
γ‐aminobutyric acid type B receptor
- IPSP
inhibitory postsynaptic potential
- KO
knock‐out
- PPR
paired‐pulse ratio
- RMS
root mean square
- SC
Schaffer collateral
- SLM
stratum lacunosum moleculare
- SR
stratum radiatum
- TA
temporoammonic
- WT
wild‐type
Introduction
Loss of fragile X mental retardation protein (FMRP) causes fragile X syndrome (FXS), the leading genetic cause of mental disability, often associated with autism and seizures. The common seizure phenotype in FXS patients suggests a dysfunction in circuit excitability (Bassell & Warren, 2008), and many recent studies have implicated excitatory/inhibitory (E/I) imbalance in the pathophysiology of FXS (Paluszkiewicz et al. 2011). Circuit hyperexcitability has been observed in several brain areas of Fmr1 knock‐out (KO) mice, the mouse model of FXS, predominately at a network level (Gibson et al. 2008; Goncalves et al. 2013) and studies over the last decade uncovered a host of synaptic‐level deficits in FXS models (Bassell & Warren, 2008). Yet, a large gap between these two levels of analysis limits further advances towards understanding and treatment of this disorder. Specifically, how fundamental unitary neural circuits are affected in FXS has not been examined.
Recent studies have implicated inhibitory synapse abnormalities as an important contributor to circuit excitability changes in FXS. Decreased excitatory drive onto inhibitory fast‐spiking interneurons was observed in the cortex of Fmr1 KO mice leading to a reduction in GABAergic transmission (Gibson et al. 2008). Consistent with these results, inhibitory synaptic transmission in the amygdala was reduced by FMRP loss (Olmos‐Serrano et al. 2010). In contrast, evoked GABA release was unchanged in the subiculum (Curia et al. 2009), or even increased in the striatum of Fmr1 KO mice (Centonze et al. 2008). The direction and extent of the inhibitory synapse dysfunction caused by loss of FMRP thus remain debatable, and the mechanisms of circuit‐level E/I imbalance in FXS remain incompletely understood.
Canonical feed‐forward inhibitory (FFI) circuits provide a useful model system to study the E/I balance, since activation of these circuits result in excitation rapidly followed by time‐locked inhibition (Pouille & Scanziani, 2001). FFI circuits represent the building blocks of higher‐level circuitry and are essential for many fundamental information‐processing tasks (Pouille & Scanziani, 2001; Remondes & Schuman, 2004; Ang et al. 2005; Gabernet et al. 2005; Klyachko & Stevens, 2006; Dudman et al. 2007; Izumi & Zorumski, 2008; Ferrante et al. 2009; Chittajallu et al. 2013; Han & Heinemann, 2013). Here, we examined the FFI circuit formed by a major cortical input to the hippocampus, the temporoammonic (TA) branch of the perforant path. The CA1 region of the hippocampus integrates sensory inputs from the entorhinal cortex through the trisynaptic pathway and directly from the entorhinal cortex via the TA pathway. These converging inputs to the hippocampus dynamically modulate each other via local inhibitory circuits (Remondes & Schuman, 2002). The FFI circuit of the TA pathway has been shown to be essential in a variety of tasks, including induction and modulation of many forms of synaptic plasticity (Dudman et al. 2007; Izumi & Zorumski, 2008; Han & Heinemann, 2013), maintenance of the hippocampal theta rhythm (Ang et al. 2005), and memory consolidation (Remondes & Schuman, 2004).
Here, we found that feed‐forward inhibition is markedly diminished in the TA pathway of Fmr1 KO mice, leading to an E/I circuit imbalance and abnormal FFI circuit functioning. These defects were associated specifically with the abnormalities in inhibitory, but not excitatory, synapse function. Our analyses are consistent with the predominant role of metabotropic GABAB receptors in these defects, particularly an enhanced presynaptic GABAB receptor signalling in inhibitory synapses that suppresses GABA release in the absence of FMRP. Abnormal GABAB receptor signalling and altered GABA release thus play a major role in FFI circuit dysfunction in FXS.
Methods
Ethical approval
All animal procedures conformed to the National Institutes of Health guidelines and were approved by the Washington University Animal Studies Committee.
Animals and slice preparation
Fmr1 KO and wild‐type (WT) control strain mice on FVB background were obtained from The Jackson Laboratory (Bar Harbor, ME, USA). Both male and female 18‐ to 23‐day‐old mice were used. Mice were fed ad libitum. Genotyping was performed according to The Jackson Laboratory's protocols. Age‐matched controls were used; our previous studies found littermate‐ and age‐match controls to be indistinguishable in all measurements of both excitatory and inhibitory synaptic function (Deng et al. 2011, 2013; Myrick et al. 2015).
Animals were killed with carbon dioxide narcosis followed by decapitation. Carbon dioxide was administered by inhalation and delivered at a flow rate of 20% chamber volume displacement per minute, using a flow meter to control delivery. Transverse hippocampal brain slices (350 μm) were prepared using a microtome (Leica, Germany) in ice‐cold artificial cerebrospinal fluid (ACSF) containing: 125 mm NaCl, 25 mm NaHCO3, 2.5 mm KCl, 1.25 mm NaH2PO4, 10 mm glucose, 0.5 mm CaCl2, 4.0 mm MgCl2. Slices were placed in a recovery chamber heated to 33°C for ∼1 h, and then kept at room temperature (∼23°C) until use.
Electrophysiology
All recordings were performed at 33–34°C in a bath solution containing the following: 125 mm NaCl, 25 mm NaHCO3, 2.50 mm KCl, 1.25 mm NaH2PO4, 10 mm glucose, 2.0 mm CaCl2, 1.0 mm MgCl2, 50 μm AP‐5. Cell‐attached or whole‐cell recordings were made from CA1 pyramidal neurons visually identified with differential interference contrast optics mounted on a Nikon E600N microscope and recorded using an Axopatch 200B amplifier (Molecular Devices, Sunnyvale, CA, USA). Synaptic responses were evoked by an extracellular monopolar electrode positioned on the TA branch of the perforant path in the hippocampal stratum lacunosum moleculare (SLM) layer. Care was taken to ensure that this simulation led to specific activation of the FFI circuits of the TA pathway under our recording conditions: (i) an incision was made between the dentate gyrus and the CA3 areas to prevent activation of the trisynaptic pathway by the TA stimulation; (ii) analyses of the synaptic responses evoked in the same CA1 neuron by activation of the Schaffer collateral (SC) or the TA pathways indicated that FFI response in the SC pathway was over an order of magnitude smaller than the FFI response in the TA pathway under our recording conditions (Fig. 2); (iii) defects in inhibitory synaptic transmission in the hippocampus of Fmr1 KO mice were specific to inhibition evoked by the TA pathway stimulation, while inhibition associated with the SC pathway activation was not significantly different from WT (Fig. 8) as we reported previously (Deng et al. 2011); (iv) the excitatory component of the FFI circuit was normal in the TA pathway of Fmr1 KO mice, while this component exhibited marked defects in the SC pathway (Deng et al. 2011, 2013; Wang et al. 2014b). Our measurements of the FFI circuit of the TA pathway therefore were not contaminated by significant SC activation.
Figure 2. Differences in FFI circuit responses evoked by activation of the SC and TA pathways .
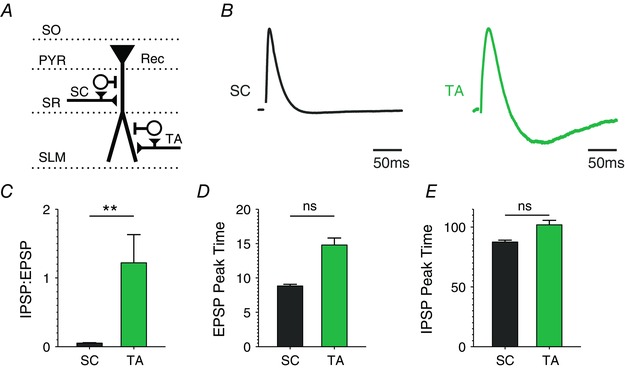
A, schematic diagram of stimulation protocol. Abbreviations denote hippocampal layers. FFI circuit responses to either SC or TA stimulus were recorded in the same CA1 neuron. B, average traces of the FFI circuit response to a single SC or TA stimulus. Traces are normalized to the peak of the excitatory response in each condition. Both responses are recorded in the same set of cells. n = 6. C, differences in pathway responses in I/E ratio measured as a ratio of peak IPSP to peak EPSP in B. D, differences in pathway responses for the timing of peak of the EPSP in B. E, differences in pathway responses for the timing of peak of the IPSP in B.
Figure 8. SC‐associated inhibitory hippocampal synapses in stratum radiatum do not exhibit presynaptic or GABABR‐dependent abnormalities in Fmr1 KO mice .
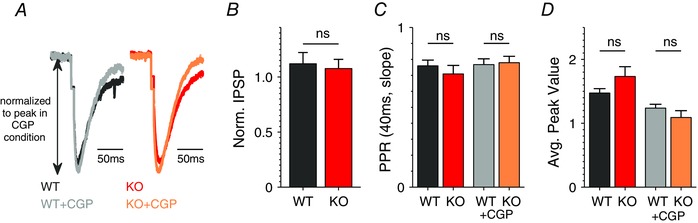
A, average IPSP evoked in CA1 pyramidal neurons by a single stimulation in SR before and after bath application of GABABR antagonist CGP55845 (2 μm). Recordings were performed at −45 mV. Excitation was blocked with DNQX (10 μm) and APV (50 μm) in all experiments shown in A–D. n = 6 (WT), 6 (KO). CGP, CGP55845 (here and below). B, ratio of average IPSP magnitude recorded after/before application of CGP55845. n = 6 (WT), 6 (KO). C, PPR was determined at 40 ms interval based on IPSP slopes in the presence/absence of CGP55845. n = 6 (WT), 6 (KO). D, analysis of short‐term dynamics during 25 Hz, 80 stimuli trains. Peak values during the train were determined as an average of responses 10–15 (around the point where the train responses reach maximum value). n = 6 (WT), 6 (KO). ns, not significant.
The recording electrodes were filled with solution containing (in mm): 130 potassium gluconate, 10 KCl, 0.5 EGTA, 2 MgCl2, 9 NaCl, 3 MgATP, 0.3 LiGTP, and 10 Hepes (pH 7.3). A resting potential of approximately −60 mV was maintained in all cells by current injection and adjustment throughout the experiment. Custom software written in LabView (National Instruments Corp., Austin, TX, USA) in conjunction with a National Instruments A/D board was used to filter (at 2 kHz) and digitize (at 20 kHz) the signal. Because some heterogeneity exists in the CA1 pyramidal cell layer, additional care was taken to ensure that only recordings from pyramidal cells were considered for analysis. Upon establishing whole‐cell recording, a 1 s‐long depolarizing step was applied to evoke spiking. The frequency, height, width, hyperpolarization and adaptation of evoked action potentials (APs) were analysed to determine if the cells qualified as pyramidal cells. In order to be considered a healthy pyramidal neuron, the APs must have satisfied the following criteria: > 80 mV in height, < 2.5 ms in full width at half maximum (FWHM), and have a spike frequency < 50 Hz. This analysis was performed in ∼70% of all recorded cells. Of the 108 cells tested, 15 were rejected from further analysis based on these criteria. Accepted cells had an average AP height of 101.6 ± 10.4 mV, width of 1.12 ± 0.19 ms, and frequency of 20.83 ± 7.85 Hz (means ± SD). All measurements were repeated multiple times in the same neuron with adequate recovery time between the trials. In addition, cells that had an excitatory postsynaptic potential (EPSP) peak less than the root mean square (RMS) of the baseline noise were excluded from I/E ratio analysis only. This was the case for 13 WT and four Fmr1 KO neurons.
For basal FFI circuit measurements, responses were averaged across 10–20 repetitions per cell. The peak and time to peak of EPSP and inhibitory postsynaptic potential (IPSP) components, and the FWHM of the EPSP were determined. In measurements of isolated excitatory responses, a traditional template analysis was used for high‐frequency train measurements as described (Deng et al. 2011). Briefly, the template of baseline current was created by averaging of all baseline responses for a given cell. The template was then scaled to the current peak value following each stimulus and subtracted before the analysis of the sequential stimulus to remove contributions from overlapping responses. In measurements of isolated inhibitory responses during spike trains, a traditional template analysis on a train of stimuli could not be used because two components of response, GABAAR‐ and GABABR‐mediated, were present, each with independent dynamics. Instead, a minimum potential from the baseline following each stimulus was calculated and normalized to the average minimum value of the responses to single stimuli for the same cell. For Yh:Yd measurements, Yh was measured as the amount of decay that occurs from the peak of excitation following a stimulus to the time just before the next stimulus occurs, while Yd was determined as the peak of excitation relative to the resting potential following a stimulus.
To determine an inhibitory paired‐pulse ratio (PPR), we measured the slope of the first response from 20% to 80% of the peak. We then subtracted a scaled template created from the single stimulus responses before examining the slope of the second IPSP. Three Fmr1 KO cells were excluded from this analysis because they did not contain an early IPSP that was detectable above the noise. Slope was chosen for this analysis to minimize the contribution of the late GABABR‐dependent component, which does not reflect presynaptic changes.
Spike modulation experiments
Spike modulation measurements were performed in a cell‐attached configuration. Bath solution was the same as above for whole‐cell measurements, and was also used to fill the recording electrodes. SC stimulation intensity was determined by performing 30–50 single stimuli trials at 0.1 Hz to evoke a spike in 10% of the trials (for spike enhancement experiments) or 90% of the trials (for spike blocking experiments). The TA pathway was stimulated with a train of 10 spikes at 100 Hz; the TA stimulus intensity was set to be below the threshold for evoking a spike in the target CA1 neuron by the TA pathway train alone, but strong enough to alter the SC evoked response when the two pathways were activated simultaneously. This effectively limits the intensity of TA stimulation to a narrow range. We note that these stimulation protocols were designed to minimize slice‐to‐slice variability in setting stimulation intensity of the TA pathway, since no independent normalization factor for TA stimulus intensity could be used in these experiments. Indeed we ensured that no significant bias in setting stimulus intensity was present in our measurements by performing both spike enhancement and blocking experiments in the same slices in the majority of experiments. While SC intensity was adjusted accordingly, the TA stimulation intensity remained unaltered for the spike enhancement and blocking experiments performed in the same cell. The opposite direction of changes in Fmr1 KO mice in spike enhancement and spike blocking measurements (increase in spike enhancement, decrease in spike blocking, Fig. 5) argues against a significant systematic bias in TA stimulus intensity because such bias would be expected to cause changes in the same direction in both measurements. We note that field EPSP (fEPSP) cannot be used in these measurements as a normalization factor because it is intrinsically different in Fmr1 KO and WT mice. The same TA stimulus intensity evokes larger fEPSP in Fmr1 KO than WT animals because of reduced inhibition (Fig. 7). Using the fEPSP as a normalization factor would therefore artificially remove differences between genotypes rather than provide a proper normalization for stimulus intensity. The same argument holds for the SC pathway, except in this case fEPSP is larger in Fmr1 KO mice for the same stimulus intensity because excitatory transmission is abnormally enhanced as we found previously (Deng et al. 2011, 2013).
Figure 5. Abnormal spike modulation by the feed‐forward circuits in Fmr1 KO mice .
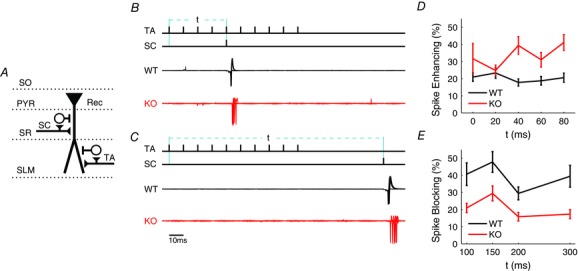
A, schematic diagram of experimental set‐up (SC, Schaffer collateral pathway; TA, temporoammonic pathway). B, top, schematic diagram of a stimulation protocol for heterosynaptic spike enhancement. The value t represents the time between the first TA pathway stimulus and the SC stimulus. Bottom, overlay of 10 trials for a WT (black) and a Fmr1 KO (red) neuron. C, same as B for spike blocking protocol. D, spike enhancement as a function of time between the first stimulus of the TA pathway train (10 stimuli at 100 Hz) and the single stimulus in SC pathway. n = 4–9 independent measurements per time point. E, same as D for spike blocking protocol. t represents the time from the first stimulus of the TA pathway train to the stimulus in the SC pathway. Because the TA stimulus train is 90 ms long, the first time point (t = 100) is at 10 ms after the last TA pathway stimulation. n = 4–9 independent measurements per time point.
Figure 7. Dysfunction of TA‐associated inhibitory synapses in Fmr1 KO mice is GABAB receptor dependent .
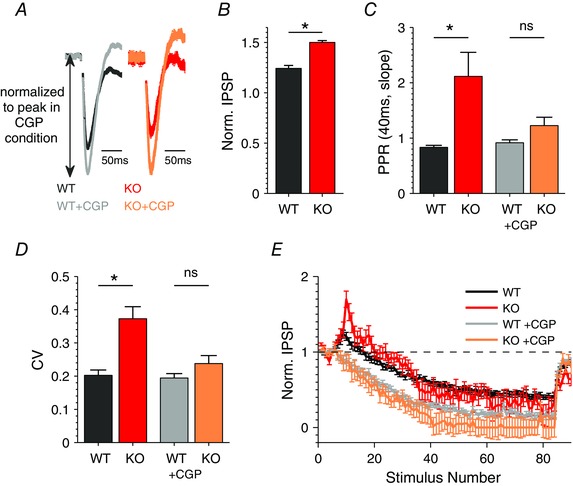
A, average IPSP evoked by a single TA stimulation before and after bath application of GABABR antagonist CGP55845 (2 μm). Excitation was blocked with DNQX (10 μm) and APV (50 μm) in all experiments shown in A–E. n = 9 (WT), 6 (KO). CGP, CGP55845 (here and below). B, ratio of average IPSP magnitude recorded after/before application of CGP55845. n = 9 (WT), 6 (KO). C, PPR determined at 40 ms interval based on IPSP slopes in the presence (n = 9 (WT), 6 (KO)) or absence (n = 17(WT), 13 (KO)) of CGP55845. D, CV determined in the presence or absence of CGP55845. n = 9 (WT), 6 (KO). E, average inhibitory responses during 25 Hz trains, in the absence (n = 17 (WT), 13 (KO)) or presence (n = 9 (WT), 6 (KO)) of CGP55845) normalized to an average baseline response for each condition. *P < 0.05; ns, not significant.
Statistical analysis
All statistical analyses were performed using MatLab (The MathWorks, Inc., Natick, MA, USA). A non‐parametric, two‐sided, Wilcoxon rank sum test (also known as the Mann‐Whitney U test) was employed to compare between groups. Significance was assumed for P < 0.05 (noted by *); values of P < 0.01 and P < 0.001 were noted by ** and *** respectively. The values expressed are means ± SEM.
Results
Baseline feed‐forward inhibition is diminished in Fmr1 KO mice
Abnormal circuit excitability has been described in Fmr1 KO mice, predominately at a network level (Gibson et al. 2008; Goncalves et al. 2013), while the basic FFI circuits have not yet been examined. Therefore, we first examined whether the loss of FMRP affects the E/I balance in the FFI circuit formed by the TA pathway, the major cortical input to the hippocampus. CA1 pyramidal neurons were current‐clamped in whole‐cell configuration and the activity in the FFI circuit was induced by a stimulus electrode placed on the TA pathway in the SLM layer (schematic diagram in Fig. 1 A). We note that this stimulation did not activate a measurable FFI response of the SC pathway under conditions of our recordings (Fig. 2 and see Methods for details) and therefore activated the FFI circuit of the TA pathway in a selective manner. To study the E/I balance we began by examining postsynaptic responses to a single stimulus of the TA pathway (Fig. 1 B), which resulted in a canonical EPSP/IPSP sequence typical of an FFI circuit (Pouille & Scanziani, 2001; Remondes & Schuman, 2002). We found that the ratio of EPSP/IPSP peak values was markedly increased in this FFI circuit in Fmr1 KO relative to WT mice (Fig. 1 C; WT: 0.41 ± 0.61, n = 34; KO: 2.78 ± 0.18, n = 42; P = 0.009, Mann–Whitney U test, here and throughout). To make sure that these changes were not due to small apparent IPSP peak values in Fmr1 KO mice, we also quantified the inverse ratio IPSP/EPSP and found it to be significantly reduced in Fmr1 KO relative to WT mice (Fig. 1 D; WT: 1.49 ± 0.16, n = 34; KO: 0.76 ± 0.07, n = 42; P = 0.03). EPSP duration was also significantly prolonged in the Fmr1 KO neurons (Fig. 1 E; full‐width at half‐maximum (FWHM) in WT: 19.3 ± 0.86 ms, in KO: 24.0 ± 0.65 ms; P = 0.02), consistent with reduced FFI (Pouille & Scanziani, 2001). No significant changes were observed in the time to peak of EPSP (P = 0.24) or IPSP (P = 0.66) (Fig. 1 F and G). These results indicate that the E/I balance in the FFI circuit of the TA pathway is abnormally increased in the Fmr1 KO mice.
Figure 1. Abnormal E/I balance in the cortico‐hippocampal feed‐forward circuit of Fmr1 KO mice .
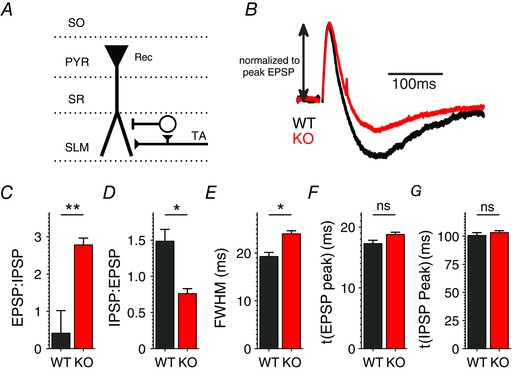
A, schematic diagram of stimulation protocol. Abbreviations denote hippocampal layers. B, average traces of the FFI circuit response to a single TA stimulus in WT (black) or Fmr1 KO (red) mice. Traces are normalized to the peak of the excitatory response in each condition. n = 34 (WT), 42 (KO). Stimulus artifacts have been removed (here and throughout) for clarity. C, effect of FMRP loss on E/I ratio measured as a ratio of peak EPSP to peak IPSP in B. D, effect of FMRP loss on I/E ratio measured as a ratio of peak IPSP to peak EPSP in B. E, effect of FMRP loss on full‐width at half‐maximum (FWHM) of the EPSP in B. F and G, effect of FMRP loss on the time to peak of EPSP (F) and IPSP (G) in B. **P < 0.01, *P < 0.05; ns, not significant.
Feed‐forward inhibitory circuit dynamics is abnormal in Fmr1 KO mice
Next, we examined how the altered E/I balance affects the dynamics of feed‐forward inhibition during high‐frequency stimulus trains. Responses to three different stimulus frequencies – 5 Hz, 25 Hz and 40 Hz – were examined (Fig. 3). Analysis of these data is complicated by the response waveform consisting of both excitatory and inhibitory components, each with independent dynamic changes throughout the train, and by the complex overlap of excitatory and inhibitory responses evoked by subsequent stimuli. Consequently, normalization to averaged baseline responses, which is typically used in such measurements to control for slice‐to‐slice stimulus variability (Klyachko & Stevens, 2006), is not applicable for these FFI measurements. To overcome this obstacle and still account for the stimulus intensity, we devised a different measure represented by the ratio of the hyperpolarizing component (Yh) of the response to the depolarizing component of the response (Yd, relative to resting potential) following each stimulus (Fig. 3 G). Analysis of FFI circuit responses recorded with and without the inhibitory component demonstrates that this measure robustly reflects the contribution of inhibition rather than the decay of EPSP (Fig. 4). This measure can be interpreted to represent a relative contribution of inhibition to the overall level of excitation in the FFI circuit during trains. We found that the Yh:Yd ratio was significantly reduced throughout the train in Fmr1 KO relative to WT mice at two higher train frequencies (Fig. 3 D–F; quantified in Fig. 3 H; 5Hz: n = 7 (WT), 8 (KO), P = 0.95, 25 Hz: n = 20 (WT), 26 (KO), P = 0.02; 40 Hz: n = 16 (WT), 19 (KO), P = 0.03). These results indicate that the E/I balance and FFI circuit dynamics are abnormal during high‐frequency trains in the TA pathway of Fmr1 KO mice.
Figure 3. Abnormal E/I balance in the cortico‐hippocampal feed‐forward circuit of Fmr1 KO mice during stimulus trains .
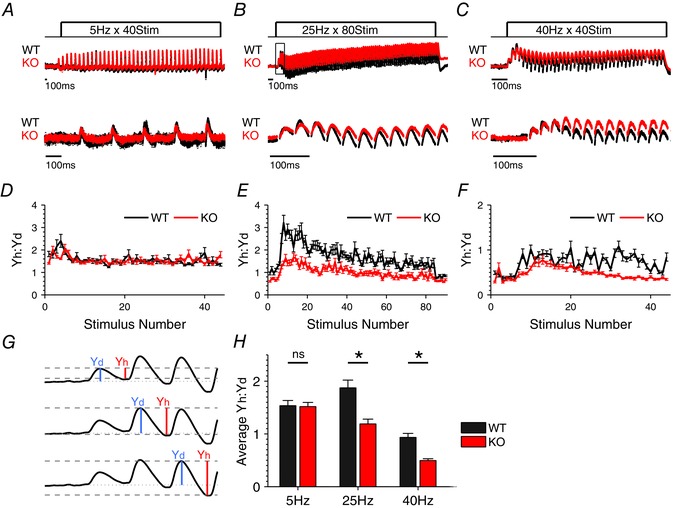
A–C, sample traces of FFI responses to 5 Hz, 25 Hz and 40 Hz, respectively. For visual comparison of dynamic changes during the trains, traces were normalized to the peak of the first response in the train, averaged across cells and then scaled to match the peak of the first response between WT and Fmr1 KO. Boxed portion of 25 Hz traces denotes areas enlarged in G. Traces below show the representative examples of first several responses during trains in each condition. D–F, Yh:Yd ratio was calculated for each stimulus in the 5 Hz, 25 Hz and 40 Hz trains, respectively. n = 7 (WT 5 Hz), 8 (KO 5 Hz), 20 (WT 25 Hz), 26 (KO 25 Hz), 24 (WT 40 Hz), 22 (KO 40 Hz). G, schematic diagram of the Yh:Yd ratio analysis. H, summary of average Yh:Yd ratios during 5 Hz, 25 Hz and 40 Hz trains. **P < 0.01, *P < 0.05; ns, not significant.
Figure 4. Yh:Yd ratio is a robust measure for the contribution of inhibition .
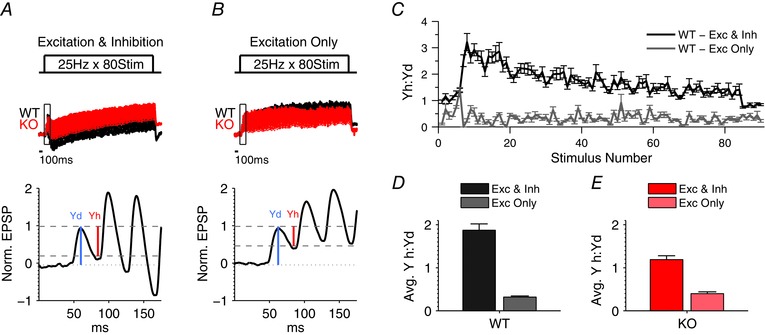
A and B, average traces of FFI responses to 25 Hz stimulus, in WT and Fmr1 KO mice, recorded with and without inhibition (+ gabazine (5 μm) and CGP55845 (2 μm)). For visual comparison of dynamic changes during the trains, traces were normalized to the peak of the first response in the train, averaged across cells and then scaled to match the peak of the first response between WT and Fmr1 KO. Boxed portion of 25 Hz traces denotes areas enlarged in bottom traces for the KO trace. Schematic diagram of the Yh:Yd ratios during 25 Hz train for excitation and inhibition or excitation only, respectively, are shown on the bottom panels. A represents the same data as in Fig 3 B. n = 20 (WT excitation and inhibition), 26 (KO excitation and inhibition), 7 (WT excitation only), 8 (KO excitation only). C, average Yh:Yd ratio for each stimulus in the 25 Hz stimulus train with and without inhibition in WT. D and E, summary of average Yh:Yd ratios during 25 Hz trains across all stimuli for WT and Fmr1 KO mice. We note that Yh:Yd ratios represent predominately contribution of inhibition (excitation and inhibition) rather than the decay of EPSP (excitation only).
Defective spike modulation by the feed‐forward circuits of Fmr1 KO mice
What are the functional consequences of these abnormalities for the operations performed by FFI circuits? To approach this question, we used the spike modulation protocol similar to that previously described by Remondes & Shuman (2002), as it is known to be dependent on the FFI circuits. These studies have demonstrated that the converging inputs to the CA1 area of the hippocampus – the trisynaptic pathway via SC pathway and the direct cortical input via the TA pathway – dynamically modulate each other via local FFI circuits. Single activation of the SC pathway, which alone is not capable of producing a spike in a postsynaptic neuron, has an enhanced ability to evoke a spike if it occurs coincidently with a train of stimuli in the TA pathway. Conversely, the ability of the SC pathway to evoke a spike is inhibited when SC activation follows the train of stimuli in the TA pathway within ∼300 ms. Both of these spike modulation functions depend on FFI circuits (Remondes & Schuman, 2002). Therefore, we tested whether these spike enhancing/blocking functions are affected in Fmr1 KO mice. Spiking in the target CA1 neurons was recorded in a cell‐attached mode while stimulating the SC pathway and the TA pathway with corresponding activity patterns (schematic diagram in Fig. 5 A). For the spike enhancement experiment, the SC pathway was stimulated with a single stimulus that alone was capable of producing a spike in the postsynaptic cell only 10% of the time, while the TA pathway was stimulated coincidently by a train of 10 stimuli at 100 Hz (Fig. 5 B). The probability of spike occurring was then measured at various time intervals (0 to 80 ms) between the beginning of the stimulus train at the TA pathway and the single stimulus at the SC pathway (Fig. 5 D). For the spike‐blocking experiment, the SC pathway was stimulated at an intensity that evoked a postsynaptic spike 90% of the time (Fig. 5 C). The probability that activation of the TA pathway would block the occurrence of that spike was then measured at various time intervals following the TA pathway stimulus train (Fig. 5 E). The Fmr1 KO mice exhibited an increase in spike enhancement (Fig. 5 D) and decease in spike blocking (Fig. 5 E), consistent with the reduced FFI inhibition. The E/I imbalance thus has major implications for the spike modulation operations performed by the FFI circuits in Fmr1 KO mice.
Excitatory synapse function is maintained in the TA pathway of Fmr1 KO Mice
The observed abnormalities in E/I balance and FFI circuit properties could arise from changes in excitatory synapse function, inhibitory synapse function or both. To determine whether changes at the excitatory cortico‐hippocampal TA pathway synapses were contributing to the FFI circuit defects, we pharmacologically isolated the excitatory component of the TA pathway input using gabazine (5 μm) and CGP55845 (2 μm) to block GABAA and GABAB receptors, respectively. In the absence of inhibition, the EPSPs evoked in CA1 neurons by single TA pathway stimulation were indistinguishable in Fmr1 KO and WT controls, both in terms of their width (Fig. 6 A and B; WT: 24.0 ± 0.9 ms, n = 7; KO: 21.2 ± 1.6 ms, n = 6; P = 0.44) and timing of the peak (Fig. 6 C; WT: 17.1 ± 0.8 ms, KO: 18.6 ± 0.5 ms, P = 0.44).
Figure 6. Excitatory synaptic transmission is normal in the TA pathway of Fmr1 KO mice .
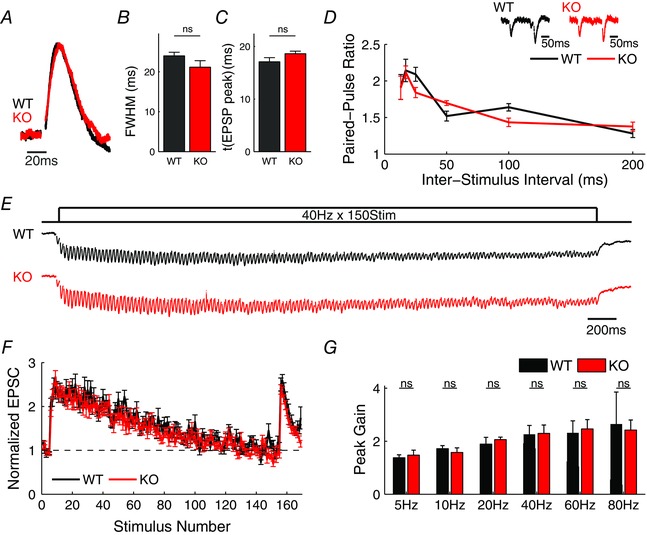
A, average trace of whole‐cell EPSP evoked by a single stimulus in WT and Fmr1 KO mice in the presence of Gabazine (5 μM) and CGP55845 (2 μM), normalized to their peak values. n = 7 (WT), 6 (KO). B, FWHM of average EPSP in A. C, time to peak of EPSP in A. D, PPR measured at different time intervals. Sample traces shown on top. n = 8–11 independent measurements per time point for each WT and Fmr1 KO. E, traces of responses to 150 stimuli train at 40 Hz recorded in voltage‐clamp (V hold = −60 mV). Traces represent an average across cells and are low‐pass median filtered for presentation only. n = 9 (WT), 10 (KO). We note that one WT cell was excluded from the average trace shown (for presentation only), because of a large recording artifact in the middle of the train. F, excitatory synaptic dynamics during 150 stimuli 40 Hz trains recorded in voltage‐clamp (shown in E). Peak EPSC values during the train were normalized to the averaged baseline EPSC preceding each train. n = 10 (WT), 10 (KO). G, maximal EPSC gain during the trains for various stimulus frequencies. n = 8–11 independent measurements per frequency for each WT and Fmr1 KO. ns, not significant.
To further assess changes in excitatory synaptic transmission of the TA pathway input, we examined the short‐term dynamics of the excitatory responses during high‐frequency trains of 5–80 Hz in voltage‐clamped CA1 neurons of Fmr1 KO and WT mice. For each stimulus frequency, we also calculated the paired‐pulse ratio (PPR) by dividing the magnitude of the second EPSC of the train by the magnitude of the first EPSC of the train. We found no significant differences in the short‐term dynamics of excitatory responses (Fig. 6 E–G) or the PPR (Fig. 6 D) between Fmr1 KO and WT mice for any of the tested frequencies. Together these results indicate that the excitatory synaptic transmission at the TA pathway synapses is maintained in Fmr1 KO mice. We note that this is in contrast to hippocampal CA3 and Layer 5 cortical excitatory neurons in which we previously found major presynaptic defects leading to abnormally elevated glutamate release during high‐frequency trains (Deng et al. 2011, 2013; Myrick et al. 2015). This heterogeneity in synaptic defects caused by FMRP loss in different or even the same brain areas is not surprising and has been documented in numerous previous studies of both excitatory and inhibitory synapses (Centonze et al. 2008; Curia et al. 2009; Olmos‐Serrano et al. 2010; Patel et al. 2013, 2014; Wang et al. 2014 a).
Altered GABA release in TA‐associated inhibitory hippocampal synapses is mediated by GABAB receptor dysfunction in Fmr1 KO mice
The TA pathway fibres form excitatory synapses on CA1 pyramidal cells and also directly activate interneurons with the soma in the stratum lacunosum moleculare (SLM), which in turn project to CA1 pyramidal cells to form unitary FFI circuits (Empson & Heinemann, 1995 b; Remondes & Schuman, 2002). The SLM layer of the hippocampus in the vicinity of the TA pathway contains the axons of many interneurons that participate in the TA feed‐forward inhibition (Price et al. 2008). Therefore, we next examined properties of inhibitory synaptic inputs to the CA1 pyramidal neurons in the SLM layer. Excitation was blocked using 2‐amino‐5‐phosphonopentanoic acid (APV, 50 μm) and 6,7‐dinitroquinoxaline‐2,3‐dione (DNQX, 10 μm) in the bath solution; the resulting IPSP evoked by a single TA pathway stimulus had a complex waveform that consisted of an early, predominately GABAA receptor (GABAAR)‐mediated potential followed by a late GABAB receptor (GABABR)‐mediated potential (Empson & Heinemann, 1995). To examine these components separately, we recorded IPSPs evoked by a single TA stimulus before and after adding a selective GABABR antagonist CGP55845 (2 μm) in the same cell. The data were then normalized to the peak of the early IPSP to account for variations in stimulus intensity between slices (for analysis of the late IPSP component see Fig. 9 C and D and text below). Blocking GABABRs caused an increase in the early IPSP (Fig. 7 A), likely because this treatment alleviated the inhibitory influence of presynaptic GABABRs on GABA release probability, in agreement with previous studies (Chalifoux & Carter, 2011). Most importantly, we observed that the IPSP increase in the presence of GABABR antagonist was significantly larger in Fmr1 KO than in the WT mice (Fig. 7 B; WT: 1.24 ± 0.03, n = 9; KO: 1.50 ± 0.02 n = 6; P = 0.04) suggesting an excessive GABABR signalling in these inhibitory synapses of Fmr1 KO mice. We note that although GABABR antagonist inhibits both pre‐ and postsynaptic GABABRs, blocking postsynaptic GABABRs cannot increase an early IPSP in these recordings. These results suggest that GABABR‐mediated inhibition of GABA release is abnormally elevated in Fmr1 KO mice.
Figure 9. E/I imbalance in the FFI circuit of Fmr1 KO mice is GABAB receptor dependent .
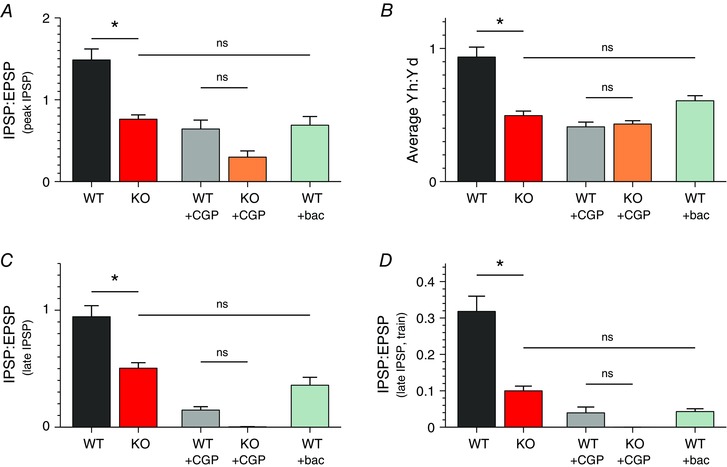
A, ratio of IPSP to EPSP (inhibition measured at peak) for a baseline response evoked by a single stimulus in the intact FFI circuit of the TA pathway under specified conditions (CGP, CGP55845; bac, baclofen). n = 34 (WT), 42 (KO), 7 (WT+CGP), 5 (KO+CGP), 9 (WT+bac). B, average Yh:Yd ratio measured in the intact FFI circuit during a 40 stimuli, 40 Hz train under specified conditions. n = 24 (WT), 22 (KO), 9 (WT+CGP), 6 (KO+CGP), 12 (WT+bac). C, ratio of IPSP to EPSP for the late component of inhibition (measured 150 ms after the stimulus) for a baseline response evoked by a single stimulus in the intact FFI circuit of the TA pathway under specified conditions. n = 34 (WT), 42 (KO), 7 (WT+CGP), 5 (KO+CGP), 9 (WT+bac). D, ratio of IPSP to EPSP for the late component of inhibition (measured 150 ms after the stimulus) determined in the intact FFI circuit following the last stimulus in the 40 stimuli, 40 Hz train under specified conditions. n = 24 (WT), 22 (KO), 9 (WT+CGP), 6 (KO+CGP), 12 (WT+bac). *P < 0.05; ns, not significant.
To further examine changes in GABA release probability, we used PPR measurements. We found a shift from paired‐pulse depression to facilitation in Fmr1 KO compared to WT mice (Fig. 7 C; WT: 0.83 ± 0.05, n = 17; KO: 2.11 ± 0.43, n = 13; P = 0.04), consistent with reduced GABA release probability (Deng & Klyachko, 2011). This difference in the PPR between Fmr1 KO and WT mice was eliminated by the GABABR antagonist CGP55845 (Fig. 7 C, WT: 0.91 ± 0.05, n = 9; KO: 1.22 ± 0.15, n = 6; P = 0.45), further supporting the role of presynaptic GABABRs in this defect.
To further examine the origins of the above GABAergic transmission defects, we measured the coefficient of variation (CV) of IPSPs, which has been previously shown to represent a measure specifically of presynaptic function (Kullmann, 1994; Fitzjohn et al. 2001; Wang et al. 2014 b). The CV of the early IPSP component was significantly increased in Fmr1 KO relative to WT mice (Fig. 7 D; WT: 0.20 ± 0.02, n = 9; KO: 0.37 ± 0.04, n = 6; P = 0.03), consistent with the presynaptic origin of the IPSP changes. These differences in CV were eliminated by the application of the GABABR antagonist in the same cells (Fig. 7 D; WT: 0.19 ± 0.01, n = 9; KO: 0.23 ± 0.02, n = 6; P = 0.68), supporting the role of presynaptic GABABRs in these changes.
We sought to corroborate these findings by examining the short‐term dynamics of the inhibitory synapses during trains of stimuli (80 stimuli at 25 Hz) without and with the GABABR antagonist. As expected from the above results, the short‐term dynamics in the Fmr1 KO mice deviated qualitatively from that in WT mice with a strongly increased facilitation at the beginning of the train (Fig. 7 E). As in the above experiments, these differences were also eliminated by the GABABR antagonist (Fig. 7 E).
We further examined whether these GABABR‐mediated abnormalities are specific to the inhibitory synapses in the SLM layer, or if similar abnormalities are also present in inhibitory synapses in the stratum radiatum (SR) that contains the axons of many interneurons that participate in feed‐forward inhibition of the SC pathway. Inhibitory synaptic transmission was evoked in the CA1 neurons by SR stimulation in the presence of APV (50 μm) and DNQX (10 μm) in the bath solution. In contrast with the SLM stimulation described above, we observed no significant differences between Fmr1 KO and WT animals in any of the measurements of presynaptic function (Fig 8 B–D), in agreement with our earlier studies (Deng et al. 2011). Moreover, we did not observe measurable effects of GABABR antagonist in either WT or Fmr1 KO animals in any of presynaptic measurements performed (Fig. 8 B–D), indicating that the inhibitory synapses in the SR do not contain significant presynaptic GABABR‐mediated activity.
Taken together these results suggest that GABA release at inhibitory SLM synapses on CA1 neurons is reduced in Fmr1 KO mice in a selective manner. Our results are consistent with the major role of presynaptic GABABRs in this defect, which we investigate further below.
Presynaptic GABAB‐receptor dysfunction plays a major role in abnormal feed‐forward inhibition in the TA pathway of Fmr1 KO mice
The above results point to GABABR signalling defects as a major cause of abnormal inhibitory synapse function in the TA pathway of Fmr1 KO mice. SLM inhibitory fibres activated by TA pathway stimulation in the above experiments may not, however, fully represent the population of interneurons involved in FFI. Therefore, we examined the role of GABABR signalling in the abnormalities of the intact FFI circuit of the TA pathway. The FFI circuit activity was evoked and recorded as described above (Fig. 1) using both single stimuli and high‐frequency trains. We found that differences between Fmr1 KO and WT mice were no longer significant in the presence of GABABR antagonist for both the I/E ratio measured for a single stimulus (Fig. 9 A; n = 7 (WT), 5 (KO), P = 0.26) and for the average Yh:Yd ratio during the trains (Fig. 9 B; n = 9 (WT), 6 (KO), P = 0.61).
Additionally, we examined the changes in the late component of inhibition by quantifying the inhibition levels at the peak of the late component (150 ms after the stimulus), both with and without the GABABR antagonist. Similarly to the early component of inhibition examined above, we found significant differences in the E/I ratio for the late component of inhibition between Fmr1 KO and WT mice evoked by a single TA stimulation (Fig. 9 C; P = 0.01). As in the above experiments, these differences were minimized by the addition of the GABABR antagonist (Fig. 9 C; P = 0.053). In this case, there were no Fmr1 KO neurons that had measurable amounts of the late component of inhibition remaining after the addition of the GABABR antagonist. Similar results were obtained for the late component of inhibition following the last stimulus of the train, which was significantly different between Fmr1 KO and WT mice (Fig. 9 D; P = 0.04), and these differences were also eliminated by the GABABR antagonist (Fig. 9 D; P = 0.69).
Together, these results indicate that GABABR signalling defects are a major cause of abnormal E/I balance in the intact FFI circuit of Fmr1 KO mice.
Because the early component of inhibition is mediated predominately by GABAARs, the GABABR‐dependent changes in this early component of inhibition in Fmr1 KO mice reflect the role of presynaptic GABABRs in controlling GABA release, but not the changes in postsynaptic GABABR properties. Changes in the late component of inhibition, on the other hand, could arise either from altered GABA release onto normal postsynaptic GABABRs, or from altered postsynaptic GABABR properties, or from both. GABABR subunits are differentially expressed at pre‐ and postsynaptic compartments (Perez‐Garci et al. 2006; Guetg et al. 2009). Although no antagonists specifically targeting pre‐ or postsynaptic GABABRs have been described thus far, earlier studies have shown that low concentrations (<1 μm) of baclofen preferentially activate the prestsynaptic GABABRs (Cruz et al. 2004; Guetg et al. 2009). Therefore, to determine if the E/I imbalance phenotype observed in Fmr1 KO mice could be reproduced in the WT FFI circuit by selective activation of the presynaptic GABABRs, we used low concentrations of baclofen (0.5 μm) applied to the bath. I/E circuit measurements were performed as described above. We found that application of low concentrations of baclofen in WT mice fully mimicked the abnormalities in I/E ratio evoked by a single stimulus in Fmr1 KO mice for both early and late components of inhibition (Fig. 9 A and C; I/E ratio measured at peak; WT+baclofen: 0.68 ± 0.11, n = 9; KO: 0.76 ± 0.05, n = 42; P = 0.99; I/E ratio for the late component of inhibition measured 150 ms after the stimulus: WT+baclofen: 0.35 ± 0.07, n = 9; KO: 0.50 ± 0.05, n = 42; P = 0.45). Additionally, application of low concentrations of baclofen in WT mice eliminated differences with Fmr1 KO mice in average Yh:Yd ratio during the trains (Fig. 9 B; WT+baclofen: 0.61 ± 0.04, n = 12; KO: 0.50 ± 0.03 n = 22; P = 0.15), and in the late component of inhibition measured 150 ms after the end of the train (Fig. 9 D; WT+baclofen: 0.04 ± 0.01, n = 12; KO: 0.09 ± 0.01 n = 22; P = 0.37). Therefore, our results show that either blocking all GABABRs or preferentially activating presynaptic GABABRs in WT neurons largely eliminates differences in E/I circuit imbalance in the intact FFI circuit between Fmr1 KO and WT mice. Taken together, these results indicate that GABABR abnormalities play a critical role in FFI circuit dysfunction in the TA pathway of Fmr1 KO mice, with a major contribution from presynaptic GABABR defects.
Discussion
While the dysfunction of the GABAergic system is well documented in FXS models, the underlying mechanisms and implications for circuit operations remain to be elucidated (Braat & Kooy, 2014). In the present study, we identified a major defect in the properties and function of a canonical FFI circuit formed by the cortico‐hippocampal TA pathway in Fmr1 KO mice. The observed marked E/I imbalance in the FFI circuit resulted specifically from reduced TA inhibition in the Fmr1 KO mice, while the excitatory component of this circuit remained unaffected by FMRP loss. GABAARs and GABABRs mediate two main components of the GABAergic synaptic transmission, the early and late, respectively. Several studies have implicated inhibitory synapse defects in the circuit hyperexcitability in FXS, but thus far, inhibitory synapse dysfunction has been largely attributed to the GABAAR‐mediated abnormalities (D'Hulst et al. 2006; Gantois et al. 2006; Centonze et al. 2008; Curia et al. 2009; Olmos‐Serrano et al. 2010; Paluszkiewicz et al. 2011; Martin et al. 2014). While GABAARs support rapid GABAergic synaptic transmission, GABABRs are metabotropic G protein‐coupled receptors that are found both pre‐ and postsynaptically throughout the brain, where they provide powerful modulatory control of many aspects of synaptic function (Chalifoux & Carter, 2011). Whether GABABR signalling is also affected by FMRP loss and whether it contributes to circuit deficits in FXS remain largely unexplored.
Our results suggest that the E/I imbalance and abnormal FFI circuit properties in the TA pathway of Fmr1 KO mice are mediated by a GABABR dysfunction, with a major contribution from presynaptic GABABR‐dependent reduction in GABA release. This model is supported by four lines of evidence. First, in inhibitory TA‐associated synapses, the early, GABAAR‐mediated component of IPSP is more sensitive to inhibition of GABABRs in Fmr1 KO mice, suggesting excessive GABABR activation or downstream signalling. While GABABR antagonist inhibits both pre‐ and postsynaptic receptors, the increase in early IPSP produced by the antagonist cannot be caused by inhibition of postsynaptic GABABRs, which can only have an opposite effect on IPSP amplitude. Second, TA‐associated inhibitory synapses in Fmr1 KO mice have altered PPR, CV and short‐term dynamics, which are all widely believed to reflect changes in presynaptic release probability (Kullmann, 1994; Fitzjohn et al. 2001; Rotman et al. 2011; Wang et al. 2014 b), and these defects are also corrected by inhibition of GABABRs. Third, differences between Fmr1 KO and WT mice in the E/I balance measured in the intact FFI circuit were eliminated by GABABR inhibition or by preferential activation of presynaptic GABABRs with low concentrations of baclofen in WT mice. The mimicking effect of low baclofen concentrations in WT mice suggests that when the postsynaptic components are largely unaltered, a selective change in GABA release probability could account for the major defects in the E/I circuit balance in the TA pathway of Fmr1 KO mice. Finally, the observation that preferential activation of presynaptic GABABRs eliminated differences between Fmr1 KO and WT mice in the late component of inhibition suggests that the postsynaptic GABABRs are not strongly affected in this circuit in Fmr1 KO mice. The similar and seemingly contradictory effects of GABABR agonist and antagonist may be understood by considering that GABABR antagonist has a dual effect, acting on both pre‐ and postsynaptic receptors. Consequently, it relieves presynaptic GABABR‐dependent inhibition of GABA release thereby eliminating the differences between Fmr1 KO and WT mice, but also acting postsynaptically to reduce GABA‐evoked inhibition in postsynaptic neurons. Hence, the overall effect of the GABABR antagonist is reduction in FFI inhibition in WT and Fmr1 KOs to the same levels. Preferential activation of presynaptic GABABRs with low concentrations of baclofen also reduces FFI levels, but does so by preferentially inhibiting presynaptic GABA release without strongly affecting the postsynaptic receptors. Altogether, these results support the major role of abnormal presynaptic GABABR signalling in reduced GABA release and E/I imbalance in the TA pathway of Fmr1 KO mice.
Our results do not exclude other mechanisms besides altered presynaptic GABABR properties that may contribute to the inhibitory synapse defects in Fmr1 KO mice. GABABRs act via G‐protein activation on a large number of different downstream targets including voltage‐dependent K+ and Ca2+ channels, adenylate cyclase as well as components of the exocytotic release machinery (Chalifoux & Carter, 2011). GABABRs are also modulated by the auxiliary binding proteins, such as GISP, mupp1 and KCTD, which regulate GABABR surface expression and function (Chalifoux & Carter, 2011). Elucidating whether abnormalities in the GABABR protein levels, surface expression, auxiliary binding proteins or downstream signalling pathways mediate the inhibitory synapse defects and E/I circuit imbalance in Fmr1 KO mice will require a separate investigation. Additionally, over 20 different types of inhibitory interneurons have been identified (Lovett‐Barron & Losonczy, 2014), and it remains unknown which subsets of interneuron types are involved in FFI circuits. A recent study has identified neurogliaform cells as a major contributor to the FFI circuit in the TA pathway, and revealed that GABA release in these cells is strongly modulated by presynaptic GABABRs (Price et al. 2008). While our observations are consistent with the role of neurogliaform cells in the FFI defects in Fmr1 KO mice, elucidating whether this and/or other interneuron types mediate the FFI defects in FXS circuits will require extensive additional knowledge about interneuron functional specificity, which is not currently available.
GABABRs have attracted extensive recent attention as a potential target to correct hyperactivation of glutamatergic pathways and normalize behavioural phenotypes in Fmr1 KO mice and FXS patients. A GABABR agonist, arbaclofen, has been shown to correct multiple phenotypes in glutamatergic neurons of Fmr1 KO mice (Pacey et al. 2011; Berry‐Kravis et al. 2012; Henderson et al. 2012). However, arbaclofen treatment did not result in significant improvements in patients and its clinical trials have been discontinued. This treatment approach is based on the assumption that GABABR agonists act predominately at excitatory nerve terminals to reduce glutamate release and dampen circuit excitability. Our results, however, suggest that GABABRs play a much more complex role in FXS, in which excessive presynaptic GABABR signalling occurs in the inhibitory synapses where these receptors act to suppress GABA release and consequently promote circuit hyperexcitability in Fmr1 KO mice. Application of GABABR agonists will further reduce GABA release and promote circuit hyperexcitability, consequently opposing the effect of the same compound at excitatory synapses. Indeed, GABABRs are located presynaptically on both excitatory and inhibitory synaptic terminals, as well as postsynaptically in the dendrites of both excitatory and inhibitory neurons thereby having complex and often opposing roles in modulating circuit excitability (Chalifoux & Carter, 2011). The difficulties in employing GABABR signalling to regulate circuit excitability are further suggested by the heterogeneity of receptor expression in a cell type‐ and domain‐specific manner (Ault & Nadler, 1982; Price et al. 2008; Laviv et al. 2010). Based on these considerations, GABABR agonists are expected to affect both GABA and glutamate release and thereby have complex, rather than unidirectional, effects on circuit excitability, which are also likely to be cell type and circuit specific.
An additional complexity in directly applying synaptic‐level findings to the treatment of FXS is likely to arise from the heterogeneity of excitatory and inhibitory synaptic defects observed in different circuits and brain regions (Centonze et al. 2008; Gibson et al. 2008; Curia et al. 2009; Olmos‐Serrano et al. 2010; Patel et al. 2013; Wang et al. 2014 a). For instance, we have previously described a major presynaptic defect in the excitatory hippocampal CA3 and Layer 5 cortical pyramidal neurons associated with excessive AP broadening and excessive glutamate release (Deng et al. 2013). In contrast, here we found that glutamate release is unaffected in TA pathway excitatory synapses of Fmr1 KO mice formed onto the same population of CA1 neurons by the Layer 3 cortical inputs. Furthermore, we observed a complementary set of changes in inhibitory hippocampal synapses, with defects evident in the TA‐ but not in SC‐associated inhibitory synapses onto CA1 pyramidal neurons. This heterogeneity is not surprising, however, and has been described in many previous studies. For example, cortical excitatory synapses onto inhibitory fast‐spiking interneurons exhibit marked presynaptic defects in Fmr1 KO mice while excitatory synapses of the same neuron on different targets are normal (Patel et al. 2013). Similarly, large heterogeneity has been reported for the extent and direction of GABAergic transmission defects in Fmr1 KO mice (Centonze et al. 2008; Gibson et al. 2008; Curia et al. 2009; Olmos‐Serrano et al. 2010). GABABR defects are also likely to be circuit and cell type specific, since a high degree of heterogeneity in GABABR signalling is present even for excitatory synapses converging onto the same population of hippocampal neurons (Laviv et al. 2010). Specifically, in the hippocampus, excitatory cortical inputs of the TA pathway onto CA1 pyramidal neurons do not contain measurable levels of presynaptic GABABRs, while the excitatory SC synapses onto the same population of CA1 neurons do (Laviv et al. 2010). We found here that the opposite is the case for the TA and SC pathway‐associated inhibitory hippocampal synapses. Our current findings suggest that extensive additional investigation is needed to better understand the complexity and diversity of GABABR signalling and its role in FXS neuropathology.
How does E/I imbalance in the basic FFI circuit we observed here contribute to FXS neuropathology? FFI circuits play key roles in many information‐processing operations (Gabernet et al. 2005; Klyachko & Stevens, 2006; Dudman et al. 2007; Izumi & Zorumski, 2008; Ferrante et al. 2009; Chittajallu et al. 2013; Han & Heinemann, 2013). In particular, the FFI circuits of the TA pathway are known to be involved in the induction and tuning of multiple forms of heterosynaptic plasticity at the SC synapses (Dudman et al. 2007; Izumi & Zorumski, 2008; Han & Heinemann, 2013), for the generation and maintenance of the theta frequencies (Ang et al. 2005), as well as for overall hippocampal information flow (Basu et al. 2013). Alterations in the FFI properties have many critical implications for the local network functionality. Indeed, we found that the altered E/I ratio has major implications for the fundamental operations performed by the FFI circuits in Fmr1 KO mice. Specifically, the coincidence detection‐based modulation of spiking probability in the target excitatory neuron was abnormally shifted in Fmr1 KO mice towards excessive enhancement of spiking at short time intervals and reduced spike blocking at longer intervals. This hyperactive spiking behaviour implies a reduction in ability to discriminate the incoming spike patterns. The FFI circuit function is therefore abnormally shifted in a way that blunts its ability for coincidence detection and further promotes circuit hyperexcitability. Given that precise E\I balance is required for proper FFI circuit functioning (Pouille & Scanziani, 2001; Remondes & Schuman, 2002; Gabernet et al. 2005; Ferrante et al. 2009; Chittajallu et al. 2013), we predict that many other FFI circuit operations are likely to be abnormal in the FXS mouse model. Our results provide a first step towards further investigation into local circuit dysfunction in FXS and the role of GABABR signalling in these defects.
Additional information
Competing interests
The authors declare no competing financial interest.
Author contributions
S.W.H. and V.K. conceptualized and designed the experiments. S.W.H. collected, assembled, and analysed the data. S.W.H. and V.A.K. interpreted the data, drafted and revised the manuscript, and approved the final publication.
Funding
This work was supported in part by grant to V.A.K. from the NINDS R01 NS081972 and IGERT pre‐doctoral fellowship to S.W.H.
Acknowledgements
We thank Dr Cavalli and Dr Owyoung for their constructive comments.
References
- Ang CW, Carlson GC & Coulter DA (2005). Hippocampal CA1 circuitry dynamically gates direct cortical inputs preferentially at theta frequencies. J Neurosci 25, 9567–9580. [DOI] [PMC free article] [PubMed] [Google Scholar]
- Ault B & Nadler JV (1982). Baclofen selectively inhibits transmission at synapses made by axons of CA3 pyramidal cells in the hippocampal slice. J Pharmacol Exp Ther 223, 291–297. [PubMed] [Google Scholar]
- Bassell GJ & Warren ST (2008). Fragile X syndrome: loss of local mRNA regulation alters synaptic development and function. Neuron 60, 201–214. [DOI] [PMC free article] [PubMed] [Google Scholar]
- Basu J, Srinivas KV, Cheung SK, Taniguchi H, Huang ZJ & Siegelbaum SA (2013). A cortico‐hippocampal learning rule shapes inhibitory microcircuit activity to enhance hippocampal information flow. Neuron 79, 1208–1221. [DOI] [PMC free article] [PubMed] [Google Scholar]
- Berry‐Kravis EM, Hessl D, Rathmell B, Zarevics P, Cherubini M, Walton‐Bowen K, Mu Y, Nguyen DV, Gonzalez‐Heydrich J, Wang PP, et al (2012). Effects of STX209 (arbaclofen) on neurobehavioral function in children and adults with fragile X syndrome: a randomized, controlled, phase 2 trial. Sci Transl Med 4, 152ra127. [DOI] [PubMed] [Google Scholar]
- Braat S & Kooy RF (2014). Insights into GABAergic system deficits in fragile X syndrome lead to clinical trials. Neuropharmacology 88C, 48–54. [DOI] [PubMed] [Google Scholar]
- Centonze D, Rossi S, Mercaldo V, Napoli I, Ciotti MT, De Chiara V, Musella A, Prosperetti C, Calabresi P, Bernardi G & Bagni C (2008). Abnormal striatal GABA transmission in the mouse model for the fragile X syndrome. Biol Psychiatry 63, 963–973. [DOI] [PubMed] [Google Scholar]
- Chalifoux JR & Carter AG (2011). GABAB receptor modulation of synaptic function. Curr Opin Neurobiol 21, 339–344. [DOI] [PMC free article] [PubMed] [Google Scholar]
- Chittajallu R, Pelkey KA & McBain CJ (2013). Neurogliaform cells dynamically regulate somatosensory integration via synapse‐specific modulation. Nat Neurosci 16, 13–15. [DOI] [PMC free article] [PubMed] [Google Scholar]
- Cruz HG, Ivanova T, Lunn ML, Stoffel M, Slesinger PA & Luscher C (2004). Bi‐directional effects of GABAB receptor agonists on the mesolimbic dopamine system. Nat Neurosci 7, 153–159. [DOI] [PubMed] [Google Scholar]
- Curia G, Papouin T, Seguela P & Avoli M (2009). Downregulation of tonic GABAergic inhibition in a mouse model of fragile X syndrome. Cereb Cortex 19, 1515–1520. [DOI] [PMC free article] [PubMed] [Google Scholar]
- D'Hulst C, De Geest N, Reeve SP, Van Dam D, De Deyn PP, Hassan BA & Kooy RF (2006). Decreased expression of the GABAA receptor in fragile X syndrome. Brain Res 1121, 238–245. [DOI] [PubMed] [Google Scholar]
- Deng PY & Klyachko VA (2011). The diverse functions of short‐term plasticity components in synaptic computations. Commun Integr Biol 4, 543–548. [DOI] [PMC free article] [PubMed] [Google Scholar]
- Deng PY, Rotman Z, Blundon JA, Cho Y, Cui J, Cavalli V, Zakharenko SS & Klyachko VA (2013). FMRP regulates neurotransmitter release and synaptic information transmission by modulating action potential duration via BK channels. Neuron 77, 696–711. [DOI] [PMC free article] [PubMed] [Google Scholar]
- Deng PY, Sojka D & Klyachko VA (2011). Abnormal presynaptic short‐term plasticity and information processing in a mouse model of fragile x syndrome. J Neurosci 31, 10971–10982. [DOI] [PMC free article] [PubMed] [Google Scholar]
- Dudman JT, Tsay D & Siegelbaum SA (2007). A role for synaptic inputs at distal dendrites: instructive signals for hippocampal long‐term plasticity. Neuron 56, 866–879. [DOI] [PMC free article] [PubMed] [Google Scholar]
- Empson RM & Heinemann U (1995). The perforant path projection to hippocampal area CA1 in the rat hippocampal‐entorhinal cortex combined slice. J Physiol 484, 707–720. [DOI] [PMC free article] [PubMed] [Google Scholar]
- Ferrante M, Migliore M & Ascoli GA (2009). Feed‐forward inhibition as a buffer of the neuronal input‐output relation. Proc Natl Acad Sci USA 106, 18004–18009. [DOI] [PMC free article] [PubMed] [Google Scholar]
- Fitzjohn SM, Palmer MJ, May JE, Neeson A, Morris SA & Collingridge GL (2001). A characterisation of long‐term depression induced by metabotropic glutamate receptor activation in the rat hippocampus in vitro . J Physiol 537, 421–430. [DOI] [PMC free article] [PubMed] [Google Scholar]
- Gabernet L, Jadhav SP, Feldman DE, Carandini M & Scanziani M (2005). Somatosensory integration controlled by dynamic thalamocortical feed‐forward inhibition. Neuron 48, 315–327. [DOI] [PubMed] [Google Scholar]
- Gantois I, Vandesompele J, Speleman F, Reyniers E, D'Hooge R, Severijnen LA, Willemsen R, Tassone F & Kooy RF (2006). Expression profiling suggests underexpression of the GABAA receptor subunit delta in the fragile X knockout mouse model. Neurobiol Dis 21, 346–357. [DOI] [PubMed] [Google Scholar]
- Gibson JR, Bartley AF, Hays SA & Huber KM (2008). Imbalance of neocortical excitation and inhibition and altered UP states reflect network hyperexcitability in the mouse model of fragile X syndrome. J Neurophysiol 100, 2615–2626. [DOI] [PMC free article] [PubMed] [Google Scholar]
- Goncalves JT, Anstey JE, Golshani P & Portera‐Cailliau C (2013). Circuit level defects in the developing neocortex of fragile X mice. Nat Neurosci 16, 903–909. [DOI] [PMC free article] [PubMed] [Google Scholar]
- Guetg N, Seddik R, Vigot R, Turecek R, Gassmann M, Vogt KE, Brauner‐Osborne H, Shigemoto R, Kretz O, Frotscher M, et al (2009). The GABAB1a isoform mediates heterosynaptic depression at hippocampal mossy fiber synapses. J Neurosci 29, 1414–1423. [DOI] [PMC free article] [PubMed] [Google Scholar]
- Han EB & Heinemann SF (2013). Distal dendritic inputs control neuronal activity by heterosynaptic potentiation of proximal inputs. J Neurosci 33, 1314–1325. [DOI] [PMC free article] [PubMed] [Google Scholar]
- Henderson C, Wijetunge L, Kinoshita MN, Shumway M, Hammond RS, Postma FR, Brynczka C, Rush R, Thomas A, Paylor R, et al (2012). Reversal of disease‐related pathologies in the fragile X mouse model by selective activation of GABAB receptors with arbaclofen. Sci Transl Med 4, 152ra128. [DOI] [PMC free article] [PubMed] [Google Scholar]
- Izumi Y & Zorumski CF (2008). Direct cortical inputs erase long‐term potentiation at Schaffer collateral synapses. J Neurosci 28, 9557–9563. [DOI] [PMC free article] [PubMed] [Google Scholar]
- Klyachko VA & Stevens CF (2006). Excitatory and feed‐forward inhibitory hippocampal synapses work synergistically as an adaptive filter of natural spike trains. PLoS Biol 4, e207. [DOI] [PMC free article] [PubMed] [Google Scholar]
- Kullmann DM (1994). Amplitude fluctuations of dual‐component EPSCs in hippocampal pyramidal cells: implications for long‐term potentiation. Neuron 12, 1111–1120. [DOI] [PubMed] [Google Scholar]
- Laviv T, Riven I, Dolev I, Vertkin I, Balana B, Slesinger PA & Slutsky I (2010). Basal GABA regulates GABABR conformation and release probability at single hippocampal synapses. Neuron 67, 253–267. [DOI] [PubMed] [Google Scholar]
- Lovett‐Barron M & Losonczy A (2014). Behavioral consequences of GABAergic neuronal diversity. Curr Opin Neurobiol 26, 27–33. [DOI] [PubMed] [Google Scholar]
- Martin BS, Corbin JG & Huntsman MM (2014). Deficient tonic GABAergic conductance and synaptic balance in the fragile X syndrome amygdala. J Neurophysiol 112, 890–902. [DOI] [PMC free article] [PubMed] [Google Scholar]
- Myrick LK, Deng P, Hashimoto H, Oh YM, Cho Y, Poidevin MJ, Suhl JA, Visootsak J, Cavalli V, Jin P, et al (2015). Independent role for presynaptic FMRP revealed by an FMR1 missense mutation associated with intellectual disability and seizures. Proc Natl Acad Sci USA 112, 949–956. [DOI] [PMC free article] [PubMed] [Google Scholar]
- Olmos‐Serrano JL, Paluszkiewicz SM, Martin BS, Kaufmann WE, Corbin JG & Huntsman MM (2010). Defective GABAergic neurotransmission and pharmacological rescue of neuronal hyperexcitability in the amygdala in a mouse model of fragile X syndrome. J Neurosci 30, 9929–9938. [DOI] [PMC free article] [PubMed] [Google Scholar]
- Pacey LK, Tharmalingam S & Hampson DR (2011). Subchronic administration and combination metabotropic glutamate and GABAB receptor drug therapy in fragile X syndrome. J Pharmacol Exp Ther 338, 897–905. [DOI] [PMC free article] [PubMed] [Google Scholar]
- Paluszkiewicz SM, Martin BS & Huntsman MM (2011). Fragile X syndrome: the GABAergic system and circuit dysfunction. Dev Neurosci 33, 349–364. [DOI] [PMC free article] [PubMed] [Google Scholar]
- Patel AB, Hays SA, Bureau I, Huber KM & Gibson JR (2013). A target cell‐specific role for presynaptic Fmr1 in regulating glutamate release onto neocortical fast‐spiking inhibitory neurons. J Neurosci 33, 2593–2604. [DOI] [PMC free article] [PubMed] [Google Scholar]
- Patel AB, Loerwald KW, Huber KM & Gibson JR (2014) Postsynaptic FMRP promotes the pruning of cell‐to‐cell connections among pyramidal neurons in the L5A neocortical network. J Neurosci 34, 3413–3418. [DOI] [PMC free article] [PubMed] [Google Scholar]
- Perez‐Garci E, Gassmann M, Bettler B & Larkum ME (2006). The GABAB1b isoform mediates long‐lasting inhibition of dendritic Ca2+ spikes in layer 5 somatosensory pyramidal neurons. Neuron 50, 603–616. [DOI] [PubMed] [Google Scholar]
- Pouille F & Scanziani M (2001). Enforcement of temporal fidelity in pyramidal cells by somatic feed‐forward inhibition. Science 293, 1159–1163. [DOI] [PubMed] [Google Scholar]
- Price CJ, Scott R, Rusakov DA & Capogna M (2008). GABAB receptor modulation of feedforward inhibition through hippocampal neurogliaform cells. J Neurosci 28, 6974–6982. [DOI] [PMC free article] [PubMed] [Google Scholar]
- Remondes M & Schuman EM (2002). Direct cortical input modulates plasticity and spiking in CA1 pyramidal neurons. Nature 416, 736–740. [DOI] [PubMed] [Google Scholar]
- Remondes M & Schuman EM (2004). Role for a cortical input to hippocampal area CA1 in the consolidation of a long‐term memory. Nature 431, 699–703. [DOI] [PubMed] [Google Scholar]
- Rotman Z, Deng PY & Klyachko VA (2011). Short‐term plasticity optimizes synaptic information transmission. J Neurosci 31, 14800–14809. [DOI] [PMC free article] [PubMed] [Google Scholar]
- Wang GX, Smith SJ & Mourrain P (2014. a). Fmr1 KO and fenobam treatment differentially impact distinct synapse populations of mouse neocortex. Neuron 84, 1273–1286. [DOI] [PMC free article] [PubMed] [Google Scholar]
- Wang XS, Peng CZ, Cai WJ, Xia J, Jin D, Dai Y, Luo XG, Klyachko VA & Deng PY (2014. b). Activity‐dependent regulation of release probability at excitatory hippocampal synapses: a crucial role of fragile X mental retardation protein in neurotransmission. Eur J Neurosci 39, 1602–1612. [DOI] [PMC free article] [PubMed] [Google Scholar]