

Abstract
Key points
Neurostimulation is a rapidly emerging approach to swallowing rehabilitation, but cerebellar stimulation has not been explored as a treatment. Such proposed therapies for post‐stroke dysphagia have required confirmation of physiological effects and optimisation of parameters in healthy humans prior to translational progression into patient groups.
There is strong evidence for a role of the cerebellum in swallowing physiology, but this relationship has been under‐explored.
Recently, single pulses of cerebellar magnetic stimulation have been shown to directly evoke responses from pharyngeal musculature and produce short‐term enhancement of cortico‐pharyngeal motor evoked potentials, suggesting the feasibility of a cerebellar approach to neurostimulation in the swallowing system.
We therefore examined multiple parameters of repetitive cerebellar magnetic stimulation and have described the optimal settings to provoke longer‐lasting changes in swallowing neurophysiology. Based on evidence from the post‐stroke dysphagia neurostimulation literature, these changes may have a therapeutic potential for swallowing rehabilitation.
Abstract
Brain neurostimulation has been shown to modulate cortical swallowing neurophysiology in post‐stroke dysphagia with therapeutic effects which are critically dependent on the stimulation parameters. Cerebellar neurostimulation is, however, a novel, unexplored approach to modulation of swallowing pathways as a prelude to therapy for dysphagia. Here, we randomised healthy human subjects (n = 17) to receive one of five cerebellar repetitive TMS (rTMS) interventions (Sham, 1 Hz, 5 Hz, 10 Hz and 20 Hz) on separate visits to our laboratory. Additionally, a subset of subjects randomly received each of three different durations (50, 250, 500 pulses) of optimal frequency versus sham cerebellar rTMS. Prior to interventions subjects underwent MRI‐guided single‐pulse transcranial magnetic stimulation (TMS) to co‐localise pharyngeal and thenar representation in the cortex and cerebellum (midline and hemispheric) before acquisition of baseline motor evoked potential (MEP) recordings from each site as a measure of excitability. Post‐interventional MEPs were recorded for an hour and compared to sham using repeated measures ANOVA. Only 10 Hz cerebellar rTMS increased cortico‐pharyngeal MEP amplitudes (mean bilateral increase 52%, P = 0.007) with effects lasting 30 min post‐intervention with an optimal train length of 250 pulses (P = 0.019). These optimised parameters of cerebellar rTMS can produce sustained increases in corticobulbar excitability and may have clinical translation in future studies of neurogenic dysphagia.
Abbreviations
- cb‐PMEP
cerebellar‐evoked PMEP
- EMG
electromyography
- ISI
inter‐stimulus interval
- MRI
magnetic resonance imaging
- PMEP
pharyngeal motor evoked potential
- rmANOVA
repeated measures ANOVA
- rTMS
repetitive transcranial magnetic stimulation
- rMT
resting motor threshold
- TMS
transcranial magnetic stimulation
- TMEP
cortically evoked thenar motor evoked potential
Introduction
The cerebellum is important in planning and executing complex motor tasks. Evidence from animal studies (Mussen, 1927, 1930; Reis et al. 1973; Ball et al. 1974; Colombel et al. 2002; Zhu et al. 2006) and human functional brain imaging (Hamdy et al. 1999; Mosier et al. 1999; Zald & Pardo, 1999; Mosier & Bereznaya, 2001; Suzuki et al. 2003; Harris et al. 2005; Malandraki et al. 2009; Mihai et al. 2013) implies cerebellar involvement in the neurophysiological control of swallowing. Furthermore, additional evidence for the role of the cerebellum in swallowing comes from pathological associations between oropharyngeal dysphagia and cerebellar stroke (Perie et al. 1999; Prosiegel et al. 2005; Iwanami et al. 2007; Steinhagen et al. 2009), degenerative cerebellar diseases (Ramio‐Torrentia et al. 2006; Isono et al. 2013), partial cerebellectomy (Fukuda et al. 2012) and pre‐ and post‐operative dysphagia in posterior fossa tumours (Prosiegel et al. 2005; Morgan et al. 2008; Wadhwa et al. 2013). Despite its apparent neurophysiological importance, the physiological relevance of the cerebellum in swallowing remains relatively unexplored. Recently, Jayasekeran et al. (2011 b) systematically probed this relationship using single‐pulse transcranial magnetic stimulation (TMS) and discovered that distinctive cerebellar‐evoked (cb)‐pharyngeal motor evoked potentials (PMEPs) with similar response latencies to cortically evoked (cortical) PMEPs could be evoked from cerebellar sites (both the cerebellar midline and hemispheres). Interestingly, when paired pulses of cerebellar–cortical conditioning were delivered at short inter‐stimulus intervals (ISIs) (50, 100 and 200 ms), this strongly excited pharyngeal corticobulbar projections (Jayasekeran et al. 2011 b). These findings led us to hypothesise that longer‐trains of high‐frequency (5, 10 and 20 Hz) cerebellar repetitive TMS (rTMS) would produce long‐lasting excitatory corticobulbar effects. Such changes could have therapeutic potential given that this type of brain plasticity has been shown to improve swallowing in post‐stroke dysphagia (Khedr et al. 2009; Jayasekeran et al. 2010; Kumar et al. 2011; Michou et al. 2012; Park et al. 2013). Moreover, the effects of both high‐ (Jefferson et al. 2009) and low‐frequency cortical rTMS (Gow et al. 2004 b; Mistry et al. 2007) applied to pharyngeal motor cortex are critically dependent on the train‐length of interventions. Given the evidence for frequency specific modulation of the swallowing neural network, we further hypothesised that repetitive cerebellar stimulation would show evidence for frequency and durational dependency of its effects on swallowing corticobulbar projections.
Methods
Subjects
Power calculations
Based on a 40% effect size (suggested by similarly designed neurostimulation‐based studies in the swallowing literature; Gow et al. 2004 b; Jayasekeran et al. 2011 b), we determined that at least 12 full data sets would be required to achieve a power of 80% and statistical significance of 5%. This would also be a large enough sample to determine interventional differences compared to sham (Vasant et al. 2014).
Subjects
Healthy subjects were recruited (n = 17, 11 males, 6 females, mean age 30 ± 3 years). All subjects complied with exclusion criteria including pregnancy, epilepsy, cardiac pacemaker, previous brain surgery, claustrophobia, previous swallowing problems, use of centrally acting medication and implanted metal. Written informed consent was obtained prior to participation. All components of the study were approved separately by Greater Manchester East Research Ethics Committee and were conducted at Salford Royal NHS Foundation Trust in accordance with the World Medical Association's Declaration of Helsinki.
Experimental techniques
Magnetic resonance imaging
Each healthy subject had a whole‐brain anatomical magnetic resonance scan (T1* weighted image, Phillips 3T Intera‐Achiva, Netherlands). The subject's head was immobilised in a cradle within the head coil, using foam padding to minimise movement.
Neuronavigation
All subjects' magnetic resonance imaging (MRI) whole‐brain anatomical scans were uploaded onto neuronavigation software (Brainsight2, Rogue Research, Montréal, QC, Canada) on a personal computer (Apple iMac). Neuronavigated‐TMS has advantages when targeting specific brain regions with some evidence for improved accuracy and reliability of neurophysiological data (Sparing et al. 2008; Julkunen et al. 2009; Bashir et al. 2011). Given the potential advantages, we adopted neuronavigation in our healthy subject protocols. At the beginning of each session, anatomical co‐registration was performed using a remote controlled pointer and an optical tracking system (Polaris Vicra, NDI, Ontario, Canada). Subsequently, following single‐pulse TMS, cortical and cerebellar sites were co‐registered with the subjects' own MRI brain‐scan using frameless stereotaxy and a calibrated TMS coil to confirm the optimal sites. Once identified, these hot‐spots were saved as targets for future mapping sessions. If any TMS hot‐spots appeared anatomically suboptimal on an MRI brain scan, the hot‐spot was refined with a combination of real‐time neuronavigation and single‐pulse TMS.
Electromyography
Pharyngeal
Volunteers swallowed a 3.2 mm diameter intraluminal catheter (Gaeltec Ltd, Isle of Skye, UK) housing a pair of bipolar platinum ring‐electrodes such that the electrodes were positioned at mid‐pharyngeal level (15–17 cm from the nasal flare or 13–15 cm aboral depending on subject preference) enabling recording of PMEPs.
Thenar
As a secondary control, thenar motor evoked potentials (TMEPs) from the abductor pollicis brevis muscle contralateral to the hemisphere giving the largest cortical PMEPs were also recorded via surface electrodes (H69P, Tyco Healthcare, Gosport, UK). The catheter and thenar and two earth electrodes were connected via a preamplifier (CED 1902; Cambridge Electronic Design, Cambridge, UK) with high and low pass filter settings of 200 Hz and 2 kHz, respectively. Response signals were processed through a 50/60 Hz noise eliminator (‘HumBug’; Quest Scientific, North Vancouver, Canada) to remove unwanted electrical interference collected through a laboratory interface (CED micro 1401) at a sampling rate of 5 kHz and recorded using Signal software (v4.0, CED) running on a personal computer.
Cortical and cerebellar single‐pulse TMS
Single‐pulse TMS was applied to all sites using a figure‐of‐eight coil (outer diameter 7 cm) with a maximum output of 2.2 T (The Magstim Company, Whitland, UK). For cortical PMEPs and TMEPs, the coil handle was held in an antero‐posterior direction at an angle of 45 deg tangential to the scalp (Hamdy et al. 1996), whereas for cerebellar (cb)‐PMEPs, the coil was positioned over the posterior fossa, tangentially to the scalp with the handle pointing superiorly (Jayasekeran et al. 2011 b).
Cerebellar rTMS
Trains of stimuli were delivered through a figure‐of‐eight coil connected to a Magstim super‐rapid stimulator (The Magstim Company) with a maximum output of 1.8 T. The cerebellar site evoking the largest amplitude cb‐PMEPs (strong cerebellar site) was selected as the stimulation site for all interventions. Signal software was programmed to generate the predetermined stimulation parameters according to randomisation.
Protocols
Experimental protocol 1: effects of low (1 Hz) and high‐frequency (5, 10 and 20 Hz) cerebellar rTMS conditioning on pharyngeal motor cortex and cerebellar excitability
Subjects wore a tightly‐fitted disposable cap upon which anatomical landmarks including the cranial‐vertex and inion were identified and marked. They were intubated with the pharyngeal catheter to allow mapping of the pharyngeal cortical representation by discharging TMS at suprathreshold intensities bilaterally to identify the optimal sites for pharyngeal responses. To enhance targeting accuracy, neuronavigation was used to validate coil positioning for each hot‐spot on each subject's MRI brain scan. At these marked sites, the pharyngeal resting motor threshold (rMT) for each hemisphere was determined by the lowest intensity of single‐pulse TMS required to evoke cortical PMEPs of > 20 μV on 50% of occasions. Thenar cortical representation and rMT were determined on the hemisphere with stronger pharyngeal cortical representation (the side that produced the largest amplitude cortical PMEPs at the lowest intensity). In order to determine the optimal sites for evoking cb‐PMEPs at the midline and both cerebellar hemispheres, previously described optimal cerebellar sites (Jayasekeran et al. 2011 b) were marked as reference points. Single pulses of TMS were then sequentially discharged over the posterior fossa to confirm the optimal coil positions to evoke cb‐PMEPs at all three cerebellar sites (midline and both hemispheres). The strongest cerebellar site and the cerebellar rMT (stimulator output (%) required to evoke cb‐PMEPs > 20μV on 50% of trials) were determined.
Baseline measurements of cortical excitability at all three sites (both pharyngeal cortices and hand (thenar) motor cortex) were obtained by delivering 10 pulses of single‐pulse TMS at rMT+20% stimulator output (total 30 stimuli). Baseline measurements of cerebellar excitability at all three sites (right, midline and left cerebellum) were made by delivering five single pulses of TMS at rMT+10% stimulator output (total of 15 stimuli).
Each of five different rTMS interventions were then randomly assigned (StatsDirect v2.7.8, StatsDirect Ltd, Altrincham, UK) and delivered over the strongest cerebellar site, on separate visits, at least 1 week apart. Prior to delivery of intervention, rMT was re‐confirmed using the super‐rapid stimulator. To assess the effects of stimulation frequency the following interventions were trialled: (a) sham, delivered at 5 Hz (below) but with the coil tilted to 90 deg ensuring that only the edge of one wing of the figure‐of‐eight coil was in contact with the head (Jayasekeran et al. 2011 b); (b) 1 Hz: single continuous train of 600 stimuli delivered at an intensity of 90% cerebellar rMT; (c) 5 Hz: five trains of 50 stimuli (each lasting 10 s) with an intra‐train interval of 10 s delivered at 90% of thenar rMT; (d) 10 Hz: five trains of 50 stimuli (each lasting 5 s) with an intra‐train interval of 10 s delivered at 90% of thenar rMT; and (e) 20 Hz: 10 trains of 25 stimuli (each lasting 1.25 s) with an intra‐train interval of 10 s delivered at 90% of thenar rMT.
A conscious decision was made not to include theta burst stimulation (TBS) in the present studies given that previously we had not observed any effects of TBS on swallowing. We postulated that the safety criteria that we had to apply in those experiments limited stimulation intensities to levels that were too low to induce effects in the pharyngeal motor cortex (Mistry et al. 2007, 2012). The different intensities and durations selected for high‐ and low‐frequency interventions in this study were based on previous experience in pharyngeal cortical rTMS studies; where 1 Hz interventions have been administered at higher intensities (based on pharyngeal rMT) (Mistry et al. 2007) than high‐frequency interventions (based on thenar rMT) (Jefferson et al. 2009). All the rTMS parameters applied were compliant with international safety guidelines on the use of TMS (Machii et al. 2006; Rossi et al. 2009). High‐frequency interventions were limited to 250 pulses to equalise energy dissipation between interventions and based on the study by Jefferson et al. (2009).
Post‐intervention, cortical and cerebellar excitability was followed up with single pulses of TMS as per baseline, immediately and repeated every 15 min for an hour.
Experimental protocol 2: effects of varying duration of optimal frequency cerebellar rTMS on pharyngeal motor cortex and cerebellar excitability
A subset of subjects from protocol 1 (n = 12, 7 male, 5 female, mean age 31 ± 4 years) underwent the same neuronavigated‐TMS procedures to confirm hot‐spots before baseline assessments of cortical and cerebellar excitability. Each of four different optimal frequency rTMS interventions was then randomly assigned and delivered over the strong cerebellar site on separate visits at least 1 week apart, to assess the effects of stimulation duration. The following train lengths of optimal frequency rTMS were trialled: (a) sham: pulses delivered at intermediate train length (below) but with coil tilted to 90 deg (as in protocol 1 (a)); (b) short: one train of 50 stimuli at 90% thenar rMT; (c) intermediate: five trains of 50 stimuli with intra‐train interval of 10 s delivered at 90% of thenar rMT; and (d) long: 10 trains of 50 stimuli with intra‐train interval of 10 s delivered at 90% of thenar rMT.
As with protocol 1, both cortical and cerebellar excitabilities were measured before, immediately post‐intervention and every 15 min for 1 h post‐intervention.
Data analysis
For each site, mean latency and peak‐to‐peak amplitudes of MEPs were determined from each group of 10 traces for pharynx and thenar, and from each group of five traces for cb‐PMEPs. In order to minimise variability (and eliminate the effects of age and sex within our population), data were normalised to percentage change from baseline.
Statistics
Cortical and cerebellar MEPs were analysed separately using a standard statistical software package (IBM SPSS Statistics 20, IBM, Armonk, NY, USA). Initially, raw baseline MEP data were compared non‐parametrically (Kruskal–Wallis) to avoid bias resulting from studies being conducted on separate days. Based on previous studies (Jefferson et al. 2009; Michou et al. 2012; Vasant et al. 2014), percentage change from baseline MEP amplitudes and latencies were compared to sham using separate general linear model repeated‐measures analysis of variance (rmANOVA) excluding baseline values. Significant effects were followed up with post hoc analyses using Bonferroni's correction for multiple comparisons to explore the strength of the main effects. Non‐sphericity was corrected using the Greenhouse–Geisser correction where necessary. Data are displayed as means (± standard error of the mean) unless stated otherwise.
Results
Protocol 1: effects of varying cerebellar rTMS frequency on PMEPs
In all 17 healthy subjects, reproducible MEPs were evoked from all cortical and cerebellar neuronavigated hot‐spots (Figs 1, 2, 3). Cerebellar rTMS was well tolerated at all parameters without any adverse effects. Twelve of the 17 subjects had larger cb‐PMEPs from left cerebellar hemisphere, whereas 5/17 had stronger right cerebellar pharyngeal representation. Therefore, no subject received interventions at the cerebellar midline. The majority of subjects (14/17) had strongest cerebellar‐pharyngeal representation ipsilateral to the strongest pharyngeal cortical representation.
Figure 1. Schematic plot of motor hot‐spots .

Group mean laterality and antero‐posterior distances (with standard deviation) from cranial vertex to cortico‐pharyngeal and cortico‐thenar hot‐spots (A) and from inion to pharyngeal motor representation in the cerebellum (B).
Figure 2. Representative neuronavigated‐TMS mapping data from one subject co‐registered with the subject's own MRI brain scan .
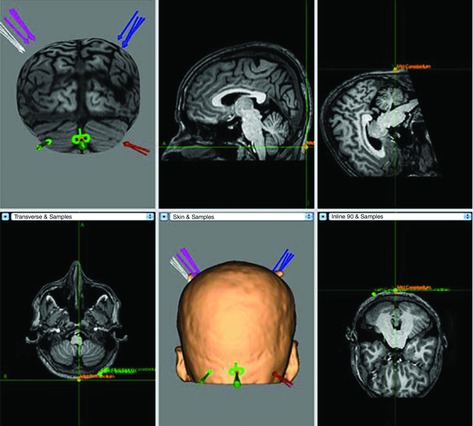
This figure shows 'hot‐spot' reproducibility (each arrow at each site corresponding to one of five sessions). In this figure the coil is being targeted over the cerebellar midline.
Figure 3. Representative pharyngeal EMG traces from an individual participant displaying MEPs at each hot‐spot following 10 Hz rTMS .
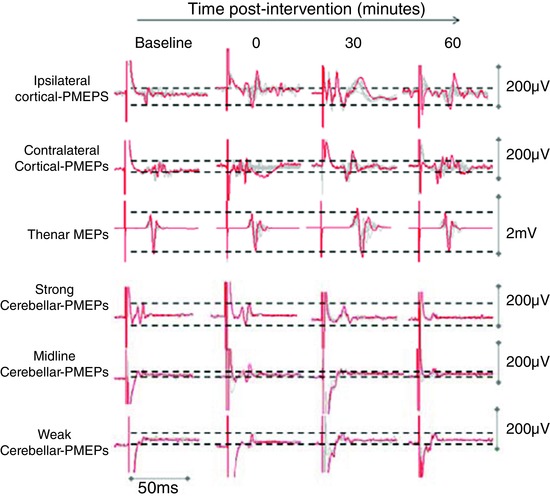
Trace clusters for cortical sites comprise 10 overdrawn responses and 5 overdrawn responses for cerebellar sites. Cerebellar rTMS at 10 Hz increased pharyngeal cortical excitability. Baseline cerebellar responses were consistently larger on the nominated strong (ipsilateral) cerebellar site.
Baseline MEPs data were similar at all sites over the five experimental sessions (Kruskal–Wallis test; ipsilateral pharynx: χ2 = 0.9, df = 4, P = 0.93; contralateral pharynx: χ2 = 0.2, df = 4, P = 1.0; thenar: χ2 = 2.4, df = 4, P = 0.66; strong cerebellum: χ2 = 4.3, df = 4, P = 0.37; mid cerebellum: χ2 = 3, df = 4, P = 0.57; and weak cerebellum: χ2 = 0.6, df = 4, P = 0.96) and latencies (ipsilateral pharynx: χ2 = 3.2, df = 4, P = 0.53; contralateral pharynx: χ2 = 0.1, df = 4, P = 1.0; thenar: χ2 = 0.5, df = 4, P = 0.97; strong cerebellum: χ2 = 0.8, df = 4, P = 0.94; mid cerebellum: χ2 = 0.9, df = 4, P = 0.93; and weak cerebellum: χ2 = 0.3, df = 4, P = 0.99). Group baseline rMT, MEPs amplitudes, latencies and stimulation intensities for each condition are all displayed in Table 1.
Table 1.
Group data confirming similar cortical and cerebellar rMT, MEP amplitudes and latencies at baseline and stimulation intensities used for each interventional condition
| Baseline data | Sham | 1 Hz | 5 Hz | 10 Hz | 20 Hz |
|---|---|---|---|---|---|
| Mean (±SEM) cortical (pharyngeal) rMT (% stimulator output) | 69 ± 2 | 70 ± 2 | 70 ± 2 | 68 ± 2 | 69 ± 2 |
| Mean (±SEM) cortical (thenar) rMT (% stimulator output) | 40 ± 2 | 41 ± 3 | 42 ± 3 | 40 ± 2 | 41 ± 2 |
| Mean (±SEM) cerebellar rMT (% stimulator output) | 57 ± 2 | 60 ± 1 | 59 ± 2 | 57 ± 1 | 57 ± 1 |
| Cortical PMEP amplitude (μV) | 101.4 | 88.1 | 83.0 | 105.7 | 100.9 |
| Cortical TMEP amplitude (μV) | 655.4 | 774.6 | 890.6 | 612.1 | 721.7 |
| cb‐PMEP amplitude (μV) | 64.1 | 86.9 | 66.9 | 84.7 | 67.1 |
| Cortical PMEP latency (ms) | 8.6 | 8.3 | 8.6 | 8.5 | 8.4 |
| TMEP latency (ms) | 22.1 | 21.9 | 21.9 | 21.7 | 21.5 |
| cb‐PMEPs latency (ms) | 8.1 | 8.3 | 7.9 | 8.2 | 8.1 |
| Mean (±SEM) intervention intensity (% stimulator output) | Sham | 62 ± 3 | 53 ± 2 | 53 ± 2 | 53 ± 2 |
Data are displayed as median values unless stated otherwise. Pharyngeal cortical data are combined from both hemispheres and cerebellar data are combined from the all three cerebellar sites.
Cortical PMEPs
Normalised cortical PMEP amplitude data were examined with rmANOVA with factors of Treatment, Hemispheric Site and Time, revealing a significant two‐way interaction between Treatment x Time (F 1,16 = 7.3, P = 0.02). There were also significant main effects of Treatment (F 4,64 = 7.0, P < 0.001) and Time (F 4,64 = 2.6, P = 0.04), without main effects of Hemispheric Site (F 1,16 = 0.0, P = 0.97). Given the lack of statistical evidence to support differences in the pattern of excitability between hemispheres, PMEPs from both cortical hot‐spots were combined. Separate post hoc two‐way analyses of the effects of each Treatment compared to sham confirmed significant effects after 10 Hz intervention (F 1,16 = 17.4, P = 0.001, adjusted for multiple comparisons P = 0.007 (Bonferroni)) but not for the other frequencies (1 Hz: F 1,16 = 0.1, P = 0.79; 5 Hz: F 1,16 = 0.9, P = 0.37; 20 Hz: F 1,16 = 0.7, P = 0.43; Fig. 4 A). Post hoc analyses (Bonferroni) to explore the effects of 10 Hz intervention and Time confirmed sustained effects, which were present immediately (P = 0.01) and at 15 min (P = 0.003), and peaked 30 min post‐intervention (mean difference +67%, P = 0.003).
Figure 4. Effects of cerebellar rTMS on cortical PMEP (combined data from both hemispheres) .
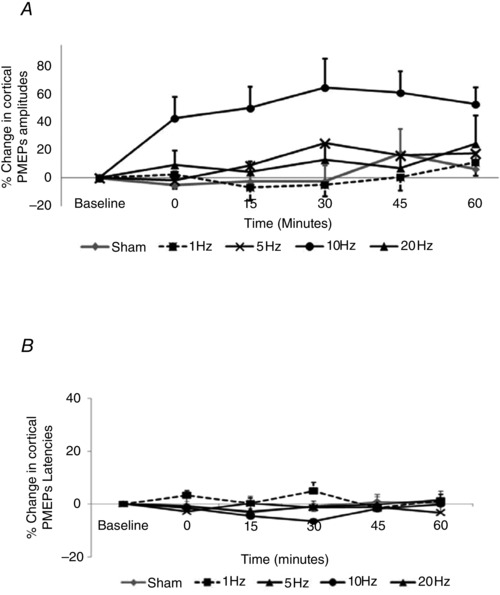
A, amplitude; B, latency. Cerebellar rTMS at 10 Hz increased cortical excitability compared to sham (P = 0.007, Bonferroni), with effects peaking 30 min post‐intervention (*P < 0.05) without altering cortical PMEP latencies.
Cortical PMEP latencies were similarly compared, combining data from both pharyngeal hemispheres and examining with rmANOVA with factors of Treatment and Time. There were no two‐way interactions between Treatment x Time (F 6,95 = 2.0, P = 0.07) or main effects of factors (Treatment: F 4,64 = 1.4, P = 0.24; Time: F 4,64 = 0.4, P = 0.82), and therefore further analyses were not considered (Fig. 4 B).
cb‐PMEPs
The effects on cerebellar excitability were compared using rmANOVA with factors of Treatment, Cerebellar Site and Time. There were no significant two‐ or three‐way interactions between factors nor any main effects of factors (Treatment: F 3,38 = 1.8, P = 0.17; Cerebellar Site: F 2,28 = 0.64, P = 0.54; Time: F 4,56 = 0.8, P = 0.53). Interestingly, separate post hoc two‐way rmANOVAs comparing each Treatment to sham revealed that only 1 Hz intervention (F 1,14 = 3.15, P = 0.09) displayed trend towards an effect of Treatment in increasing cerebellar excitability (Fig. 5 A).
Figure 5. Effects of cerebellar conditioning frequency on cb‐PMEPs (combined data from all cerebellar hot‐spots .
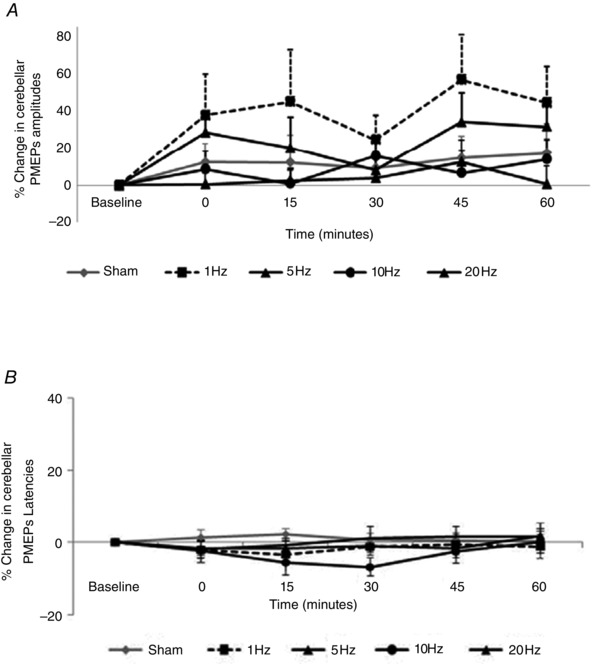
A, amplitudes; B, latencies. No interventions significantly altered cb‐PMEPs compared to sham.
Similarly, using the same factors cb‐PMEP latency data were compared using rmANOVA. Again, there were no significant interactions between factors, and therefore further analyses were not considered (Fig. 5 B).
All site and thenar MEPs
Site‐specificity of cortical effects compared to sham were examined using rmANOVA with factors of Treatment, Cortical Site (pharyngeal cortical sites combined, thenar) and Time revealing significant two‐way interactions betweenTreatment x Time (F 1,16 = 8.7, P = 0.01) and Site x Time (F 1,16 = 4.8, P = 0.04) and significant main effects of Treatment (F 4,64, = 4.3, P = 0.004). Subsequent two‐way rmANOVA with factors of Treatment and Time on TMEPs were non‐significant (Treatment x Time: F 7,114 = 0.9, P = 0.58; Treatment: F 2,40 = 0.8, P = 0.51; Time: F 4,64 = 0.7, P = 0.63). This indicated that almost all of the effect was driven by changes in pharyngeal motor cortical output. Similarly, TMEP latencies (compared the same way) did not reveal any interactions between Treatment x Time (F 16,24 = 0.5, P = 0.94) or main effects of Treatment (F 4,60 = 0.6, P = 0.68) or Time (F 4,60 = 0.26, P = 0.9).
Protocol 2: the effects of varying cerebellar rTMS duration on PMEPs
Baseline cortical MEP amplitudes (Kruskal–Wallis test; ipsilateral pharynx: χ2 = 3, df = 3, P = 0.47; contralateral pharynx: χ2 = 3, df = 3, P = 0.46; thenar: χ2 = 4, df = 3, P = 0.31) and latency (ipsilateral pharynx: χ2 = 2.7, df = 3, P = 0.43; contralateral pharynx: χ2 = 5.9, df = 3, P = 0.12; thenar: χ2 = 0.03, df = 3, P = 1.0) did not differ between the four separate sessions.
Baseline ipsilateral and midline cb‐PMEPs did not differ between sessions in either amplitude (ipsilateral: χ2 = 5.0, df = 3, P = 0.17; midline: χ2 = 1, df = 3, P = 0.75) or latency (ipsilateral: χ2 = 0.33, df = 3, P = 0.96; midline: χ2 = 0.1, df = 3, P = 1.0). Baseline contralateral cb‐PMEPs varied between sessions in amplitude (χ2 = 11.2, df = 3, P = 0.01) but not latency (χ2 = 0.1, df = 3, P = 0.96). Group baseline rMT, MEP amplitudes, latencies and stimulation intensities for each interventional condition are displayed in Table 2.
Table 2.
Group data from Protocol 2 displaying cortical and cerebellar rMT, MEP amplitudes and latencies at baseline and intensities of cerebellar stimulation for each interventional condition
| Baseline data | Sham 10 Hz | 50 pulses 10 Hz | 250 pulses 10 Hz | 500 pulses 10 Hz |
|---|---|---|---|---|
| Mean (±SEM) cortical (pharyngeal) rMT (% stimulator output) | 69 ± 3 | 67 ± 2 | 66 ± 2 | 68 ± 2 |
| Mean (±SEM) cortical (thenar) rMT (% stimulator output) | 42 ± 2 | 40 ± 2 | 39 ± 2 | 42 ± 2 |
| Mean (±SEM) cerebellar rMT (% stimulator output) | 56 ± 1 | 60 ± 2 | 59 ± 2 | 58 ± 1 |
| Cortical PMEP amplitude (μV) | 101.4 | 104.4 | 117.9 | 93.8 |
| Cortical TMEP amplitude (μV) | 756.5 | 649.1 | 608.1 | 520.9 |
| cb‐PMEP amplitude (μV) | 62.6 | 92.8 | 73.1 | 114.5 |
| Cortical PMEP latency (ms) | 8.7 | 8.7 | 8.7 | 8.2 |
| TMEP latency (ms) | 21.9 | 21.8 | 21.9 | 21.8 |
| cb‐PMEP latency (ms) | 8.2 | 8.2 | 8.1 | 8.3 |
| Mean (±SEM) intervention intensity (% stimulator output) | Sham | 56 ± 3 | 53 ± 2 | 58 ± 2 |
Data are displayed as median values unless stated otherwise. Pharyngeal cortical data are combined from both hemispheres and cerebellar data are combined from the all three cerebellar sites.
Cortical PMEPs
Given that there was no difference in the pattern of excitability between hemispheres in Protocol 1, the effects of varying train lengths of 10 Hz cerebellar rTMS on combined PMEP amplitudes from both hemispheres were compared to sham using rmANOVA with factors of Treatment (sham, 50, 250 or 500 pulses) and Time. Whilst there were no significant interactions between factors, there were overall significant main effects of Treatment (F 3,33 = 4.2, P = 0.013) and Time (F 2,27 = 3.2, P = 0.05). Separate post hoc two‐way ANOVAs comparing each Treatment to sham confirmed that only 250‐pulses intervention significantly increased excitability (mean increase: 48 ± 13%, F 1,11 = 14.0, P = 0.003, multiple comparisons correction P = 0.019 (Bonferroni)). There was also a trend towards Treatment effect following the longest (500 pulses; mean increase: 21 ± 9%, F 1,11 = 4.5, P = 0.058) but not with the shortest intervention (50 pulses; 15 ± 9%, F 1,11 = 1.7, P = 0.21) (Fig. 6). Post hoc tests (Bonferroni) confirmed that these significant Time effects over the first 30 min were driven by the 250‐pulse intervention (immediately (P = 0.06), at 15 min (P = 0.001) and at 30 min post‐intervention (P = 0.04)).
Figure 6. Cortical PMEP amplitudes (A) and latencies (B) following short (50 pulses) and longer trains (250 and 500 pulses) of 10 Hz cerebellar rTMS (combined data from both hemispheres) .
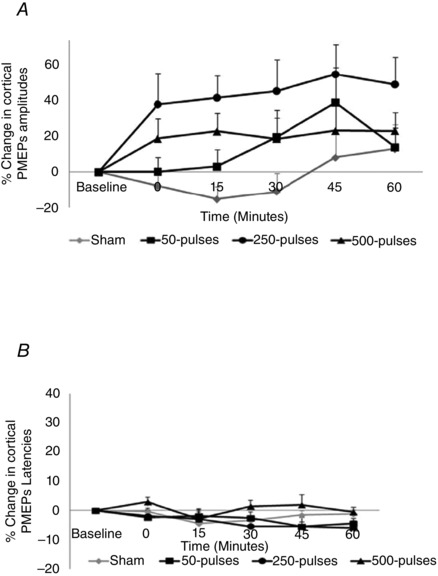
Train length of 250 pulses optimally increased cortical PMEP amplitudes compared to sham (P = 0.019) without altering latency.
As before, compared to sham, none of the 10 Hz interventions altered cortical PMEP latencies (Treatment x Time: F 12,120 = 0.8, P = 0.67; Treatment: F 3,30 = 1, P = 0.43; Time: F 4,40 = 2.2, P = 0.09; Fig. 6 B).
cb‐PMEPs
None of the train lengths of 10 Hz rTMS altered cerebellar excitability compared to sham, with no significant interactions or main effects of factors (Treatment: F 3,27 = 1.9, P = 0.15; Cerebellar Site: F 2,18 = 1.9, P = 0.18; Time: F 4,36 = 1.1, P = 0.38; Fig. 7 A).
Figure 7. Change in cerebellar PMEP amplitudes (A) and latencies (B) (combined data from all cerebellar hot‐spots) following short (50 pulses) and longer trains (250 and 500 pulses) of 10 Hz cerebellar rTMS .
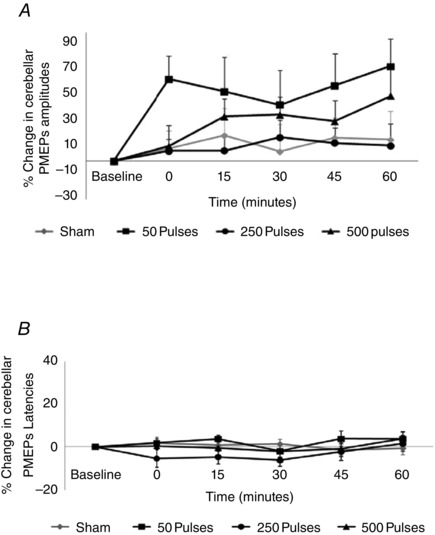
None of the three train lengths of 10 Hz rTMS produced differences in cb‐PMEPs compared to sham.
Three‐way rmANOVA on cb‐PMEP latencies revealed no significant interactions without main effects of factors (Treatment: F 3,18 = 1.5, P = 0.26; Cerebellar Site: F 1.2,6.9 = 5.1, P = 0.06; Time: F 4,24 = 0.9, P = 0.50), and therefore no further analyses were required (Fig. 7 B).
Discussion
We examined the effects of differing frequencies of cerebellar rTMS on pharyngeal cortical and cerebellar excitability. The findings supported our hypothesis that high‐frequency cerebellar rTMS can robustly produce physiologically relevant effects on the excitability of corticobulbar projections to the pharynx. Of interest, these effects were frequency specific, with the effects of 10 Hz cerebellar rTMS not extending to thenar cortex, indicating system specificity within the pharyngeal cortex. Of further interest, our neuronavigation study provides further anatomical information about pharyngeal motor representation in the cerebellum. These findings may be important in understanding dysphagia after cerebellar injury, the role of the cerebellum in swallowing and the potential role of cerebellar conditioning in post‐stroke dysphagia rehabilitation, and are discussed further.
Effects of high‐frequency cerebellar conditioning on pharyngeal cortical excitability
Based on previous work which demonstrated that paired pulses of cerebellar and cortical TMS delivered at intervals of 50, 100 and 200 ms can facilitate pharyngeal motor pathways, we hypothesised that trains of cerebellar rTMS may induce long‐term plasticity in the pharyngeal motor system (Jayasekeran et al. 2011 b). Our data now confirm that only 10 Hz cerebellar rTMS increased excitability of the corticobulbar projections to the pharynx compared to sham.
Specific effects with only 10 Hz frequency cerebellar conditioning are in contrast to peripheral (pharyngeal electrical) (Fraser et al. 2002) and cortical (rTMS) stimulation (Gow et al. 2004 b) in the swallowing literature, where only 5 Hz interventions increased pharyngeal corticobulbar excitability. In the case of peripheral and cortical neurostimulation, specificity of the 5 Hz interventions can be explained by the 200 ms ISIs between consecutive stimuli providing adequate time for pharyngeal sensory input to reach the cortex (60–80 ms), interaction of coincident input at the level of the sensorimotor cortex and dissipation of refractory repolarisation allowing greater 'wind‐up' of the swallowing system (Gow et al. 2004 a). If we believe that the altered excitability following cerebellar rTMS occured at the cortical level, our current data may suggest that stimuli delivered to the pharyngeal cerebellar region may have a shorter conduction pathway to cortex (half the duration) possibly indirectly via the brainstem, thus favouring a shorter ISI of 100 ms between consecutive stimuli. Further research would be necesary to confirm the conduction latency for cerebello‐cortical sensory evoked potentials and test this hypothesis. An alternative explanation could be that if the cerebellum has a tonic facilitatory effect on the cortex/brainstem, then some properties associated with 10 Hz stimulation may act locally in the cerebellar cortex to modulate this tonic level of excitatory drive to the motor cortex. Another possibility could be that the corticopharyngeal excitation became more synchronous following cerebellar rTMS reducing the phase cancellation due to temporal dispersion.
Finally, given the close proximity of the cerebellum in the posterior fossa to structures including the cranial nerve nuclei, one cannot fully exclude the possibility that the aftereffects of cerebellar targeted rTMS were due to excitability changes at cranial nerve nuclei which would affect their response to the descending corticospinal activity. However, one argument against this is that if the effects on cortical PMEPs were due to increased excitability of bulbar motoneurones, then we would have expected a shortening of cortico‐pharyngeal latency reflecting the excited motoneurones being nearer to threshold.
In terms of high‐frequency intervention parameters, previous work with cortical rTMS has shown that excitatory effects are train‐length but not intensity dependent, with 250 pulses having superior efficacy compared with a 100‐pulse and 1000‐pulse intervention (Jefferson et al. 2009). Recently, a small clinical trial in post‐stroke dysphagia reported therapeutic benefit using a set 500‐pulse intervention without confirming its effectiveness on cortical excitability (Park et al. 2013). In the present study, the effects of 250‐pulse train length compared to sham were stronger than either shorter (50 pulses) or longer (500 pulses) train lengths, suggesting a ceiling effect, with no additional excitatory benefit of increasing the number of stimuli beyond 250 pulses.
As with other TMS studies in the swallowing literature (Jayasekeran et al. 2010, 2011 a), there is a degree of inter‐individual variability in the responses to the optimal 10 Hz cerebellar rTMS intervention. Interestingly, recent evidence suggests that patient genotypes may influence swallowing neuroplasticity (Mentz et al. 2015; Nimmons et al. 2015; Raginis‐Zborowska et al. 2015) and stimulation induced changes in the pharyngeal motor cortex (Jayasekeran et al. 2011 a), perhaps explaining inter‐individual variability. Future studies may therefore genotype subjects to determine if the presence of certain genetic polymorphisms can predict responses to 10 Hz cerebellar rTMS.
Effects of low‐frequency cerebellar conditioning on pharyngeal cortical excitability
One‐hertz cerebellar rTMS did not alter pharyngeal motor excitability, contrasting the effects of direct cortical 1 Hz stimulation using the same train length. One explanation for this finding could be that cerebellar inputs to the central cortical swallowing system have little or no inhibitory functions. Therefore attempting to induce inhibition in the cortical system with (presumed) inhibitory paradigms to the cerebellum may be inherently impossible. However, if we assumed that the input from the cerebellum was tonic and facilitatory, another explanation could be that the delivered intensities of 1 Hz rTMS (limited to 90% of cerebellar rMT to confirm safety and tolerability) were not high enough to induce significant inhibition in the cortical system through indirect pathways. This would mirror the situation with cortical rTMS, where only high‐intensity 1 Hz interventions (120% pharyngeal rMT) could sufficiently suppress cortical PMEPs (Mistry et al. 2007). Future studies examining swallowing neurophysiology and behaviour may therefore compare the effects of higher intensities or duration of 1 Hz rTMS, targeting cerebellum either ipsilaterally, contralaterally or even bilaterally.
Pharyngeal representation of the cerebellum and site specificity of cortical effects
A recent mapping study demonstrated that topographically organised motor responses can be evoked from cerebellar cortex (Mottolese et al. 2013) and previous work from our group has shown that PMEPs can be evoked with single pulses of TMS targeted at the cerebellum (Jayasekeran et al. 2011 b). With the advantage of neuronavigation we have now been able to confirm the optimal posterior fossa sites for obtaining these responses, which are consistently ∼4.3 cm lateral to the inion for cerebellar hemispheres and slightly lower (∼2.5 cm) than in the previous non‐navigated study (Jayasekeran et al. 2011 b), potentially explaining why baseline cb‐PMEP amplitudes were larger and more comparable in magnitude to cortical PMEPs with slightly lower cerebellar rMTs in the present study. cb‐PMEP latencies were consistent with those reported in a previous study (Jayasekeran et al. 2011 b) in which the authors simultaneously examined cranial nerve evoked PMEPs (supraorbital branch of the trigeminal nerve) as a secondary control and confirmed a large difference in latencies between cerebellar (8.3–10 ms) and cranial nerve PMEPs (responses after 24 ms); furthermore cb‐PMEP latencies were found to be similar to cortical PMEPs (Jayasekeran et al. 2011 b). Whilst these findings suggest that cb‐PMEPs are independent of peripheral trigeminal nerve related effects, it should be noted that the glossopharyngeal nerve (which exits via a different foramen at the base of the skull) is experimentally more difficult to control for and therefore a role in the observed cb‐PMEPs cannot be fully excluded. Nonetheless, given that previous foraminal level TMS studies have reported inability to induce deep enough brain stimulation to evoke responses from descending motor tracts at the brainstem level without a double cone TMS coil (Ugawa et al. 1994), it is very unlikely that we would have been able to evoke such responses via eddy currents so consistently using a figure of eight coil. Secondly, if the effects of the observed cb‐PMEPs were due to stimulation at the foraminal level, we would have expected the largest responses from the cerebellar midline rather than the hemispheres, given that the previous foraminal studies have shown the optimal site for foraminal evoked MEPs is the inion (Ugawa et al. 1994; Arai et al. 2005; Lo & Fook‐Chong, 2006).
Specifically targeting the pharyngeal motor representation in the cerebellum may explain the lack of effects of our interventions on thenar excitability. This is in keeping with the evidence that that the hand musculature has previously been described to be represented more rostrally within hemispheric lobule VI of the cerebellum (Mottolese et al. 2013). Whilst we observed bilateral pharyngeal cortical excitation after cerebellar conditioning, another possible explanation for the lack of effect on thenar excitability may be that we did not record TMEPs bilaterally and therefore may have missed an opportunity to study the effects of cerebellar rTMS on the opposite thenar motor cortex. The cerebellar rTMS hand literature has largely focused on assessing the excitability of the contralateral M1 following 1 Hz rTMS, often using higher intensities (Langguth et al. 2008) and longer stimulation duration (Fierro et al. 2007; Langguth et al. 2008) than our study, with some authors reporting an increase in intracortical M1 excitability (Oliveri et al. 2005) but others reporting a decrease (Fierro et al. 2007; Langguth et al. 2008). However this remains a contentious issue due to conflicting data using differing parameters and measures of M1 excitability (Grimaldi et al. 2014).
Effects of cerebellar rTMS interventions on cerebellar excitability
None of the cerebellar interventions trialled significantly altered direct cerebellar excitability compared to sham. Limitations of recording only five traces at each site per time point and performing cb‐PMEPs at rMT + 10% might have contributed to less stable responses (Paine et al. 2006), with variability in MEP amplitudes from the 'weaker' cerebellar hemisphere as demonstrated in protocol 2 where there were some differences in baseline excitability for one of the interventions despite remarkably stable latencies. Recent evidence suggests that use of a double‐cone TMS coil for cerebellar stimulation may help to counteract this by improving the reproducibility and stability of traces given the superiority in terms of stimulation depth and consistency of MEP responses at lower intensities compared to a figure of eight coil (Hardwick et al. 2014). Interestingly, our data showed a visible but non‐significant increase in cerebellar excitability following inhibitory (1 Hz) rTMS accompanied by a trend to reduction in cortical excitability. Conversely, 10 Hz rTMS produced the lowest change in cerebellar excitability of the interventions trialled and yet produced the highest cortical excitability. Whilst these data should be interpreted with caution, they suggest some relationship between cerebellar excitability and the detected changes in cortical excitability, implicating possible modulation of cerebellar excitability with some (bidirectional) influence on intercurrent cortical excitability. These data may imply that cerebellar rTMS might produce effects on corticobulbar projections by modulating both pharyngeal motor cortex and brainstem, whereas cb‐PMEPs may only be affected locally by changes in brainstem excitability. Another possibility is that rTMS at the cerebellum may have caused foraminal stimulation of the glossopharyngeal nerve at the base of the skull due to eddy currents. Based on evidence from studies of glossopharyngeal nerve stimulation in rats (Kitagawa et al. 2002), we would expect the magnitude of the resultant effects on the swallowing system to depend on stimulation intensity, potentially explaining why the highest intensity intervention (1 Hz cerebellar rTMS) resulted in such a marked yet variable increase in cb‐PMEPs. Given the technical limitations which may have contributed to variability of cerebellar responses as described above, inclusion of additional participants may have been beneficial to clarify the effects of 1 Hz rTMS on the cerebellar responses; nonetheless the data in the present study would be useful to estimate the sample sizes required for future studies of cb‐PMEPs.
Clinical utility
As a novel treatment approach, cerebellar stimulation may have advantages compared to other neurostimulation techniques. For example, it may be considered less invasive than intraluminal stimulation, given that catheter intubation is not required. Additionally, safety data suggest much lower risk of seizures as an adverse event following cerebellar rTMS (Machii et al. 2006) compared to motor areas (Wassermann, 1998; Rossi et al. 2009).
Conclusion
In conclusion, our findings show that cerebellar rTMS can modulate pharyngeal corticobulbar excitability with long‐lasting effects, in a frequency and duration dependent manner. Further work should focus on applying the optimal parameters of cerebellar rTMS in healthy subjects after focal cortical inhibition to the pharyngeal motor cortex and thence a randomised controlled trial in post‐stroke dysphagia.
Additional information
Competing interests
None of the authors have any financial disclosures to declare.
Author contributions
D.H.V. obtained part of the funding, designed the experiments, performed the studies to acquire the data, analysed data, and wrote the manuscript; E.M. assisted during the studies and helped write the manuscript; S.M. co‐wrote an application for part of the funding, provided technical assistance during data acquisition and helped write the manuscript; J.C.R. co‐wrote the funding application, and helped with conceptualisation of the study, data interpretation and input into critical revision of the manuscript for important intellectual content; S.H. obtained funding, conceptualised and supervised the study, and helped with data interpretation and writing the manuscript. All authors have read and approved the final submission.
Funding
Supported by grants from the Wellcome Trust (091809/Z/10/Z) and a pump‐priming award from University of Manchester Neuroscience Research Institute. The study was sponsored by the University of Manchester, UK, which did not have a role in the study design, or in the collection, analysis or interpretation of data.
Translational perspective
We have systematically investigated the application of repetitive cerebellar magnetic stimulation on excitability of the human pharyngeal motor cortex over time. The results confirm that high frequency cerebellar stimulation induces long‐lasting bilateral increases in excitability of the swallowing motor cortex. These effects are critically dependant on stimulation frequency and duration. The magnitude of the induced changes in excitability with these optimal parameters compares well with other modalities of neurostimulation (intraluminal pharyngeal electrical and non‐invasive cortical stimulation) that have been proven to be effective as swallowing therapies in both pre‐clinical models (‘virtual‐lesion’ studies) in healthy subjects and randomised clinical trials in post‐stroke dysphagia patients. Potential translational advantages of cerebellar stimulation include lower seizure risk compared to the cortical approach and it may be adapted to not require intraluminal intubation with a pharyngeal catheter. Further research will determine if this approach may have clinical utility in stroke or indeed other neurological disorders causing dysphagia.
Acknowledgements
The authors would like to acknowledge Dr Vanoo Jayasekeran who contributed to the design of some of the initial experimental protocols.
References
- Arai N, Okabe S, Furubayashi T, Terao Y, Yuasa K & Ugawa Y (2005). Comparison between short train, monophasic and biphasic repetitive transcranial magnetic stimulation (rTMS) of the human motor cortex. Clin Neurophysiol 116, 605–613. [DOI] [PubMed] [Google Scholar]
- Ball GG, Micco DJ Jr & Berntson GG (1974). Cerebellar stimulation in the rat: complex stimulation‐bound oral behaviors and self‐stimulation. Physiol Behav 13, 123–127. [DOI] [PubMed] [Google Scholar]
- Bashir S, Edwards D & Pascual‐Leone A (2011). Neuronavigation increases the physiologic and behavioral effects of low‐frequency rTMS of primary motor cortex in healthy subjects. Brain Topogr 24, 54–64. [DOI] [PMC free article] [PubMed] [Google Scholar]
- Colombel C, Lalonde R & Caston J (2002). The effects of unilateral removal of the cerebellar hemispheres on motor functions and weight gain in rats. Brain Res 950, 231–238. [DOI] [PubMed] [Google Scholar]
- Fierro B, Giglia G, Palermo A, Pecoraro C, Scalia S & Brighina F (2007). Modulatory effects of 1 Hz rTMS over the cerebellum on motor cortex excitability. Exp Brain Res 176, 440–447. [DOI] [PubMed] [Google Scholar]
- Fraser C, Power M, Hamdy S, Rothwell J, Hobday D, Hollander I, Tyrell P, Hobson A, Williams S & Thompson D (2002). Driving plasticity in human adult motor cortex is associated with improved motor function after brain injury. Neuron 34, 831–840. [DOI] [PubMed] [Google Scholar]
- Fukuda M, Oishi M, Hiraishi T, Saito A & Fujii Y (2012). Pharyngeal motor evoked potentials elicited by transcranial electrical stimulation for intraoperative monitoring during skull base surgery. J Neurosurg 116, 605–610. [DOI] [PubMed] [Google Scholar]
- Gow D, Hobson AR, Furlong P & Hamdy S (2004. a). Characterising the central mechanisms of sensory modulation in human swallowing motor cortex. Clin Neurophysiol 115, 2382–2390. [DOI] [PubMed] [Google Scholar]
- Gow D, Rothwell J, Hobson A, Thompson D & Hamdy S (2004. b). Induction of long‐term plasticity in human swallowing motor cortex following repetitive cortical stimulation. Clin Neurophysiol 115, 1044–1051. [DOI] [PubMed] [Google Scholar]
- Grimaldi G, Argyropoulos GP, Boehringer A, Celnik P, Edwards MJ, Ferrucci R, Galea JM, Groiss SJ, Hiraoka K, Kassavetis P, Lesage E, Manto M, Miall RC, Priori A, Sadnicka A, Ugawa Y & Ziemann U (2014). Non‐invasive cerebellar stimulation–a consensus paper. Cerebellum 13, 121–138. [DOI] [PubMed] [Google Scholar]
- Hamdy S, Aziz Q, Rothwell JC, Singh KD, Barlow J, Hughes DG, Tallis RC & Thompson DG (1996). The cortical topography of human swallowing musculature in health and disease. Nat Med 2, 1217–1224. [DOI] [PubMed] [Google Scholar]
- Hamdy S, Rothwell JC, Brooks DJ, Bailey D, Aziz Q & Thompson DG (1999). Identification of the cerebral loci processing human swallowing with H2 15O PET activation. J Neurophysiol 81, 1917–1926. [DOI] [PubMed] [Google Scholar]
- Hardwick RM, Lesage E & Miall RC (2014). Cerebellar transcranial magnetic stimulation: The role of coil geometry and tissue depth. Brain Stimul 7, 643–649. [DOI] [PMC free article] [PubMed] [Google Scholar]
- Harris ML, Julyan P, Kulkarni B, Gow D, Hobson A, Hastings D, Zweit J & Hamdy S (2005). Mapping metabolic brain activation during human volitional swallowing: a positron emission tomography study using [18F]fluorodeoxyglucose. J Cereb Blood Flow Metab 25, 520–526. [DOI] [PubMed] [Google Scholar]
- Isono C, Hirano M, Sakamoto H, Ueno S, Kusunoki S & Nakamura Y (2013). Differences in dysphagia between spinocerebellar ataxia type 3 and type 6. Dysphagia 28, 413–418. [DOI] [PubMed] [Google Scholar]
- Iwanami H, Odaka M & Hirata K (2007). Bilateral cerebellar infarction caused by intracranial dissection of the vertebral artery after long periods of "Shiatsu". Brain Nerve 59, 169–171. [PubMed] [Google Scholar]
- Jayasekeran V, Pendleton N, Holland G, Payton A, Jefferson S, Michou E, Vasant D, Ollier B, Horan M, Rothwell J & Hamdy S (2011. a). Val66Met in brain‐derived neurotrophic factor affects stimulus‐induced plasticity in the human pharyngeal motor cortex. Gastroenterology 141, 827–836. [DOI] [PubMed] [Google Scholar]
- Jayasekeran V, Rothwell J & Hamdy S (2011. b). Non‐invasive magnetic stimulation of the human cerebellum facilitates cortico‐bulbar projections in the swallowing motor system. Neurogastroenterol Motil 23, 831–e341. [DOI] [PubMed] [Google Scholar]
- Jayasekeran V, Singh S, Tyrrell P, Michou E, Jefferson S, Mistry S, Gamble E, Rothwell J, Thompson D & Hamdy S (2010). Adjunctive functional pharyngeal electrical stimulation reverses swallowing disability after brain lesions. Gastroenterology 138, 1737–1746. [DOI] [PubMed] [Google Scholar]
- Jefferson S, Mistry S, Michou E, Singh S, Rothwell JC & Hamdy S (2009). Reversal of a virtual lesion in human pharyngeal motor cortex by high frequency contralesional brain stimulation. Gastroenterology 137, 841–849. [DOI] [PubMed] [Google Scholar]
- Julkunen P, Saisanen L, Danner N, Niskanen E, Hukkanen T, Mervaala E & Kononen M (2009). Comparison of navigated and non‐navigated transcranial magnetic stimulation for motor cortex mapping, motor threshold and motor evoked potentials. Neuroimage 44, 790–795. [DOI] [PubMed] [Google Scholar]
- Khedr EM, Abo‐Elfetoh N & Rothwell JC (2009). Treatment of post‐stroke dysphagia with repetitive transcranial magnetic stimulation. Acta Neurol Scand 119, 155–161. [DOI] [PubMed] [Google Scholar]
- Kitagawa J, Shingai T, Takahashi Y & Yamada Y (2002). Pharyngeal branch of the glossopharyngeal nerve plays a major role in reflex swallowing from the pharynx. Am J Physiol Regul Integr Comp Physiol 282, R1342–1347. [DOI] [PubMed] [Google Scholar]
- Kumar S, Wagner CW, Frayne C, Zhu L, Selim M, Feng W & Schlaug G (2011). Noninvasive brain stimulation may improve stroke‐related dysphagia: a pilot study. Stroke 42, 1035–1040. [DOI] [PMC free article] [PubMed] [Google Scholar]
- Langguth B, Eichhammer P, Zowe M, Landgrebe M, Binder H, Sand P & Hajak G (2008). Modulating cerebello‐thalamocortical pathways by neuronavigated cerebellar repetitive transcranial stimulation (rTMS). Neurophysiol Clin 38, 289–295. [DOI] [PubMed] [Google Scholar]
- Lo YL & Fook‐Chong S (2006). Magnetic brainstem stimulation of the hypoglossal nerve in normal subjects. Eur J Neurol 13, 419–422. [DOI] [PubMed] [Google Scholar]
- Machii K, Cohen D, Ramos‐Estebanez C & Pascual‐Leone A (2006). Safety of rTMS to non‐motor cortical areas in healthy participants and patients. Clin Neurophysiol 117, 455–471. [DOI] [PubMed] [Google Scholar]
- Malandraki GA, Sutton BP, Perlman AL, Karampinos DC & Conway C (2009). Neural activation of swallowing and swallowing‐related tasks in healthy young adults: an attempt to separate the components of deglutition. Hum Brain Mapp 30, 3209–3226. [DOI] [PMC free article] [PubMed] [Google Scholar]
- Mentz H, Horan M, Payton A, Ollier W, Pendleton N & Hamdy S (2015). Homozygosity in the ApoE 4 polymorphism is associated with dysphagic symptoms in older adults. Dis Esophagus 28, 97–103. [DOI] [PubMed] [Google Scholar]
- Michou E, Mistry S, Jefferson S, Singh S, Rothwell J & Hamdy S (2012). Targeting unlesioned pharyngeal motor cortex improves swallowing in healthy individuals and after dysphagic stroke. Gastroenterology 142, 29–38. [DOI] [PMC free article] [PubMed] [Google Scholar]
- Mihai PG, von Bohlen Und Halbach O & Lotze M (2013). Differentiation of cerebral representation of occlusion and swallowing with fMRI. Am J Physiol Gastrointest Liver Physiol 304, G847–854. [DOI] [PubMed] [Google Scholar]
- Mistry S, Michou E, Rothwell J & Hamdy S (2012). Remote effects of intermittent theta burst stimulation of the human pharyngeal motor system. Eur J Neurosci 36, 2493–2499. [DOI] [PMC free article] [PubMed] [Google Scholar]
- Mistry S, Verin E, Singh S, Jefferson S, Rothwell JC, Thompson DG & Hamdy S (2007). Unilateral suppression of pharyngeal motor cortex to repetitive transcranial magnetic stimulation reveals functional asymmetry in the hemispheric projections to human swallowing. J Physiol 585, 525–538. [DOI] [PMC free article] [PubMed] [Google Scholar]
- Morgan AT, Sell D, Ryan M, Raynsford E & Hayward R (2008). Pre and post‐surgical dysphagia outcome associated with posterior fossa tumour in children. J Neurooncol 87, 347–354. [DOI] [PubMed] [Google Scholar]
- Mosier K & Bereznaya I (2001). Parallel cortical networks for volitional control of swallowing in humans. Exp Brain Res 140, 280–289. [DOI] [PubMed] [Google Scholar]
- Mosier KM, Liu WC, Maldjian JA, Shah R & Modi B (1999). Lateralization of cortical function in swallowing: a functional MR imaging study. AJNR Am J Neuroradiol 20, 1520–1526. [PMC free article] [PubMed] [Google Scholar]
- Mottolese C, Richard N, Harquel S, Szathmari A, Sirigu A & Desmurget M (2013). Mapping motor representations in the human cerebellum. Brain 136, 330–342. [DOI] [PubMed] [Google Scholar]
- Mussen A (1927). Experimental investigations on the cerebellum. Brain 50, 313–319. [Google Scholar]
- Mussen A (1930). The cerebellum: the influence of the cortical reactions on the classification and the homology of the lobes and fissures in the cat, monkey and man. Arch Neurol Psychiatry 24, 913–920. [Google Scholar]
- Nimmons D, Pendleton N, Payton A, Ollier W, Horan M, Wilkinson J & Hamdy S (2015). A novel association between COMT and BDNF gene polymorphisms and likelihood of symptomatic dysphagia in older people. Neurogastroenterol Motil 27, 1223–1231. [DOI] [PubMed] [Google Scholar]
- Oliveri M, Koch G, Torriero S & Caltagirone C (2005). Increased facilitation of the primary motor cortex following 1 Hz repetitive transcranial magnetic stimulation of the contralateral cerebellum in normal humans. Neurosci Lett 376, 188–193. [DOI] [PubMed] [Google Scholar]
- Paine PA, Aziz Q, Gardener E, Hobson A, Mistry S, Thompson DG & Hamdy S (2006). Assessing the temporal reproducibility of human esophageal motor‐evoked potentials to transcranial magnetic stimulation. J Clin Neurophysiol 23, 374–380. [DOI] [PubMed] [Google Scholar]
- Park JW, Oh JC, Lee JW, Yeo JS & Ryu KH (2013). The effect of 5 Hz high‐frequency rTMS over contralesional pharyngeal motor cortex in post‐stroke oropharyngeal dysphagia: a randomized controlled study. Neurogastroenterol Motil 25, 324–331. [DOI] [PubMed] [Google Scholar]
- Perie S, Wajeman S, Vivant R & St Guily JL (1999). Swallowing difficulties for cerebellar stroke may recover beyond three years. Am J Otolaryngol 20, 314–317. [DOI] [PubMed] [Google Scholar]
- Prosiegel M, Holing R, Heintze M, Wagner‐Sonntag E & Wiseman K (2005). The localization of central pattern generators for swallowing in humans–a clinical‐anatomical study on patients with unilateral paresis of the vagal nerve, Avellis' syndrome, Wallenberg's syndrome, posterior fossa tumours and cerebellar hemorrhage. Acta Neurochir Suppl 93, 85–88. [DOI] [PubMed] [Google Scholar]
- Raginis‐Zborowska A, Mekli K, Payton A, Ollier W, Hamdy S & Pendleton N (2015). Genetic determinants of swallowing impairments among community dwelling older population. Exp Gerontol 69, 196–201. [DOI] [PubMed] [Google Scholar]
- Ramio‐Torrentia L, Gomez E & Genis D (2006). Swallowing in degenerative ataxias. J Neurol 253, 875–881. [DOI] [PubMed] [Google Scholar]
- Reis DJ, Doba N & Nathan MA (1973). Predatory attack, grooming, and consummatory behaviors evoked by electrical stimulation of cat cerebellar nuclei. Science 182, 845–847. [DOI] [PubMed] [Google Scholar]
- Rossi S, Hallett M, Rossini PM, Pascual‐Leone A & Safety of TMSCG (2009). Safety, ethical considerations, and application guidelines for the use of transcranial magnetic stimulation in clinical practice and research. Clin Neurophysiol 120, 2008–2039. [DOI] [PMC free article] [PubMed] [Google Scholar]
- Sparing R, Buelte D, Meister IG, Paus T & Fink GR (2008). Transcranial magnetic stimulation and the challenge of coil placement: a comparison of conventional and stereotaxic neuronavigational strategies. Hum Brain Mapp 29, 82–96. [DOI] [PMC free article] [PubMed] [Google Scholar]
- Steinhagen V, Grossmann A, Benecke R & Walter U (2009). Swallowing disturbance pattern relates to brain lesion location in acute stroke patients. Stroke 40, 1903–1906. [DOI] [PubMed] [Google Scholar]
- Suzuki M, Asada Y, Ito J, Hayashi K, Inoue H & Kitano H (2003). Activation of cerebellum and basal ganglia on volitional swallowing detected by functional magnetic resonance imaging. Dysphagia 18, 71–77. [DOI] [PubMed] [Google Scholar]
- Ugawa Y, Uesaka Y, Terao Y, Hanajima R & Kanazawa I (1994). Magnetic stimulation of corticospinal pathways at the foramen magnum level in humans. Ann Neurol 36, 618–624. [DOI] [PubMed] [Google Scholar]
- Vasant DH, Mistry S, Michou E, Jefferson S, Rothwell JC & Hamdy S (2014). Transcranial direct current stimulation reverses neurophysiological and behavioural effects of focal inhibition of human pharyngeal motor cortex on swallowing. J Physiol 592, 695–709. [DOI] [PMC free article] [PubMed] [Google Scholar]
- Wadhwa R, Toms J, Chittiboina P, Tawfik T, Glenn C, Caldito G, Guthikonda B & Nanda A (2013). Dysphagia following posterior fossa surgery in adults. World Neurosurg 82, 822–827. [DOI] [PubMed] [Google Scholar]
- Wassermann EM (1998). Risk and safety of repetitive transcranial magnetic stimulation: report and suggested guidelines from the International Workshop on the Safety of Repetitive Transcranial Magnetic Stimulation, June 5–7, 1996. Electroencephalogr Clin Neurophysiol 108, 1–16. [DOI] [PubMed] [Google Scholar]
- Zald DH & Pardo JV (1999). The functional neuroanatomy of voluntary swallowing. Ann Neurol 46, 281–286. [PubMed] [Google Scholar]
- Zhu JN, Li HZ, Ding Y & Wang JJ (2006). Cerebellar modulation of feeding‐related neurons in rat dorsomedial hypothalamic nucleus. J Neurosci Res 84, 1597–1609. [DOI] [PubMed] [Google Scholar]