

Abstract
Key points
We determined the contribution of the hyperpolarization‐activated cationic (h) current (I h) to the homeostatic regulation of CA1 pyramidal cells in vitro using chronic treatments (48 h) that either increase (picrotoxin) or decrease (kynurenate) neuronal activity.
The h‐conductance was found to be up‐ or down‐regulated following chronic activity enhancement or activity deprivation, respectively. This bidirectional plasticity of I h was found to subsequently alter both apparent input resistance and intrinsic neuronal excitability.
Bidirectional homeostatic plasticity of I h also determined EPSP waveform and EPSP summation tested at 5–30 Hz.
Long‐term synaptic modification induced by repetitive stimulation of the Schaffer collaterals was found to be constant across treatments in the presence of I h but not when I h was blocked pharmacologically. Thus, bidirectional homeostatic regulation of I h stabilizes induction of long‐term synaptic modification in CA1 pyramidal neurons that depends on EPSP summation.
Abstract
The hyperpolarization‐activated cationic (h) current is a voltage‐shock absorber, highly expressed in the dendrites of CA1 pyramidal neurons. Up‐regulation of I h has been reported following episodes of intense network activity but the effect of activity deprivation on I h and the functional consequence of homeostatic regulation of I h remain unclear. We determined here the contribution of I h to the homeostatic regulation of CA1 pyramidal cell excitability. Intrinsic neuronal excitability was decreased in neurons treated for 2–3 days with the GABAA channel blocker picrotoxin (PiTx) but increased in neurons treated (2–3 days) with the glutamate receptor antagonist kynurenate (Kyn). Membrane capacitance remained unchanged after treatment but the apparent input resistance was reduced for PiTx‐treated neurons and enhanced for Kyn‐treated neurons. Maximal I h conductance was up‐regulated after chronic hyperactivity but down‐regulated following chronic hypoactivity. Up‐regulation of I h in PiTx‐treated cultures was found to accelerate EPSP kinetics and reduce temporal summation of EPSPs whereas opposite effects were observed in Kyn‐treated cultures, indicating that homeostatic regulation of I h may control the induction of synaptic modification depending on EPSP summation. In fact, stimulation of the Schaffer collaterals at 3–10 Hz induced differential levels of plasticity in PiTx‐treated and Kyn‐treated neurons when I h was blocked pharmacologically but not in control conditions. These data indicate that homeostatic regulation of I h normalizes the threshold for long‐term synaptic modification that depends on EPSP summation. In conclusion, bidirectional homeostatic regulation of I h not only controls spiking activity but also stabilizes the threshold for long‐term potentiation induced in CA1 pyramidal neurons by repetitive stimulation.
Abbreviations
- BCM
Bienenstock–Cooper–Monroe rule
- fEPSP
field EPSP
- Ih
hyperpolarization‐activated cationic current
- Kyn
kynurenate
- LTD
long‐term depression
- LTP
long‐term potentiation; PiTx, picrotoxin
Introduction
Hebbian synaptic plasticity has a destabilizing effect on network activity, driving synaptic strength to extreme values (Turrigiano & Nelson, 2004). Extreme potentiation or depression may indeed lead to runaway excitation or extinction of spiking activity, respectively, in neural circuits. The functional synergy observed between synaptic and intrinsic plasticity in principal neurons (Daoudal et al. 2002; Wang et al. 2003; Campanac & Debanne, 2008) may further increase this destabilization. In order to prevent these extreme cases, compensatory mechanisms, called homeostatic plasticity, act to maintain neuronal activity within physiological bounds (Turrigiano & Nelson, 2004; Turrigiano, 2011). Synaptic transmission and intrinsic neuronal excitability are indeed adjusted following persistent changes in network activity. For instance, synaptic strength and intrinsic excitability are enhanced following chronic activity deprivation (Turrigiano et al. 1998; Desai et al. 1999; Karmarkar & Buonomano, 2006; Cudmore et al. 2010). Conversely, synaptic strength and intrinsic excitability are diminished after chronic hyperactivity of neuronal circuits (Karmarkar & Buonomano, 2006). Finally, synaptic transmission and intrinsic neuronal excitability are conjointly enhanced in parvalbumin‐positive basket cells to stabilize the balance between synaptic excitation and inhibition (Campanac et al. 2013).
The substrate for homeostatic regulation of intrinsic neuronal excitability includes a wide range of voltage‐gated ion channels including Na+ (Desai et al. 1999; Aptowicz et al. 2004), Ca2+ (Desai et al. 1999) and K+ channels (Desai et al. 1999; Cudmore et al. 2010; O'Leary et al. 2010; Kirchheim et al. 2013). The hyperpolarization‐activated cationic current (I h) is a major player in the control of intrinsic excitability. It determines membrane potential, input resistance, dendritic integration, EPSP summation and constrains synaptically evoked Ca2+ spikes (Maccaferri et al. 1993; Gasparini & DiFrancesco, 1997; Magee, 1998; Tsay et al. 2007; Shah, 2014). I h is also involved in homeostatic modification of intrinsic neuronal excitability. While up‐regulation of I h has been reported upon enhanced neuronal activity (Chen et al. 2001; van Welie et al. 2004; Fan et al. 2005; Dyhrfjeld‐Johnsen et al. 2008), it is still unclear whether I h is down‐regulated after activity deprivation (Breton & Stuart, 2009).
I h controls temporal summation of EPSPs (Magee, 1998, 1999), suggesting that it might be able to set the threshold and magnitude of long‐term synaptic modification induced by repetitive stimulation of afferent inputs. In fact, in the presence of h‐channel blockers, the magnitude of long‐term potentiation (LTP) is generally enhanced (Nolan et al. 2004; Campanac et al. 2008). However, the consequence of the homeostatic modulation of I h on the induction of homosynaptic long‐term synaptic plasticity is not clearly determined, principally because the homeostatic regulation of synaptic plasticity might interfere with the homeostatic regulation of voltage‐gated conductances, including I h.
In this study, we have therefore examined the contribution of I h (1) to the homeostatic regulation of intrinsic neuronal excitability, and (2) to the induction of long‐term synaptic plasticity. We show that I h is bidirectionally regulated in CA1 pyramidal neurons by chronic manipulation of network activity in organotypic slice cultures of hippocampus. Maximal I h conductance was found to be down‐regulated after chronic (48–72 h) hypoactivity induced by the ionotropic glutamate receptor antagonist kynurenate, but up‐regulated following chronic hyperactivity induced by the GABAA channel blocker picrotoxin. This bidirectional regulation of I h is not limited to the control of intrinsic neuronal excitability. It also alters EPSP summation and subsequently compensates the up‐ and down‐regulation of long‐term synaptic modifications that result from homeostatic regulation of synaptic transmission. Our results thus indicate that homeostatic regulation of I h therefore stabilizes the threshold for long‐term synaptic modification in CA1 neurons induced by repetitive stimulation.
Methods
Organotypic hippocampal slice cultures
Interface hippocampal slice cultures were prepared as described previously (Stoppini et al. 1991; Boudkkazi et al. 2007; Debanne et al. 2008). All experimental procedures were carried out according to the European and Institutional guidelines for the care and use of laboratory animals (Council Directive 86/609/EEC and French National Research Council). Postnatal day 6–8 Wistar rats were deeply anaesthetized by intraperitoneal injection of chloral hydrate (200 mg kg−1) and killed by decapitation. The brain was removed and each hippocampus was individually dissected. Hippocampal slices (300–350 μm) were cut in an ice‐cold solution containing (mm): 280 sucrose, 26 NaHCO3, 10 d‐glucose, 10 MgCl2, 1.3 KCl, 1 CaCl2, 1 kynurenate, and were bubbled with 95% O2–5% CO2. Penicillin–streptomycin was added. Slices were then transferred onto 20 mm latex membranes (Millicell, Merck Millipore, Darmstadt, Germany) inserted into 35 mm Petri dishes containing 1 ml of culture medium and maintained in an incubator at 37°C, 95% O2–5% CO2. The culture medium contained (in ml) 25 minimum essential medium (MEM), 12.5 Hank's balanced salt solution (HBSS), 12.5 horse serum, 0.5 penicillin–streptomycin, 0.6 glucose (1 m), 0.1 ascorbic acid (1 mg ml−1), 0.4 Hepes (1 m), 0.5 B27 and 8.95 sterile H2O. To limit glial proliferation, 5 μm cytosine arabinoside (AraC) was added to the culture medium starting at 3 DIV.
Electrophysiology and data acquisition
The slice cultures were transferred to a temperature‐controlled recording chamber with oxygenated artificial cerebrospinal fluid (ACSF; in mm: NaCl, 125; KCl, 2.5; NaH2PO4, 0.8; NaHCO3, 26; CaCl2, 3; MgCl2, 2; d‐glucose, 10). CA1 pyramidal neurons were visualized by differential interference contrast (DIC) infrared (IR)‐videomicroscopy. Pipettes were filled with an internal solution containing (in mm): potassium gluconate, 120; KCl, 20; Hepes, 10; EGTA, 0.5; MgCl2, 2; Na2ATP, 2.
Electrophysiological recordings were obtained using an Axoclamp‐2B, an Axopatch‐200B or a Multiclamp‐700B amplifier (Molecular Devices, Sunnyvale, CA, USA), and pCLAMP v.8 or 10 (Molecular Devices). All the recordings of intrinsic neuronal excitability were obtained in the presence of kynurenate (2 mm) and picrotoxin (100 μm) to block excitatory and inhibitory synaptic transmission. Data were analysed with Igor Pro v.6 (Wavemetrics, Lake Oswego, OR, USA), and ClampFit (Molecular Devices).
Electrophysiological properties of recorded CA1 neurons were tested in current clamp by current injection (−155 to 155 pA; 800 ms). I h was isolated in voltage clamp by subtraction of control records from those obtained with h‐blockers (ZD‐7288) in the bath and was measured by a voltage‐clamp step from −50 mV to the test potential (−60 to −120 mV, 10 mV increment). EPSP summation was tested by injection of trains of five synaptic‐like currents at frequencies ranging from 5 to 30 Hz. The profile of the synaptic‐like current was given by f(t) = a(1 – exp(−t/τ on))exp(−t/τ off ), with τon = 1 ms and τoff = 10 ms.
Field potentials were recorded in the stratum radiatum of the CA1 region by using glass microelectrodes filled with 3 m NaCl. GABAA receptor‐mediated inhibition was blocked with 100 μm picrotoxin and the area CA1 was surgically isolated from CA3 to avoid epileptiform activity. Glass stimulating electrodes filled with extracellular saline were placed in the stratum radiatum. Long‐term synaptic modification was induced with 10 bursts of 10 shocks at 5, 10 or 100 Hz (Dudek & Bear, 1992). This procedure was slightly modified for 3 Hz stimulation (90 bursts of 10 shocks).
Data analysis
Apparent input resistance was determined by linearly fitting the voltage deflections induced by negative current pulses. Capacitance was calculated by exponential fitting of the voltage deflection (y = A*(1 − e− t / τ)) in the presence of ZD‐7288 using LabVIEW 10.0 (National Instruments, Austin, TX, USA). The gain in the input‐output curves was calculated on each cell by fitting the linear part of the curve. The I h was characterized by comparing hyperpolarization‐induced currents obtained in control conditions with those obtained in the presence of 10 μm ZD‐7288. Activation was assessed by voltage steps from a holding potential of −50 mV to −60 ‐ −120 mV. Subtraction of control records from those obtained after ZD‐7288 application allowed isolation of I h. Conductance was determined by G h = I h/(V – E h) with E h = −37.7 mV (E h is the reversal potential for I h; Campanac et al. 2008). Spontaneous depolarizing activity was assessed by measuring EPSP area from the resting membrane potential with a semi‐automatic procedure in which a horizontal cursor was adjusted on each trial to define the baseline.
Pooled data are presented as means ± SEM. Statistical comparisons were made using Mann–Whitney or Wilcoxon tests with SigmaPlot software (Systat Software Inc., San Jose, CA, USA).
Drugs
Kynurenate (Kyn, 2 mm) and picrotoxin (PiTx, 50 μm) were added to the culture medium 48–72 h before recording. Kynurenate and picrotoxin were purchased from Sigma (St. Louis, MO, USA), and ZD‐7288 was obtained from Tocris Bioscience (Bristol, UK).
Results
Homeostatic regulation of intrinsic neuronal excitability in CA1 pyramidal neurons
The effect of chronic hyper‐ or hypoactivity on the excitability of CA1 pyramidal neurons was assessed in organotypic slice cultures of rat hippocampus. Cultures were treated for 48–72 h with either 2 mm Kyn (Kyn‐treated), 50 μm PiTx (PiTx‐treated) or with control medium (Control). Acutely applied, these treatments blocked or increased spontaneous excitatory activity. Spontaneous activity was quantified in control and treated cultures by measuring the net area of excitatory synaptic activity. In fact, spontaneous depolarizing synaptic activity measured in CA1 pyramidal neurons was considerably reduced in the presence of Kyn (15 ± 5% of the control EPSP area, n = 7; P < 0.001), indicating that it was mediated by AMPA and NMDA receptors (Fig. 1 A and B). In contrast, spontaneous depolarizing activity was augmented in the presence of PiTx and epileptiform bursting could be observed (760 ± 167% of the control depolarizing area, n = 6; P < 0.001; Fig. 1 A and B).
Figure 1. Bidirectional homeostatic changes in excitability after chronic alteration of activity .
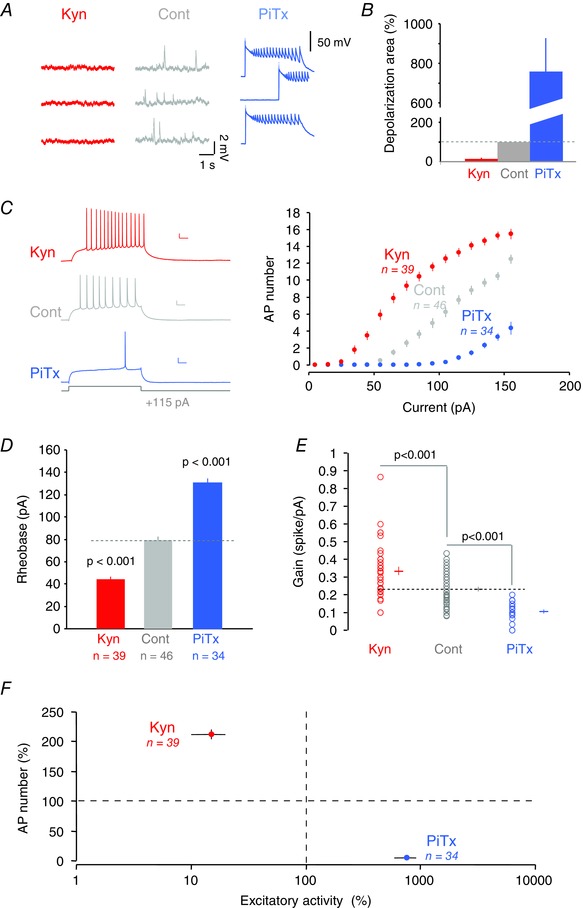
A, spontaneous activity recorded in a control neuron (Cont, grey), a kynurenate‐treated neuron (Kyn, red) and a picrotoxin‐treated neuron (PiTx, blue). B, quantification of the net area of postsynaptic activity for each condition. C, intrinsic neuronal excitability measured in each condition. Left, individual traces for a depolarizing current pulse of 115 pA. Right, input–output curves for each condition showing the number of action potentials as a function of the injected current. Calibration bars, 200 ms, 20 mV. D, rheobase for each condition. E, comparison of the gain, measured as the slope of the input–output curve, in each condition. F, graph indicating the normalized spike number as a function of spontaneous excitatory activity induced by Kyn or PiTx treatments. The homeostatic regulation of excitability is indicated by both the decreased excitability when activity is increased by PiTx treatment and the increased excitability when activity is reduced by Kyn treatment.
Depolarizing current pulses (800 ms, 15–155 pA) were injected in the cell body of CA1 pyramidal neurons to compare intrinsic excitability of CA1 pyramidal cells in chronically treated cultures (Fig. 1 C). In fact, the minimal current eliciting an action potential (i.e. rheobase) was reduced in Kyn‐treated neurons (from 79 ± 3 pA, n = 46 in control neurons to 44 ± 2 pA, n = 39, Mann–Whitney, P < 0.001) but enhanced in PiTx‐treated cells (130 ± 5 pA, n = 34, Mann–Whitney, P < 0.001; Fig. 1 D). In addition, the gain of the input–output curves was enhanced in Kyn‐treated neurons (from 0.23 ± 0.01 spikes pA−1, n = 46 in control neurons to 0.34 ± 0.02 spikes pA−1, n = 39; Mann–Whitney, P < 0.001; Fig. 1 E) but reduced in PiTx‐treated cells (0.10 ± 0.01 spikes pA−1, n = 34). All the measurements were performed at comparable membrane potential (−65.0 ± 0.3 mV, n = 39 in control cultures, −64.6 ± 0.4 mV, n = 46 in Kyn‐treated cultures and −64.2 ± 0.4 mV, n = 34 in PiTx cultures, Mann–Whitney U test, P > 0.05 in all cases). The holding current was comparable in the three conditions (−0.3 ± 1.9 pA in control cultures, −5.0 ± 2.0 pA in Kyn‐treated neurons, and −1.0 ± 1.5 pA in PiTx‐treated cultures; Mann–Whitney U test, P > 0.1 in all cases). The resting membrane potential (no holding current) has been measured in a subset of neurons. No difference was observed across categories (−65.3 ± 0.5 mV (n = 19) in control neurons, −64.3 ± 0.5 mV (n = 16) in Kyn‐treated neurons and −65.0 ± 0.6 mV (n = 17) in PiTx‐treated neurons; P > 0.1). In conclusion, changes in intrinsic excitability are negatively correlated with the variation in excitatory activity imposed during chronic treatments (Fig. 1 F).
Bidirectional changes in apparent input resistance
In order to evaluate whether I h was regulated, we also measured the apparent input resistance (R in) with hyperpolarizing current pulses (800 ms, −5 to −155 pA) injected in the soma. Apparent R in was calculated for each neuron as the linear slope of the voltage shift induced by each value of hyperpolarizing current. In PiTx‐treated cultures, apparent R in was found to be reduced (193 ± 6 MΩ in control, n = 50, vs. 154 ± 6 MΩ in PiTx‐treated cultures, n = 41, Mann–Whitney U test, P < 0.001; Fig. 2 A) but increased in Kyn‐treated cultures (240 ± 6 MΩ in Kyn‐treated cultures, n = 53, Mann–Whitney U test, P < 0.001; Fig. 2 A). These variations in input resistance were strongly reduced when I h was blocked with the h‐channel blocker ZD‐7288 (289 ± 14 MΩ, n = 26 in control neurons, 277 ± 9 MΩ, n = 21 in PiTx‐treated neurons, Mann–Whitney, P > 0.1, and 331 ± 15 MΩ, n = 24 in Kyn‐treated neurons, Mann–Whitney, P > 0.01; Fig. 2 B), indicating that the observed differences in input resistance mostly result from the bidirectional regulation of h‐channels. Nevertheless, there were still substantial changes present after h‐channel block, suggesting that another conductance might be regulated in parallel. In addition, the membrane capacitance measured in the presence of ZD‐7288 showed no change in control vs. Kyn‐treated and PiTx‐treated cultures (220 ± 14 pF, n = 27, in control neurons; 224 ± 11 pF, n = 22, in Kyn‐treated neurons, Mann–Whitney, P > 0.1; 220 ± 9 pF, n = 21, in PiTx‐treated neurons, Mann–Whitney, P > 0.1; Fig. 2 C).
Figure 2. Bidirectional regulation of apparent Rin .
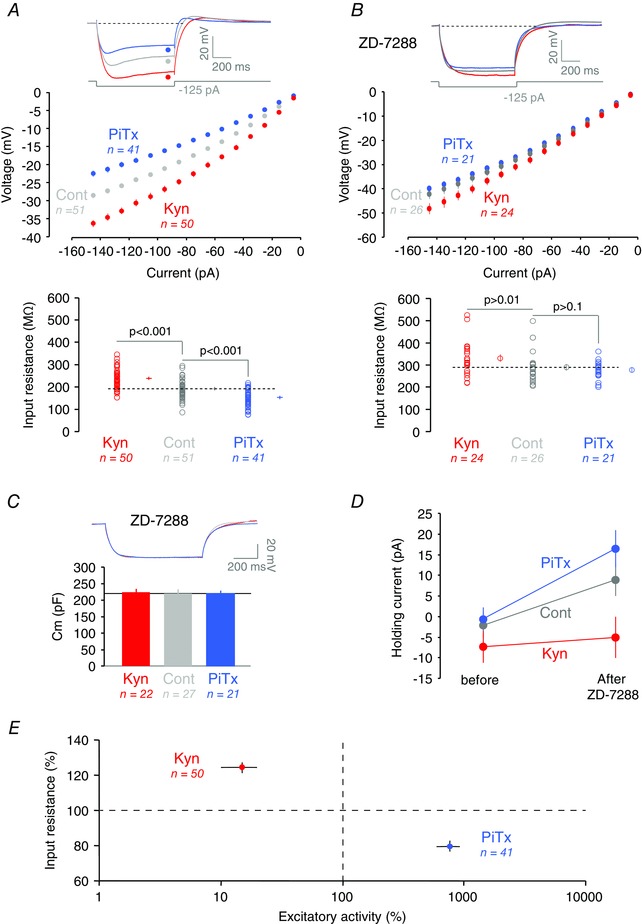
A, input resistance in control, Kyn‐ and PiTx‐treated CA1 neurons. Top, individual traces for a hyperpolarization of −125 pA for each condition (Cont, grey; PiTx, blue; Kyn, red). Middle, voltage measured at the steady‐state phase of the hyperpolarization as a function of the current injected for each condition. Bottom, input resistance for each condition, measured by fitting. Membrane potential: −64.8 ± 0.3 mV, n = 51 in control neurons; −64.3 ± 0.3 mV, n = 50 in Kyn‐treated neurons and −64.1 ± 0.4, n = 41 in PiTx‐treated cells (P > 0.1 for all comparisons). B, R in in the presence of ZD‐7288 (10 μm). Membrane potential: −65.0 ± 0.6 mV, n = 26 in control; −64.5 ± 0.5 mV, n = 24 in Kyn; −63.3 ± 0.5, n = 21 in PiTx (P > 0.05 for all). C, effects of chronic treatments on membrane capacitance. Top, representative traces. Bottom, quantitative data. D, holding current injected to maintain the pyramidal neurons at a resting potential of −65 mV before and after ZD‐7288 application for each condition. E, normalized input resistance as a function of spontaneous excitatory activity. The homeostatic regulation of input resistance is indicated by both the decreased R in when activity is increased by PiTx treatment and the increased R in when activity is reduced by Kyn treatment.
In CA1 pyramidal neurons, I h not only determines apparent R in but also resting membrane potential. All these pharmacological experiments were performed while membrane potential was kept constant (−65 mV, P > 0.2). However, consistent with the differential regulation of h‐current, the amount of holding current applied to maintain the neuron at constant potential is not significantly changed in Kyn‐treated neurons after application of ZD‐7288, whereas it is superior to the control increase in PiTx‐treated neurons (from −2 ± 3 pA to 9 ± 4 pA, n = 25, in control neurons, Mann–Whitney, P = 0.021; from −7 ± 4 pA to −5 ± 5 pA, n = 23, in Kyn‐treated neurons, Mann–Whitney, P > 0.1; from −0.6 ± 3 pA to 17 ± 5 pA, n = 20, in PiTx‐treated neurons, Mann–Whitney, P < 0.001; Fig. 2 D). In conclusion, as for intrinsic neuronal excitability, changes in apparent R in are negatively correlated with changes in excitatory activity (Fig. 2 E).
Bidirectional changes in I h
In order to further confirm the differential contribution of I h after each treatment, the gain in apparent R in due to ZD‐7288 (10 μm) was compared in each condition. In these experiments, the initial voltage deflection measured in the soma was set to a constant value (−18.9 ± 0.07 mV) in order to activate the same amount of I h in the three conditions. As expected, the increased apparent conductance induced by ZD‐7288 was small in Kyn‐treated neurons (135 ± 7%, n = 28, vs. 160 ± 9%, n = 30, in control neurons, Mann–Whitney, P < 0.1; Fig. 3 A) but large in PiTx‐treated neurons (177 ± 7%, n = 25, Mann–Whitney, P < 0.1; Fig. 3 A).
Figure 3. Bidirectional regulation of h‐current .
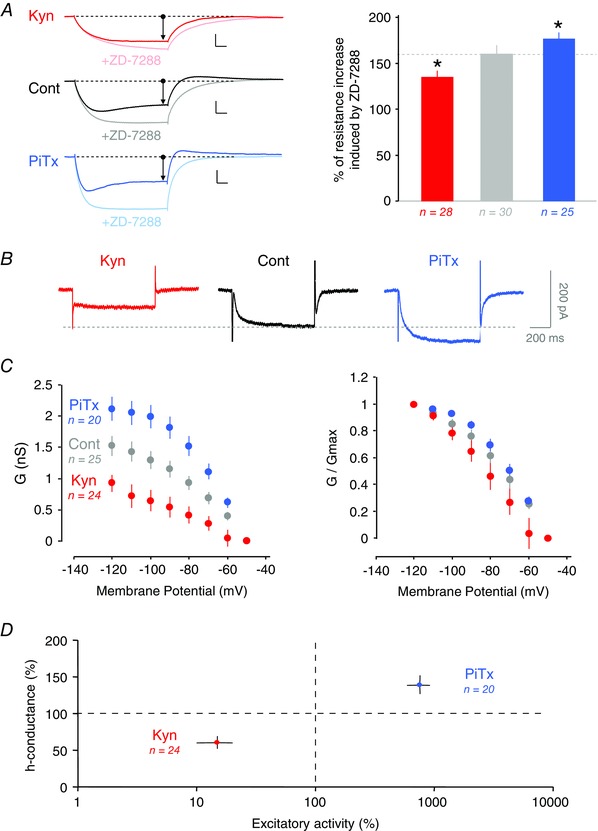
A, effects of ZD‐7288 on input resistance in Kyn‐ and PiTx‐treated neurons. Left, individual traces before and after ZD‐7288 application for each condition. The initial input resistance is identical for each condition. Right, percentage of input resistance increase after ZD‐7288 application. Membrane potential before ZD‐7288: −64.7 ± 0.4 mV in control, −64.2 ± 0.4 mV in Kyn‐ and −64.0 ± 0.4 mV in PiTx‐treated neurons (P > 0.1 for all). Membrane potential after ZD‐7288: −65.3 ± 0.6 mV in control, −64.3 ± 0.5 in Kyn‐ and −64.5 ± 0.6 in PiTx‐treated neurons (P > 0.1 for all comparisons). B, voltage‐clamp recording of h‐current in each condition. These traces were obtained by subtracting from control traces recorded after ZD‐7288 application to the control ones. C, activation curve of h‐current. Left, differences in the maximal conductance of I h are observed between each condition. Right, normalized conductance allowed no changes to be seen in the biophysical properties of activation. D, h‐conductance as a function of spontaneous excitatory activity. Note the increased h‐conductance when activity is increased by PiTx treatment and the decreased h‐conductance when activity is reduced by Kyn treatment.
Next, the biophysical properties of I h were tested in the three conditions. CA1 pyramidal neurons were recorded in voltage clamp and negative steps of voltage (to −60 ‐ −120 mV) were applied from a holding potential of −50 mV. The ZD‐7288‐sensitive maximal conductance was found to be reduced by ∼40% in Kyn‐treated neurons (1.5 ± 0.2 nS, n = 25, in control neurons vs. 0.9 ± 0.1 nS, n = 24, in Kyn‐treated neurons, Mann–Whitney, P < 0.01; Fig. 3 B and C) but increased by ∼40% in PiTx‐treated neurons (2.1 ± 0.2 nS, n = 20, Mann–Whitney, P < 0.01; Fig. 3 B and C). Activation curves remained unchanged, however (Fig. 3 C), indicating that the regulation of I h cannot be explained by alteration in its voltage dependence. In conclusion, changes in maximal h‐conductance are positively correlated with the changes in excitatory activity induced by the kynurenate and picrotoxin treatments (Fig. 3 D).
I h is implicated in excitability changes
We next examined the specific contribution of I h regulation to intrinsic neuronal excitability. Blocking I h with ZD‐7288 increased intrinsic excitability in control cultures (Fig. 4 A), reducing the rheobase from 89 ± 5 pA to 67 ± 6 pA (n = 19, Wilcoxon, P < 0.001). Consistent with a weak h‐conductance in Kyn‐treated neurons, no significant changes in intrinsic excitability were observed in the presence of ZD‐7288 (rheobase from 46 ± 2 pA to 45 ± 4 pA, n = 14, Wilcoxon, P > 0.1; Fig. 4 B). In contrast, ZD‐7288 application strongly increased the intrinsic excitability in PiTx‐treated neurons (rheobase from 131 ± 8 pA to 80 ± 8 pA, n = 10, Wilcoxon, P < 0.01; Fig. 4 C). These data indicate that a significant portion of the change in excitability results from the bidirectional regulation of I h. In fact, the difference between the three input–output curves was strongly diminished in the presence of ZD‐7288 (Fig. 4 D). However, the difference was not totally abolished, indicating that in parallel to the bidirectional regulation of the h‐current other conductances might be involved.
Figure 4. Role of Ih in the homeostatic regulation of cell excitability .
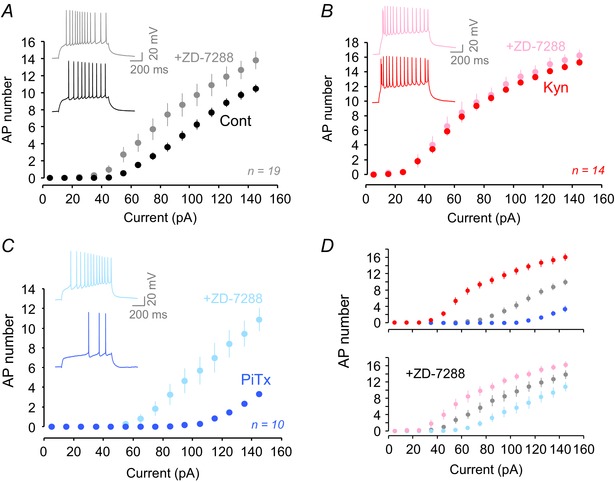
A, number of action potentials fired for each current injection before and after ZD‐7288 application in control neurons. Inset, representative traces. Membrane potential before ZD‐7288: −65.2 ± 0.4 mV in control, −63.9 ± 0. 5 mV in Kyn‐ and −63.3 ± 0.6 mV in PiTx‐treated neurons (P > 0.01 for all comparisons). Membrane potential after ZD‐7288: −65.5 ± 0.7 mV in control, −64.7 ± 0.6 mV in Kyn‐ and −63.6 ± 0.5 mV in PiTx‐treated neurons (P > 0.05 for all comparisons). B, as in A with Kyn‐treated neurons. C, as in A with PiTx‐treated neurons. D, ZD‐7288 application reduced the divergence of the input–output curves (top, before ZD‐7288; bottom, after ZD‐7288).
Homeostatic regulation of I h determines synaptic waveform and EPSP summation
We next determined the consequence of bidirectional regulation of I h on synaptic integration and EPSP summation. In a first step, we compared the EPSP waveform recorded extracellularly in the dendrites of CA1 pyramidal neurons in control, Kyn‐ and PiTx‐treated cultures. The experiments were performed in the presence of PiTx (100 μm) to block GABAA receptor‐mediated inhibition. The EPSP half‐width measured extracellularly was significantly broader in Kyn‐treated cultures compared to control and PiTx‐treated cultures (3.6 ± 0.6 ms, n = 9 in Kyn‐treated cultures vs. 2.4 ± 0.6 ms, n = 8 in control, P = 0.075 Mann–Whitney U test and 1.2 ± 0.2 ms, n = 9 in PiTx‐treated cultures, P < 0.001 Mann–Whitney U test; Fig. 5 A). To determine whether these differential effects resulted from a change in the waveform of glutamatergic synaptic currents or from the shaping of these currents by voltage‐gated conductances downstream from the synapse, synaptic‐like current was injected in the soma and the kinetics of the resulting simulated EPSP was compared among treatments. Confirming previous results obtained with biological field EPSPs, simulated intracellular EPSPs displayed significantly different time courses. Compared to controls, EPSPs were broader in Kyn‐treated CA1 neurons but faster in PiTx‐treated neurons (half‐width: 50 ± 2 ms in control cultures, n = 22, vs. 65 ± 3 ms in Kyn‐treated cultures, n = 28, P < 0.001, Mann–Whitney U test and 43 ± 2 ms in PiTx‐treated cultures, n = 24, P < 0.01, Mann–Whitney U test; Fig. 5 B).
Figure 5. EPSP waveform and EPSP summation is altered after homeostatic regulation of Ih .
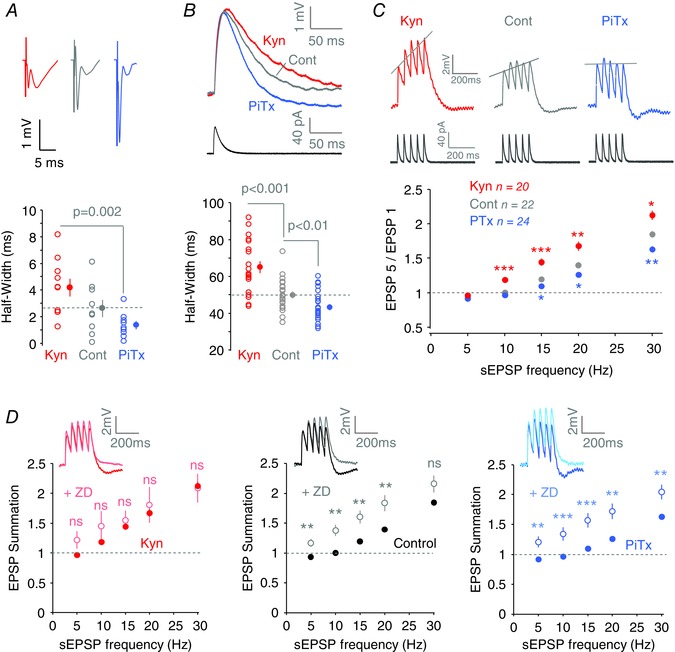
A, changes in field EPSP waveform after each treatment. Top, representative fEPSP evoked by stimulation of the Schaffer collaterals. Bottom, quantification of fEPSP half‐width for each treatment. B, simulated EPSPs generated by the injection of a simulated synaptic current in CA1 pyramidal neurons recorded in whole‐cell configuration. C, EPSP summation of simulated trains of EPSPs at 20 Hz for each condition. Top, representative traces. Bottom, quantification of the summation by normalizing the fifth EPSP to the first. D, differential EPSP summation before and after ZD‐7288 application for each condition. Representative traces for EPSP trains at 20 Hz before and after ZD‐7288 application. Note the maximal effect for PiTx‐treated neurons and the minimal effect for Kyn‐treated neurons.
Next, temporal summation of simulated EPSPs (5–30 Hz) was tested in CA1 pyramidal neurons recorded in the three experimental conditions. Compared to control neurons, EPSP summation was found to significantly increase in Kyn‐treated neurons at 10, 15, 20 and 30 Hz, whereas a significant loss in EPSP summation was obtained in PiTx‐treated neurons at 15, 20 and 30 Hz (Fig. 5 C). These differential changes in EPSP summation most likely resulted from the regulation of I h. To test this hypothesis, we compared the effect of blocking I h with ZD‐7288 in neurons in the three conditions. ZD‐7288 induced a significant increase in EPSP summation in hyperactive neurons (PiTx‐treated) but no significant change in hypoactive cells (Kyn‐treated, Fig. 5 D), thus confirming the major contribution of I h in the differential regulation of EPSP summation.
Homeostatic regulation of I h and induction of long‐term synaptic modification
Because homeostatic regulation of I h largely affects EPSP summation, we next wondered what could be the consequence of this regulation on synaptic plasticity induced with repetitive stimulation of excitatory inputs. The Schaffer collaterals were stimulated at 10 Hz, a critical frequency for the induction of long‐term synaptic modification (Dudek & Bear, 1992). Surprisingly, no significant change in synaptic plasticity was observed among treatments (changes in EPSP slope measured 10–30 min after 10 Hz stimulation: 128 ± 10% of the control field EPSP (fEPSP) slope, n = 10 in Kyn‐treated neurons, 133 ± 21%, n = 9 in control neurons and 128 ± 10%, n = 9 in PiTx‐treated cells; P > 0.1 for all comparisons; Fig. 6 A, left and Fig. 6 C, left). However, blocking h‐channels in the same experiments with ZD‐7288 (1 μm) induced differential plasticity in PiTx neurons (145 ± 29%, n = 8 in PiTx‐treated cells vs. 93 ± 11%, n = 9 in Kyn‐treated cells, and 102 ± 8%, n = 9 in control; Fig. 6 A, right). The use of ZD‐7288 at 1 μm does not directly affect the synaptic transmission (Gastrein et al. 2011). To avoid any saturating effect of two sequential synaptic plasticity inductions, we directly applied ZD‐7288 on naive cultures and stimulated the Schaffer collaterals at 10 Hz. Significant long‐term synaptic potentiation was observed in PiTx‐treated cells compared to control or Kyn‐treated neurons (146 ± 12%, n = 8 in PiTx‐treated cells vs. 94 ± 7%, n = 8, P = 0.002 Mann–Whitney U test, in Kyn‐treated cells, and 106 ± 6%, n = 7, P = 0.02, in control cells; Fig. 6 B and C, right). The effects of Schaffer collateral stimulation at 3, 5 and 100 Hz was also tested in control, Kyn‐treated and PiTx‐treated cultures in the absence or in the presence of ZD‐7288 (Fig. 6 D). Confirming our results, in the presence of I h (control condition), the level of plasticity was found to be similar across treatments (Fig. 6 D, left). In contrast, blocking h‐channels with ZD‐7288 unmasked a differential potentiation in PiTx‐treated cultures at 3 and 5 Hz but not at 100 Hz (Fig. 6 D, right). It is well established that ZD‐7288 induces a hyperpolarization of the membrane potential that cannot be controlled in field potential recording. This hyperpolarization may interfere with LTP induction. We therefore explored the effects of 10 Hz stimulation in whole‐cell recordings. In fact, blocking h‐channels with ZD‐7288 had virtually no effect on LTP in Kyn‐treated neurons (141 ± 24%, n = 8 in control and 142 ± 11%, n = 6 in ZD‐7288; P > 0.1 Mann–Whitney test) but increased LTP in PiTx‐treated neurons (from 123 ± 15%, n = 10 to 176 ± 36%, n = 7; P < 0.05 Mann–Whitney test; Fig. 6 E).
Figure 6. Homeostatic regulation of Ih stabilizes induction of long‐term synaptic modification .

A, induction of synaptic modification by 10 Hz stimulation. Left: time course of fEPSP slope before and after 10 Hz stimulation of synaptic afferents for each condition. Note the similar level of plasticity in each case. Right: time course of fEPSP slope before and after a second 10 Hz stimulation in the presence of ZD‐7288 application (1 μm). Note the selective induction of LTP in PiTx‐treated neurons. Top: representative examples of fEPSP slope changes for each condition before (light trace) and after (dark trace) 10 Hz stimulation (scale bars 0.1 mV, 0.5 ms). B, time course of fEPSP slope before and after 10 Hz stimulation of synaptic afferents for each condition in the presence of ZD‐7288 application (1 μm) in the same slices. Note the selective induction of LTP in PiTx‐treated cells. Top: representative examples of fEPSP slope changes for each condition before (light trace) and after (dark trace) 10 Hz stimulation (scale bars 0.1 mV, 0.5 ms). C, quantification of synaptic modification. Left, bar graph of fEPSP slope modifications after 10 Hz stimulation in the presence of ZD‐7288. Right, quantification of fEPSP slope modifications after 10 Hz stimulation. D, BCM curves in control and in the presence of ZD‐7288 for control, PiTx‐ and Kyn‐treated neurons. E, LTP induced by 10 Hz stimulation in whole‐cell configuration with or without functional h‐channels. Note the similar level of LTP for Kyn‐treated neurons but the differential effect for PiTx‐treated neurons. F, comparison of the ratio of fEPSP slope to presynaptic volley for each condition. Left, representative fEPSP for each condition. Note the difference in the volley amplitude compared to the fEPSP size. Right, plot of the fEPSP slope normalized to the presynaptic volley amplitude for each condition.
We then examined the possible origin of this differential plasticity. A major determinant of the magnitude of long‐term synaptic modification is the initial strength of the synapse (Debanne et al. 1999) and homeostatic treatments are known to modify AMPA receptor accumulation at the synapse (O'Brien et al. 1998). In fact, the amplitude of the AMPA receptor‐mediated component normalized to the presynaptic volley was very low in PiTx‐treated cultures but high in Kyn‐treated ones (0.39 ± 0.12, n = 8 in PiTx vs. 0.93 ± 0.28, n = 7 in control and 1.31 ± 0.28, n = 8 in Kyn‐treated cultures; Fig. 6 D), suggesting that low levels of AMPA receptors are expressed in synapses of PiTx‐treated cultures whereas higher levels of AMPA receptors are found in synapses of Kyn‐treated neurons.
Altogether, these data suggest that chronic network hyperactivity induced by PiTx causes a synaptic rearrangement which favours induction of long‐term synaptic potentiation. Thus, homeostatic regulation of h‐channels stabilizes the induction of synaptic plasticity by compensating the homeostatic propensity of glutamatergic synapses to express long‐term modification.
Discussion
I h is a major determinant of input resistance, resting membrane potential, EPSP summation and intrinsic neuronal excitability in CA1 pyramidal neurons (Maccaferri et al. 1993; Magee, 1998, 1999; Poolos et al. 2002). It is naturally an important factor in the activity‐dependent regulation of intrinsic neuronal excitability. We show here that chronic manipulations of network activity induced homeostatic regulation of intrinsic neuronal excitability in CA1 pyramidal neurons. This plasticity is associated with the regulation of h‐channel activity. h‐conductance was found to be down‐regulated after chronic hypoactivity (Kyn treatment), thus enhancing both input resistance and intrinsic excitability. In contrast, maximal h‐conductance was up‐regulated after chronic hyperactivity induced by the GABAA receptor antagonist picrotoxin, subsequently decreasing both apparent input resistance and intrinsic neuronal excitability. We also showed that homeostatic regulation of I h controls the induction of long‐term synaptic modification and counteracts the propensity of synapses to undergo variable levels of synaptic plasticity. Thus, our results indicate that I h is a key factor in the homeostatic regulation of intrinsic neuronal excitability in hippocampal neurons and normalizes induction of synaptic plasticity.
Activity deprivation causes homeostatic regulation of I h in CA1 pyramidal neurons
We report here a 40% decrease in h‐conductance in CA1 pyramidal neurons after activity deprivation induced by chronic blockade of ionotropic glutamate receptors with kynurenate for 48–72 h. The down‐regulation of h‐conductance caused homeostatic increases in apparent input resistance, intrinsic neuronal excitability and EPSP summation. All these changes result from the biophysical properties of I h. Input resistance tested with hyperpolarizing pulses of current is controlled by the activation of h‐channels causing a depolarization and subsequently a reduction in apparent input resistance. Since h‐channels are open at resting membrane potential, they produce a constant depolarizing current. Any depolarization will deactivate I h, therefore producing a hyperpolarization. Thus, I h attenuates both EPSPs and depolarization induced by depolarizing current steps. Therefore the enhanced intrinsic excitability observed in our experiments is totally consistent with the homeostatic down‐regulation of I h.
Regulation of h‐channel localization has been previously reported in hippocampal slice cultures following activity deprivation for 48 h with the voltage‐dependent sodium (Nav) channel blocker TTX, the AMPA receptor antagonist CNQX, or the NMDA receptor antagonist d‐APV (Shin & Chetkovich, 2007). In particular, the gradient of h‐channels along the apical dendrites of CA1 pyramidal neurons was lost after chronic reduction of excitatory synaptic drive. However, the functional consequence was not characterized. Our data are totally compatible with the reorganization of h‐channels reported by Shin & Chetkovich (2007). In fact, the reduced maximal conductance together with the lack of change in activation voltage fits well with a reduced number of functional channels at the membrane. A reduction in the number of HCN1, a subunit of h‐channels, has been reported after chronic activity deprivation induced by TTX (Arimitsu et al. 2009). In addition to the reduction in the total expression of h‐channels, the expression of h‐channels at the plasma membrane might be highly regulated. In fact, several isoforms of the h‐channel auxiliary subunit TRIP8b also control the expression of HCN subunits at the membrane of CA1 pyramidal neurons (Santoro et al. 2009).
Induction of a large synaptic depression (long‐term depression, LTD) has been shown to down‐regulate h‐channel activity in CA1 pyramidal neurons (Brager & Johnston, 2007). This regulation requires the activation of metabotropic glutamate receptor 1 (mGluR1) and protein kinase C. Although the induction mechanisms might be different from those responsible for the homeostatic regulation produced by chronic activity deprivation, it should be underlined that both correspond to a massive reduction in excitatory synaptic drive to CA1 pyramidal neurons, suggesting the existence of common homeostatic rules for the regulation of h‐channel activity.
The homeostatic regulation of h‐channels plays a major role in the increased intrinsic neuronal excitability observed after chronic activity deprivation. In the presence of the h‐channel blocker ZD‐7288 the difference between control and Kyn‐treated neurons is reduced but not totally eliminated (Fig. 4 D). This suggests that other voltage‐gated conductances might be also regulated in parallel. In fact, chronic activity deprivation up‐regulates the Na+ current in neocortical neurons (Desai et al. 1999) and increases the number of Nav channels in the CA3 area (Aptowicz et al. 2004). In addition, kynurenate treatment down‐regulates voltage‐gated K+ channel Kv1 activity in CA3 neurons (Cudmore et al. 2010). Chronic hyperactivity also enhances barium‐sensitive leak potassium conductance in hippocampal neurons (O'Leary et al. 2010). Thus, although the modulation of h‐channels is a major component in the homeostatic regulation of CA1 excitability, co‐regulation of other voltage‐gated conductances may occur in parallel (Marder & Goaillard, 2006). These regulations could be responsible for the remaining differences between the conditions after I h blockade, as well as the lack of effect on the resting membrane potential upon I h decrease.
Epileptiform activity induces up‐regulation of I h in CA1 pyramidal neurons
Our study indicates that the h‐conductance is enhanced following epileptiform bursting produced by the GABAA receptor antagonist picrotoxin. This facilitation contributes to dampen apparent input resistance, intrinsic neuronal excitability and EPSP summation. Here again, the maximal h‐conductance was found to be enhanced by ∼40% and the voltage‐dependent activation of the current was found to be unchanged. Our data are compatible with previous findings showing that in young rats, hyperthermia‐induced seizures produced an up‐regulation of I h in CA1 neurons (Chen et al. 2001). In contrast with our findings, this study reported a significant shift in the activation of I h. In adult rats, a reduction in I h was reported in entorhinal neurons after induction of status epilepticus (Shah et al. 2004), indicating that regulation of h‐channels by epileptiform activity might be more complex. The homeostatic regulation of I h reported here may determine the level of functional h‐current in vivo. In fact, intrinsically bursting neurons display a larger h‐current compared to regular spiking cells (van Welie et al. 2006).
The mechanisms underlying the up‐regulation of h‐channel activity by glutamatergic synaptic activity are complex and require AMPA receptor activation and postsynaptic calcium elevation (van Welie et al. 2004). In addition, h‐channel trafficking at the membrane can be up‐regulated by several isoforms of the auxiliary subunit TRIP8b expressed in the CA1 region (Santoro et al. 2009). Furthermore, the mobility of HCN1 subunits is highly regulated by stimulation of glutamatergic receptors (Noam et al. 2010). It will be important to determine how neuronal or synaptic activity modulates expression of specific TRIP8b subunits in CA1 pyramidal neurons.
Induction of a large synaptic potentiation (LTP) has been shown to up‐regulate h‐channel activity in CA1 pyramidal neurons (Fan et al. 2005; Campanac et al. 2008). This regulation requires the activation of NMDA receptors and the calcium/calmodulin protein kinase II (Fan et al. 2005). Although the induction mechanisms might be different from those responsible for the homeostatic regulation produced by chronic hyperactivity, it should be noted that both correspond to a massive increase in excitatory synaptic drive to CA1 pyramidal neurons, suggesting the existence of common homeostatic rules for regulation of h‐channel activity.
The homeostatic regulation of I h plays a major role in the decreased excitability observed after chronic epileptiform bursting. First, the h‐channel blocker ZD‐7288 induced a robust increase in the excitability of neurons treated for 48 h with PiTx (Fig. 4 C). However, the gap between control and PiTx‐treated neurons was not totally filled in the presence of ZD‐7288, indicating that other channels might be also regulated. In fact, Kv2.1 channels mediating the delayed rectifier potassium current are located in the perisomatic region of hippocampal neurons. They are upregulated after epileptiform activity and also contribute to the reduction in intrinsic excitability (Misonou et al. 2004).
I h controls resting membrane potential in CA1 neurons. Yet, homeostatic regulation of I h was not associated with significant changes in membrane potential. This lack of effect could be the result of co‐regulated channels that also control membrane potential. For instance, the increase in h‐conductance induced by chronic hyperactivity should, in theory, depolarize the membrane potential. However, this depolarization could be compensated by the up‐regulation of the leak potassium current (Brickley et al. 2001). In fact, chronic hyperactivity augments by a factor of 2 the barium‐sensitive leak current, causing a hyperpolarization of the resting membrane potential (O'Leary et al. 2010). The stability of the resting membrane potential observed in our experiments can be considered as a homeostatic regulation aiming at maintaining neuronal excitability in a stable range.
Homeostatic regulation of I h and the modulation of long‐term synaptic modification
We show here that homeostatic regulation of the h‐channel might interfere with the induction of long‐term synaptic modification by stimulating the Schaffer collaterals at different frequencies (3–100 Hz). The frequency of 10 Hz is particularly interesting not only because it corresponds to the threshold between LTD and LTP in the Bienenstock–Cooper–Monroe (BCM) curve linking synaptic changes to stimulation frequency (Dudek & Bear, 1992), but also because at this frequency EPSP summation is significantly affected by I h (see Fig. 5).
In control conditions, the plasticity curves for control, Kyn‐ and PiTx‐treated cultures were virtually superimposed. When h‐channels are blocked with ZD‐7288, stimulation at 3, 5 and 10 Hz induced LTP that was larger in PiTx‐treated neurons compared to control or Kyn‐treated neurons. In contrast, no differential effect was observed across treatments in the presence of ZD‐7288 after 100 Hz stimulation, suggesting that h‐channels control the induction of synaptic modification in the low frequency range. Importantly, when the membrane potential was controlled and kept constant in whole‐cell recordings, LTP was selectively enhanced after blocking h‐channels in PiTx‐treated but not in Kyn‐treated neurons, thus confirming the results obtained in field potential.
Our data suggest that the propensity of CA3–CA1 synapses to express LTP is higher in PiTx‐treated cultures compared to control or Kyn‐treated cultures. We found that the ratio of the AMPA response to the presynaptic volley amplitude was significantly reduced in PiTx‐treated neurons compared to Kyn‐treated neurons, indicating that the number of AMPA receptors per synapse might be strongly regulated after chronic manipulation of network activity. The reduction in postsynaptic AMPA receptors has been observed in cortical neurons after chronic hyperactivity (Turrigiano et al. 1998). Moreover, the large facilitation observed in PiTx neurons expressing a reduced EPSP/volley ratio is compatible with previous findings indicating that the magnitude of LTP is maximal at hippocampal connections exhibiting small AMPA responses (Bi & Poo, 1998; Debanne et al. 1999).
Because AMPA receptors are known to be regulated by chronic activity (O'Brien et al. 1998; Turrigiano et al. 1998), we hypothesized that a strong internalization of AMPA receptors occurs during chronic treatment with PiTx, making glutamatergic synapses particularly prone to the expression of LTP (Fig. 7 A). However, this high potential for LTP expression in PiTx‐treated neurons can be revealed only if the dampening of EPSP summation by h‐current is blocked. Our results therefore point to the fact that homeostatic regulation of I h may compensate the considerable potential of glutamatergic synapse to express LTP and normalize the induction of long‐term synaptic modification (Fig. 7 B). Our data therefore suggest that in the absence of h‐channels, the BCM plasticity curve for PiTx‐treated neurons would be shifted in relation to that of Kyn‐treated neurons because of the differential content in AMPA receptors at dendritic spines (Fig. 7 C).
Figure 7. Interplay between regulation of Ih and synaptic plasticity: a hypothesis .
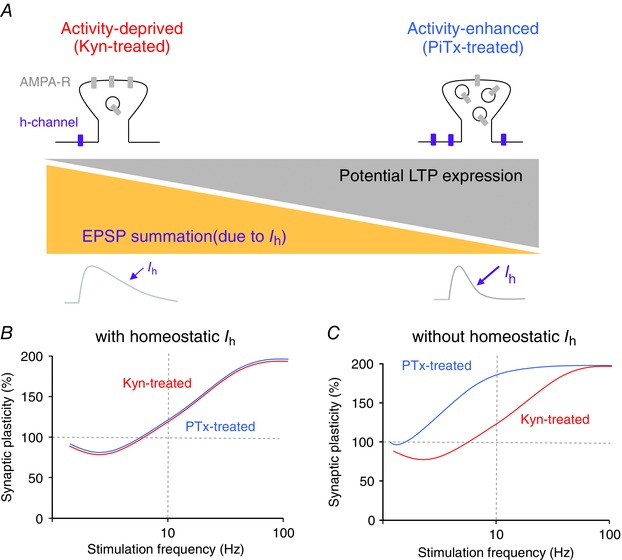
A, the homeostatic regulation of EPSP summation compensates for the different potential for LTP expression. Kyn‐treated dendritic spines (top left) express a large number of AMPA receptors but very few h‐channels. Their potential for LTP is small and the EPSP summation in the 3–10 Hz range is high. PiTx‐treated dendritic spines (top right) express very few AMPA receptors but a large number of h‐channels. Their potential for LTP is therefore high but EPSP summation at 10 Hz is low. B, BCM curves with homeostatic regulation of I h. Red curve, hypothetical curve obtained in Kyn‐treated neurons. Blue curve, hypothetical curve obtained in PiTx‐treated neurons. No difference is observed in each condition. C, BCM curves without homeostatic regulation. The curve obtained in PiTx‐treated neurons is shifted to the left and LTP induction is facilitated.
Homeostatic regulation of h‐channels appears therefore as a mechanism for regulating the sliding modification threshold of the BCM‐like learning rule of synaptic modification (Narayanan & Johnston, 2010). A similar modification of the synaptic plasticity induction threshold has already been observed following the regulation of ionic currents (Ramakers & Storm, 2002; Chen et al. 2006). Moreover, the homeostatic plasticity of intrinsic excitability observed here seems to play an essential metaplastic role in the homeostasis of synaptic plasticity.
Additional information
Competing interests
None declared.
Author contributions
C.G. and D.D. conceived the project. C.G. and Y.I. collected the data and C.G., Y.I. and D.D. analysed the data. C.G., Y.I. and D.D. drafted the manuscript. All authors approved the final version of the manuscript, agree to be accountable for all aspects of the work and all persons designated as authors qualify for authorship. All experiments were carried out in U1072, Marseille, France.
Funding
This work was supported by INSERM, CNRS, French Ministry of Research (doctoral grant to C.G.), Fondation Recherche Médicale (doctoral grant to C.G.), and Agence Nationale de la Recherche (doctoral grant to Y.I.).
Acknowledgements
We thank Norah Boumedine‐Guignon and Laure Fronzaroli‐Molinieres for excellent technical assistance, and Jean‐Marc Goaillard, Oussama El Far and Michael Seagar for helpful comments on the manuscript.
References
- Aptowicz CO, Kunkler PE & Kraig RP (2004). Homeostatic plasticity in hippocampal slice cultures involves changes in voltage‐gated Na+ channel expression. Brain Res 998, 155–163. [DOI] [PMC free article] [PubMed] [Google Scholar]
- Arimitsu T, Nuriya M, Ikeda K, Takahashi T & Yasui M (2009). Activity‐dependent regulation of HCN1 protein in cortical neurons. Biochem Biophys Res Commun 387, 87–91. [DOI] [PubMed] [Google Scholar]
- Bi GQ & Poo MM (1998). Synaptic modifications in cultured hippocampal neurons: dependence on spike timing, synaptic strength, and postsynaptic cell type. J Neurosci 18, 10464–10472. [DOI] [PMC free article] [PubMed] [Google Scholar]
- Boudkkazi S, Carlier E, Ankri N, Caillard O, Giraud P, Fronzaroli‐Molinieres L & Debanne D (2007). Release‐dependent variations in synaptic latency: a putative code for short‐ and long‐term synaptic dynamics. Neuron 56, 1048–1060. [DOI] [PubMed] [Google Scholar]
- Brager DH & Johnston D (2007). Plasticity of intrinsic excitability during long‐term depression is mediated through mGluR‐dependent changes in I h in hippocampal CA1 pyramidal neurons. J Neurosci 27, 13926–13937. [DOI] [PMC free article] [PubMed] [Google Scholar]
- Breton JD & Stuart GJ (2009). Loss of sensory input increases the intrinsic excitability of layer 5 pyramidal neurons in rat barrel cortex. J Physiol 587, 5107–5119. [DOI] [PMC free article] [PubMed] [Google Scholar]
- Brickley SG, Revilla V, Cull‐Candy SG, Wisden W & Farrant M (2001). Adaptive regulation of neuronal excitability by a voltage‐independent potassium conductance. Nature 409, 88–92. [DOI] [PubMed] [Google Scholar]
- Campanac E, Daoudal G, Ankri N & Debanne D (2008). Downregulation of dendritic I h in CA1 pyramidal neurons after LTP. J Neurosci 28, 8635–8643. [DOI] [PMC free article] [PubMed] [Google Scholar]
- Campanac E & Debanne D (2008). Spike timing‐dependent plasticity: a learning rule for dendritic integration in rat CA1 pyramidal neurons. J Physiol 586, 779–793. [DOI] [PMC free article] [PubMed] [Google Scholar]
- Campanac E, Gasselin C, Baude A, Rama S, Ankri N & Debanne D (2013). Enhanced intrinsic excitability in basket cells maintains excitatory‐inhibitory balance in hippocampal circuits. Neuron 77, 712–722. [DOI] [PubMed] [Google Scholar]
- Chen K, Aradi I, Thon N, Eghbal‐Ahmadi M, Baram TZ & Soltesz I (2001). Persistently modified h‐channels after complex febrile seizures convert the seizure‐induced enhancement of inhibition to hyperexcitability. Nat Med 7, 331–337. [DOI] [PMC free article] [PubMed] [Google Scholar]
- Chen X, Yuan LL, Zhao C, Birnbaum SG, Frick A, Jung WE, Schwarz TL, Sweatt JD & Johnston D (2006). Deletion of Kv4.2 gene eliminates dendritic A‐type K+ current and enhances induction of long‐term potentiation in hippocampal CA1 pyramidal neurons. J Neurosci 26, 12143–12151. [DOI] [PMC free article] [PubMed] [Google Scholar]
- Cudmore RH, Fronzaroli‐Molinieres L, Giraud P & Debanne D (2010). Spike‐time precision and network synchrony are controlled by the homeostatic regulation of the D‐type potassium current. J Neurosci 30, 12885–12895. [DOI] [PMC free article] [PubMed] [Google Scholar]
- Daoudal G, Hanada Y & Debanne D (2002). Bidirectional plasticity of excitatory postsynaptic potential (EPSP)‐spike coupling in CA1 hippocampal pyramidal neurons. Proc Natl Acad Sci USA 99, 14512–14517. [DOI] [PMC free article] [PubMed] [Google Scholar]
- Debanne D, Boudkkazi S, Campanac E, Cudmore RH, Giraud P, Fronzaroli‐Molinieres L, Carlier E & Caillard O (2008). Paired‐recordings from synaptically coupled cortical and hippocampal neurons in acute and cultured brain slices. Nat Protoc 3, 1559–1568. [DOI] [PubMed] [Google Scholar]
- Debanne D, Gahwiler BH & Thompson SM (1999). Heterogeneity of synaptic plasticity at unitary CA3‐CA1 and CA3‐CA3 connections in rat hippocampal slice cultures. J Neurosci 19, 10664–10671. [DOI] [PMC free article] [PubMed] [Google Scholar]
- Desai NS, Rutherford LC & Turrigiano GG (1999). Plasticity in the intrinsic excitability of cortical pyramidal neurons. Nat Neurosci 2, 515–520. [DOI] [PubMed] [Google Scholar]
- Dudek SM & Bear MF (1992). Homosynaptic long‐term depression in area CA1 of hippocampus and effects of N‐methyl‐d‐aspartate receptor blockade. Proc Natl Acad Sci USA 89, 4363–4367. [DOI] [PMC free article] [PubMed] [Google Scholar]
- Dyhrfjeld‐Johnsen J, Morgan RJ, Foldy C & Soltesz I (2008). Upregulated h‐current in hyperexcitable CA1 dendrites after febrile seizures. Front Cell Neurosci 2, 2. [DOI] [PMC free article] [PubMed] [Google Scholar]
- Fan Y, Fricker D, Brager DH, Chen X, Lu HC, Chitwood RA & Johnston D (2005). Activity‐dependent decrease of excitability in rat hippocampal neurons through increases in I h . Nat Neurosci 8, 1542–1551. [DOI] [PubMed] [Google Scholar]
- Gasparini S & DiFrancesco D (1997). Action of the hyperpolarization‐activated current (I h) blocker ZD 7288 in hippocampal CA1 neurons. Pflugers Arch 435, 99–106. [DOI] [PubMed] [Google Scholar]
- Gastrein P, Campanac E, Gasselin C, Cudmore RH, Bialowas A, Carlier E, Fronzaroli‐Molinieres L, Ankri N & Debanne D (2011). The role of hyperpolarization‐activated cationic current in spike‐time precision and intrinsic resonance in cortical neurons in vitro . J Physiol 589, 3753–3773. [DOI] [PMC free article] [PubMed] [Google Scholar]
- Karmarkar UR & Buonomano DV (2006). Different forms of homeostatic plasticity are engaged with distinct temporal profiles. Eur J Neurosci 23, 1575–1584. [DOI] [PubMed] [Google Scholar]
- Kirchheim F, Tinnes S, Haas CA, Stegen M & Wolfart J (2013). Regulation of action potential delays via voltage‐gated potassium Kv1.1 channels in dentate granule cells during hippocampal epilepsy. Front Cell Neurosci 7, 248. [DOI] [PMC free article] [PubMed] [Google Scholar]
- Maccaferri G, Mangoni M, Lazzari A & DiFrancesco D (1993). Properties of the hyperpolarization‐activated current in rat hippocampal CA1 pyramidal cells. J Neurophysiol 69, 2129–2136. [DOI] [PubMed] [Google Scholar]
- Magee JC (1998). Dendritic hyperpolarization‐activated currents modify the integrative properties of hippocampal CA1 pyramidal neurons. J Neurosci 18, 7613–7624. [DOI] [PMC free article] [PubMed] [Google Scholar]
- Magee JC (1999). Dendritic I h normalizes temporal summation in hippocampal CA1 neurons. Nat Neurosci 2, 508–514. [DOI] [PubMed] [Google Scholar]
- Marder E & Goaillard JM (2006). Variability, compensation and homeostasis in neuron and network function. Nat Rev Neurosci 7, 563–574. [DOI] [PubMed] [Google Scholar]
- Misonou H, Mohapatra DP, Park EW, Leung V, Zhen D, Misonou K, Anderson AE & Trimmer JS (2004). Regulation of ion channel localization and phosphorylation by neuronal activity. Nat Neurosci 7, 711–718. [DOI] [PubMed] [Google Scholar]
- Narayanan R & Johnston D (2010). The h current is a candidate mechanism for regulating the sliding modification threshold in a BCM‐like synaptic learning rule. J Neurophysiol 104, 1020–1033. [DOI] [PMC free article] [PubMed] [Google Scholar]
- Noam Y, Zha Q, Phan L, Wu RL, Chetkovich DM, Wadman WJ & Baram TZ (2010). Trafficking and surface expression of hyperpolarization‐activated cyclic nucleotide‐gated channels in hippocampal neurons. J Biol Chem 285, 14724–14736. [DOI] [PMC free article] [PubMed] [Google Scholar]
- Nolan MF, Malleret G, Dudman JT, Buhl DL, Santoro B, Gibbs E, Vronskaya S, Buzsaki G, Siegelbaum SA, Kandel ER & Morozov A (2004). A behavioral role for dendritic integration: HCN1 channels constrain spatial memory and plasticity at inputs to distal dendrites of CA1 pyramidal neurons. Cell 119, 719–732. [DOI] [PubMed] [Google Scholar]
- O'Brien RJ, Kamboj S, Ehlers MD, Rosen KR, Fischbach GD & Huganir RL (1998). Activity‐dependent modulation of synaptic AMPA receptor accumulation. Neuron 21, 1067–1078. [DOI] [PubMed] [Google Scholar]
- O'Leary T, van Rossum MC & Wyllie DJ (2010). Homeostasis of intrinsic excitability in hippocampal neurones: dynamics and mechanism of the response to chronic depolarization. J Physiol 588, 157–170. [DOI] [PMC free article] [PubMed] [Google Scholar]
- Poolos NP, Migliore M & Johnston D (2002). Pharmacological upregulation of h‐channels reduces the excitability of pyramidal neuron dendrites. Nat Neurosci 5, 767–774. [DOI] [PubMed] [Google Scholar]
- Ramakers GM & Storm JF (2002). A postsynaptic transient K+ current modulated by arachidonic acid regulates synaptic integration and threshold for LTP induction in hippocampal pyramidal cells. Proc Natl Acad Sci USA 99, 10144–10149. [DOI] [PMC free article] [PubMed] [Google Scholar]
- Santoro B, Piskorowski RA, Pian P, Hu L, Liu H & Siegelbaum SA (2009). TRIP8b splice variants form a family of auxiliary subunits that regulate gating and trafficking of HCN channels in the brain. Neuron 62, 802–813. [DOI] [PMC free article] [PubMed] [Google Scholar]
- Shah MM (2014). Cortical HCN channels: function, trafficking and plasticity. J Physiol 592, 2711–2719. [DOI] [PMC free article] [PubMed] [Google Scholar]
- Shah MM, Anderson AE, Leung V, Lin X & Johnston D (2004). Seizure‐induced plasticity of h channels in entorhinal cortical layer III pyramidal neurons. Neuron 44, 495–508. [DOI] [PMC free article] [PubMed] [Google Scholar]
- Shin M & Chetkovich DM (2007). Activity‐dependent regulation of h channel distribution in hippocampal CA1 pyramidal neurons. J Biol Chem 282, 33168–33180. [DOI] [PMC free article] [PubMed] [Google Scholar]
- Stoppini L, Buchs PA & Muller D (1991). A simple method for organotypic cultures of nervous tissue. J Neurosci Methods 37, 173–182. [DOI] [PubMed] [Google Scholar]
- Tsay D, Dudman JT & Siegelbaum SA (2007). HCN1 channels constrain synaptically evoked Ca2+ spikes in distal dendrites of CA1 pyramidal neurons. Neuron 56, 1076–1089. [DOI] [PMC free article] [PubMed] [Google Scholar]
- Turrigiano G (2011). Too many cooks? Intrinsic and synaptic homeostatic mechanisms in cortical circuit refinement. Annu Rev Neurosci 34, 89–103. [DOI] [PubMed] [Google Scholar]
- Turrigiano GG, Leslie KR, Desai NS, Rutherford LC & Nelson SB (1998). Activity‐dependent scaling of quantal amplitude in neocortical neurons. Nature 391, 892–896. [DOI] [PubMed] [Google Scholar]
- Turrigiano GG & Nelson SB (2004). Homeostatic plasticity in the developing nervous system. Nat Rev Neurosci 5, 97–107. [DOI] [PubMed] [Google Scholar]
- van Welie I, Remme MW, van Hooft JA & Wadman WJ (2006). Different levels of I h determine distinct temporal integration in bursting and regular‐spiking neurons in rat subiculum. J Physiol 576, 203–214. [DOI] [PMC free article] [PubMed] [Google Scholar]
- van Welie I, van Hooft JA & Wadman WJ (2004). Homeostatic scaling of neuronal excitability by synaptic modulation of somatic hyperpolarization‐activated I h channels. Proc Natl Acad Sci USA 101, 5123–5128. [DOI] [PMC free article] [PubMed] [Google Scholar]
- Wang Z, Xu NL, Wu CP, Duan S & Poo MM (2003). Bidirectional changes in spatial dendritic integration accompanying long‐term synaptic modifications. Neuron 37, 463–472. [DOI] [PubMed] [Google Scholar]