

Abstract
Key points
The hyperpolarization‐activated cation current I h is expressed in dopamine neurons of the substantia nigra, but the subcellular distribution of the current and its role in synaptic integration remain unknown.
We used cell‐attached patch recordings to determine the localization profile of I h along the somatodendritic axis of nigral dopamine neurons in slices from young rats.
I h density is higher in axon‐bearing dendrites, in a membrane area close to the axon origin, than in the soma and axon‐lacking dendrites.
Dual current‐clamp recordings revealed a similar contribution of I h to the waveform of single excitatory postsynaptic potentials throughout the somatodendritic domain.
The I h blocker ZD 7288 increased the temporal summation in all dendrites with a comparable effect in axon‐ and non‐axon dendrites.
The strategic position of I h in the proximity of the axon may influence importantly transitions between pacemaker and bursting activities and consequently the downstream release of dopamine.
Abstract
Dendrites of most neurons express voltage‐gated ion channels in their membrane. In combination with passive properties, active currents confer to dendrites a high computational potential. The hyperpolarization‐activated cation current I h present in the dendrites of some pyramidal neurons affects their membrane and integration properties, synaptic plasticity and higher functions such as memory. A gradient of increasing h‐channel density towards distal dendrites has been found to be responsible for the location independence of excitatory postsynaptic potential (EPSP) waveform and temporal summation in cortical and hippocampal pyramidal cells. However, reports on other cell types revealed that smoother gradients or even linear distributions of I h can achieve homogeneous temporal summation. Although the existence of a robust, slowly activating I h current has been repeatedly demonstrated in nigral dopamine neurons, its subcellular distribution and precise role in synaptic integration are unknown. Using cell‐attached patch‐clamp recordings, we find a higher I h current density in the axon‐bearing dendrite than in the soma or in dendrites without axon in nigral dopamine neurons. I h is mainly concentrated in the dendritic membrane area surrounding the axon origin and decreases with increasing distances from this site. Single EPSPs and temporal summation are similarly affected by blockade of I h in axon‐ and non‐axon‐bearing dendrites. The presence of I h close to the axon is pivotal to control the integrative functions and the output signal of dopamine neurons and may consequently influence the downstream coding of movement.
Abbreviations
- ABD
axon‐bearing dendrite
- aEPSP
artificial excitatory postsynaptic potential
- AP
action potential
- DA neuron
dopamine neuron
- FITC
fluorescein isothiocyanate
- Ih
h‐current
- IR–DGC
infrared−Dodt gradient contrast
- nABD
axon‐bearing dendrite
- PLP neuron
pyramidal‐like principal neuron
- r
correlation coefficient
- Rin
input resistance
- TH
tyrosine hydroxylase
- ZD 7288
4‐ethylphenylamino‐1,2‐dimethyl‐6‐methylaminopyrimidinium chloride
Introduction
Dendrites represent a major part of the cellular surface area of neurons and are therefore a predominant site for excitatory synaptic input. The propagation of synaptic activity converging to the site of integration is controlled by the interplay between the passive and active dendritic membrane properties (London & Hausser, 2005). Various voltage‐gated channels are present in dendrites and their specific distribution and density influence the processing of synaptic signals.
The hyperpolarization‐activated cation current (I h) is expressed in several principal neurons (Magee, 1998; Williams & Stuart, 2000; Berger et al. 2001; Angelo et al. 2007; Angelo & Margrie, 2011; Sheets et al. 2011) and in interneurons (Maccaferri & McBain, 1996; Svoboda & Lupica, 1998; Zhu et al. 1999; Aponte et al. 2006; Vervaeke et al. 2012). The contribution of I h to neuronal signalling includes the modulation of passive and active membrane properties, intrinsic resonance, synaptic integration and synaptic plasticity. Alterations in channel function or expression have been linked to pathological states, such as epilepsy, pain and age‐related diseases (He et al. 2014). One of the most characteristic functions of I h is to influence synaptic integration by shortening the width of excitatory postsynaptic potentials (EPSPs) and reducing temporal summation. Herewith, PSPs arriving at the soma have similar width, regardless of their origin. While the site independence of synaptic temporal summation is correlated to a well‐defined spatial gradient of I h in dendrites in CA1 hippocampal and L5 cortical pyramidal neurons (Magee, 1998; Berger et al. 2001), this association is not systematically observed in every h‐channel expressing neurons (Nusser, 2009). In hippocampal pyramidal‐like principal (PLP) neurons, I h decreases gradually from the soma towards distal dendrites (Bullis et al. 2007) and in cerebellar Purkinje neurons, I h is linearly distributed along the dendritic tree (Angelo et al. 2007) but in both types of neurons temporal summation is location independent when I h is active.
In the substantia nigra, dopamine (DA) neurons influence the control of movement by releasing dopamine in the striatum. The degeneration of these neurons is related to motor disturbances as they are described in Parkinson's disease. DA neurons receive excitatory synaptic innervation from many brain areas, including the subthalamic nucleus and the pedonculopontine nucleus (Watabe‐Uchida et al. 2012). Interestingly, the axon of DA neurons generally originates from a dendrite dividing the dendritic compartment of these neurons in axon‐ and non‐axon‐bearing dendrites (Hausser et al. 1995). This morphology contrasts with the typical arrangement of subcellular compartments found generally in neurons and with the law of dynamic polarization stated by Ramon y Cajal (1911). DA neurons are also well known to display a prominent sag in the membrane potential induced by long hyperpolarizing current injections. This sag is consecutive to the activation of slow h‐channels composed by HCN2, HCN3 and HCN4 subunits but not HCN1 (Franz et al. 2000; Dufour et al. 2014). While I h in DA neurons has been receiving intense interest for two decades (Harris & Constanti, 1995; Mercuri et al. 1995; Cathala & Paupardin‐Tritsch, 1997), the exact localization of the channel and its functional roles remain unknown. Given the pivotal role of DA neurons in controlling voluntary movement, it is important to determine the subcellular distribution of I h in these neurons and their role in synaptic integration. We performed local somatic and dendritic cell‐attached patch‐clamp recordings along the somatodendritic domain of DA neurons and observed that I h exhibits a non‐uniform distribution. Using simultaneous whole‐cell somatic and dendritic recordings we examined the effect of I h on single and multiple synaptic inputs and found that the current reduces EPSP integral and temporal summation.
Methods
Ethical approval
Experiments were performed in strict accordance with institutional (protocol 1210, Commission d'Ethique Animale, University of Liège), national (Comitéd éontologique) and European guidelines for animal experimentation. The Guide for the Care and Use of Laboratory Animals, prepared by the Institute of Laboratory Animal Resources, National Research Council, and published by the National Academy Press, was followed carefully. The experiments described in this study are in accordance with the policies and regulations of The Journal of Physiology (Drummond, 2009).
Midbrain slice preparation
Coronal midbrain slices (300–350 μm thick) were prepared from the brains of 16‐ to 21‐day‐old Wistar rats. Animals of either sex were sacrificed by rapid decapitation in strict accordance with institutional, national and European guidelines. Slices were prepared in ice‐cold solution containing (mm): 87 NaCl, 25 NaHCO3, 10 d‐glucose, 75 sucrose, 2.5 KCl, 1.25 NaH2PO4, 0.5 CaCl2 and 7 MgCl2, equilibrated with 95% O2/5% CO2 using a vibratome (Leica VT‐1200, Nussloch, Germany). Slices containing the substantia nigra recovered from the slicing procedure in a storing chamber containing standard physiological saline. For recordings, the slices were perfused with saline containing (mm): 125 NaCl, 25 NaHCO3, 25 d‐glucose, 2.5 KCl, 1.25 NaH2PO4, 2 CaCl2 and 1 MgCl2.
Recordings
Neurons were visualized using infrared−Dodt gradient contrast (IR−DGC) optics on a Zeiss FS microscope equipped with an IR camera (Newvicon tube in NC‐70 Dage‐MTI). Dendrites were visualized with a 2×–4× changer (Dodt, Luigs‐Neumann, Rattingen, Germany). Patch pipettes were pulled from thick walled borosilicate glass tubing (outer diameter: 2 mm, inner diameter: 1 mm) with a horizontal puller (P‐97, Sutter Instruments, Novato, CA, USA). For dual recordings the composition of the internal solution was (mm): 120 KMeSO4, 20 KCl, 2 MgCl2, 2 Na2ATP, 0.5 Na2GTP, 5 Na2‐phosphocreatine, 0.1 EGTA, 10 Hepes and 0.1% biocytin (pH 7.3). When filled with this solution, tip resistances were between 6 and 10 MΩ and between 8 and 19 MΩ for whole‐cell somatic and dendritic recordings, respectively. For cell‐attached experiments, pipettes were filled with high potassium solution of the following composition (mm): 120 KCl, 2 CaCl2, 1 MgCl2, 10 Hepes, 20 tetraethylammonium‐Cl, 5 4‐AP, 1 BaCl2, 0.02 CdCl2 and 200 nm TTX. Their resistance was standardized at 10 MΩ (10.02 ± 0.19 MΩ; n = 41) to reduce variations in patch area. Patch area was calculated with the following equation: a = 12.6 (1/R + 0.018), where a is area (μm2) and R is resistance (MΩ) (Sakmann & Neher, 1995, p. 648). For the activation curve of I h, peak tail currents were normalized and plotted as a function of voltage. A single Boltzmann equation of the form: f(V) = 1/(1 + exp((V half−V)/k)) was fitted to the data points with V half representing the voltage of half‐maximal activation and k the slope factor. The I h blocker ZD 7288 was dissolved in distillated water to obtain a final concentration of 30 μm. To prevent spontaneous firing during cell‐attached recording, 200 nm TTX and 200 μm CdCl2were added to the external solution.
Chemicals
Chemicals were as follows: ZD 7288 (4‐ethylphenylamino‐1,2‐dimethyl‐6‐methylaminopyrimidinium chloride; Tocris, Bristol, UK), tetrodotoxin citrate (TTX; Tocris) and biocytin (Life Technologies, Gent, Belgium). The remaining chemicals were purchased from Sigma‐Aldrich (Belgium).
Data acquisition and analysis
Recordings were performed using two Axopatch 200B amplifiers (Molecular Devices, Palo Alto, CA, USA) connected to a PC via a Digidata 1440A interface (Molecular Devices). Data were acquired with pClamp 10.4 (Molecular Devices). The current‐clamp signal was bessel filtered at 10 kHz and sampled at 100 kHz. Whole‐cell dendritic recordings were discarded if the access increased > 50 MΩ. Artificial EPSPs (aEPSPs) were generated by injecting double‐exponential current waveforms (τrise = 0.6 ms; τdecay = 3 ms) at somatic and dendritic sites and analysed at the soma. The effect of I h on aEPSPs was examined following bath application of the I h blocker ZD 7288 (30 μm) after observation of a reduction in the membrane potential rectification (sag) (Harris & Constanti, 1995). All aEPSPs shown are the average of 40 single traces. The cell‐attached voltage‐clamp recordings were bessel filtered at 2 kHz and acquired at 20 kHz. I h was elicited with a 2 s hyperpolarizing voltage step of ∼−90 mV from a holding potential of ∼ −60 mV at 0.066 Hz. Leak subtraction of cell‐attached data was performed on‐line by running a P/4 subtraction protocol. Current recordings are the average of 2–37 traces. The liquid junction potential was not corrected. All recordings were performed at room temperature (20–24°C). All data analysis was carried out in Mathematica 8 or 9 (Wolfram Research, Champaign, IL, USA), Stimfit 0.10 (C. Schmidt‐Hieber, University College London, UK) and Excel (Microsoft). The integral of single aEPSPs is calculated as the area, normalized to peak amplitude, from the beginning of the voltage trace to 400 ms after. The rise time of aEPSPs was fitted with a monoexponential function f(x) = a(1 − exp(−x/τ)). Apparent input resistance R in was determined as described previously (Spruston & Johnston, 1992) using small current amplitudes (−80 to +40 pA, increment 40 pA). Delays between dendritic and somatic action potentials (APs) in simultaneous recordings were measured at half‐maximal amplitude during the AP rising phase. These APs were elicited by somatic current injection only. Linear regression fitted to data points gave a mean velocity of 0.34 m s−1. Lines in all the figures indicate linear regressions fitted to data points with or without constraints.
Morphology of neurons
For the morphology of DA neurons, slices were fixed for ∼12 h in 4% paraformaldehyde, washed and incubated overnight with 1 μl Fluorescein Avidin DCS (Lab Consult, Brussel, Belgium) per millilitre of Triton X‐100. After washing, slices were embedded in ProLong Antifade (Life Technologies, Gent, Belgium). For tyrosine hydroxylase (TH) immunohistochemistry, slices were incubated with a primary monoclonal antibody against TH (mouse, ImmunoStar, Hudson, WI, USA). The secondary antibody (goat anti‐mouse‐Alexa 568, Life Technologies) was applied together with Fluorescein Avidin DCS. The fluorescence was observed with an Olympus confocal microscope (FV1000) in collaboration with the GIGA‐Imaging platform.
Analysis of morphological properties of neurons was performed with labelling of biocytin‐filled neurons. To determine the soma centre of each neuron, the length of the longest axis was measured (Tepper et al. 1994). To determine the largest primary dendrite and accordingly and generally (but not exclusively) the axon‐bearing dendrite, dendritic diameter measurements were made at 25 μm from the soma centre as previously described (Tepper et al. 1994; Kotter & Feizelmeier, 1998). The axon of DA neurons was identified using several complementary criteria, as previously described (Tepper et al. 1987; Hausser et al. 1995; Gentet & Williams, 2007). First, the axon was generally the thinnest process in comparison with primary dendrites (Tepper et al. 1987; Hausser et al. 1995; Nedergaard & Hounsgaard, 1996). Second, axonal processes were often but not systematically terminated by an axonal bleb when observed under fluorescence microscopy as initially reported for cortical neurons (Shu et al. 2006). In neurons where the axon bleb could be measured, this diameter was ∼3.3 μm. In experiments for which simultaneous paired recordings were performed, we determined the compartment in which the action potential was observed first. These observations were correlated with the examination of partial reconstruction of biocytin‐filled neurons where the compartment carrying the axon was located.
Statistical analysis
Experimental values are expressed mean ± SEM. Error bars in the figures also indicate SEM. Statistical analysis was performed using either R or Mathematica. Data were tested for normality with Shapiro–Wilk test. Normally distributed data were tested by a two‐sided t test or a two‐sided paired t test and non‐normal data by non‐parametric two‐sided Wilcoxon rank sum test or a two‐sided Mann–Whitney test.
Results
Anatomical and electrophysiological identification of nigral DA neurons
DA neurons were tentatively identified in the nigral pars compacta or in the pars reticulata close to the border with the pars compacta in midbrain slices on the basis of their large soma and the orientation of their primary dendrites which extend along the pars compacta − pars reticulata border and in the medio‐lateral direction through the pars reticulata (Tepper et al. 1987). Somata were either fusiform, pyramidal or polygonal and emitted two to four primary dendrites. Identification was confirmed during the recording by a prominent membrane potential rectification (sag) using long hyperpolarizing current pulses (average steady‐state to peak sag ratio measured at a potential of ∼−60 mV: 0.42 ± 0.01, n = 48) and broad action potentials (half‐width duration, 2.54 ± 0.22 ms, n = 24). These values differed from those of GABA neurons, which have less or no sag potential and shorter action potentials (average sag ratio 0.87 ± 0.05, n = 4; action potential half‐width 0.82 ± 0.05 ms,n = 4, data not shown) (Lacey et al. 1989; Hausser et al. 1995).
Post‐hoc biocytin labelling allowed visualization of dendrites and the emergence point of the axon along the somatodendritic domain of DA neurons.
Morphological analysis revealed that the axon is originating from the largest primary dendrite in 79% of the cases at a mean distance from the soma of 55 ± 5 μm (range 11–176 μm, n = 36), corresponding closely to previous data (Hausser et al. 1995). At 25 μm from the soma centre, the diameter of the largest primary dendrite was ∼3.2 μm, in agreement with previous results (Tepper et al. 1994; Kotter & Feizelmeier, 1998). In 9% of all neurons the axon originated from the soma. For another 12% of neurons, the axon originated from a thinner primary dendrite. Axons had a very small diameter, extended generally towards the medial part of the slice and were often but not systematically terminated by the presence of an enlargement termed axonal bleb produced by sectioning (Shu et al. 2006). No local branching was observed along the whole length of the axon within the slice, confirming previous observations.
Simultaneous double somatic and somatic–dendritic whole‐cell voltage recordings were performed along the somato‐dendritic domain of neurons. Non‐axon‐bearing dendrites (nABDs) and axon‐bearing dendrites (ABDs) were distinguished by comparing IR‐DGC videomicroscopy images to confocal fluorescence images of biocytin‐filled neurons (Fig. 1 A).
Figure 1. Electrophysiological characterization of substantia nigra DA neurons .
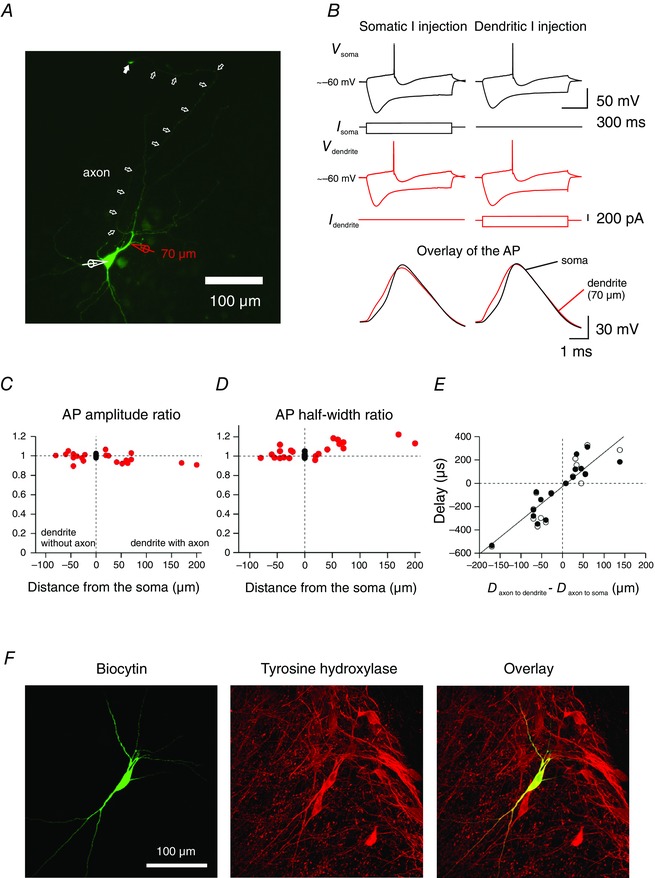
A, confocal micrograph of a DA neuron filled with biocytin and stained with fluorescein isothiocyanate (FITC)‐conjugated avidin; 20 μm stack projection. Simultaneous somatic (white pipette) and dendritic recording with red pipette at 70 μm from the soma centre. White arrows indicate the axon. The last arrow indicates the axon bleb. B, 1‐s long current pulses of increasing amplitude were injected alternately in the soma and in the dendrite and the resulting APs were recorded at the somatic (black) and dendritic (red) location. APs used for analysis were evoked by a low depolarizing current pulse (80 pA in this neuron for either somatic and dendritic current injection). The membrane potential rectification corresponding to the voltage sag was examined with hyperpolarizing 200 pA current injections. Bottom, overlay of APs recorded from the somatic (black traces) and the dendritic (red traces) compartment in response to somatic current injection (left) and dendritic current injection (right). The AP is detected first in the compartment where the axon was found to emerge regardless of the site of current injection. APs at the bottom represent enlargements from the voltage traces (APs) at the top. The delay between dendritic and somatic APs were measured at half‐maximal amplitude during the AP rising phase. Same neuron as in A. C, comparison of the amplitudes of the somatic and dendritic APs in DA neurons at different distances from the soma, expressed as the ratio of the peak of the dendritic/somatic AP amplitude. Data are pooled to allow comparison between axon‐bearing dendrites (right) and dendrites lacking the axon (left). APs propagate without marked amplitude attenuation along dendrites. Data are from 12 double somatic recordings and 21 somatic–dendritic recordings. D, comparison of the half‐width of the somatic and dendritic APs at different distances from the soma, expressed as the ratio of the dendritic/somatic AP half‐width. Note the slightly longer AP half‐width along axon‐bearing dendrites. E, diagram of the delay between somatic and dendritic APs as a function of difference of distances, using the axon emergence point as a reference. Solid circles are from somatic current injection; open circles from dendritic current injection. Data points for APs elicited by somatic current injection were fitted with a linear regression. The regression line intersected the x‐axis near zero, indicating that APs are initiated in the axon. The slope of the regression line was 2.9 μs μm−1. F, confocal micrograph of a DA neuron filled with biocytin and stained with FITC‐conjugated avidin (left) and for tyrosine hydroxylase (TH, centre). The overlay of FITC and TH is at the right; 33 μm stack projection.
When APs were recorded simultaneously at the soma and at an ABD, the AP recorded from the ABD preceded the somatic AP following a long low‐intensity current injection either with the somatic or the dendritic pipette (Fig. 1 B). In the experiment illustrated in Fig. 1 B, the delay measured between APs was 280 μs with somatic current injection and 304 μs with dendritic current injection. This observation confirms previous reports that APs are first detected in the subcellular compartment from which the axon is emerging (Hausser et al. 1995; Gentet & Williams, 2007). Along ABDs and nABDs, the amplitude of AP evoked by somatic current injection experienced almost no attenuation (Fig. 1 C), less than 10% for the longest distance analysed (n = 21), as shown previously (Hausser et al. 1995). AP half‐width was independent of distance along nABDs but was slightly longer in ABDs (Fig. 1 D). The delay between dendritic and somatic APs was plotted as a function of distance between recording sites using the axon origin as reference (Fig. 1 E). The distribution of AP propagation delays (n = 16) was fitted with a linear regression. The linear regression line crossed the abscissa axis close to zero, confirming that APs are initiated in the axon (correlation coefficient r = 0.89; P < 0.001). The average AP propagation velocity calculated from the linear regression was 0.34 m s−1. In one case in which the APs arrived simultaneously at both recording electrodes and no latency could be measured, the axon originated on the thickest primary dendrite but very close to the soma (16 μm from the centre). In another case, the somatic AP preceded the dendritic AP in a simultaneous somatic–ABD recording. This neuron has not been included in the analysis.
The identity of DA neurons was further confirmed for a subset of neurons by the presence of TH immunoreactivity co‐localized with the labelling of biocytin‐filled neurons (Fig. 1 F).
Voltage‐dependent activation and distribution of I h current in nigral DA neurons
I h has been reported to participate in synaptic integration in cortical, hippocampal and cerebellar principal neurons with a channel distribution specific to the corresponding neuron. To examine the distribution of I h in DA neurons we used cell‐attached patch recordings from the somatic and dendritic membrane (Fig. 2 A, B). Patch pipettes were selected to have 10 MΩ resistance in order to obtain comparable membrane patch surfaces. The electrophysiological identity of DA neurons was determined with consecutive whole‐cell recordings (whole‐cell current‐clamp recordings; Fig. 2 C, D) with pipettes containing biocytin for post‐hoc labelling. The resulting fluorescent staining was compared to IR‐DGC photomicrography to reveal the position of the axon origin and the compartment from which it is emerging. TH expression was confirmed in a subset of experiments (Fig. 1 F). With cell‐attached pipettes filled with a solution designed to block other voltage‐gated channels, I h activated slowly in response to long negative voltage steps (−90 mV, 2 s; Fig. 2 B) and the steady state was reached after several hundreds of milliseconds. I h activation was voltage‐dependent, as illustrated by the example in Fig. 2 E and F. The slow inward current started to activate at potentials <−60 mV and increased in amplitude with increasing hyperpolarization voltage steps (Fig. 2 E). Peak tail currents were measured and normalized to determine an activation curve of I h (Fig. 2 F). Data points could be fitted with a single Boltzmann function with values of V half = −108 mV and k = 8.8 (n = 2). The mean current density of I h was significantly larger in ABD (2.06 ± 0.64 pA μm−2, n = 18) than in nABD (0.48 ± 0.12 pA μm−2, n = 11) and in the soma (0.49 ± 0.13 pA μm−2, n = 12, P = 0.037, Kruskal−Wallis test, Fig. 2 G). These data indicate that the distribution of h‐channels is not homogeneous along the somatodendritic axis of DA neurons and that the I h density is larger in axon‐bearing dendrites.
Figure 2. Distribution of Ih densities along the somatodendritic domain of nigral DA neurons .
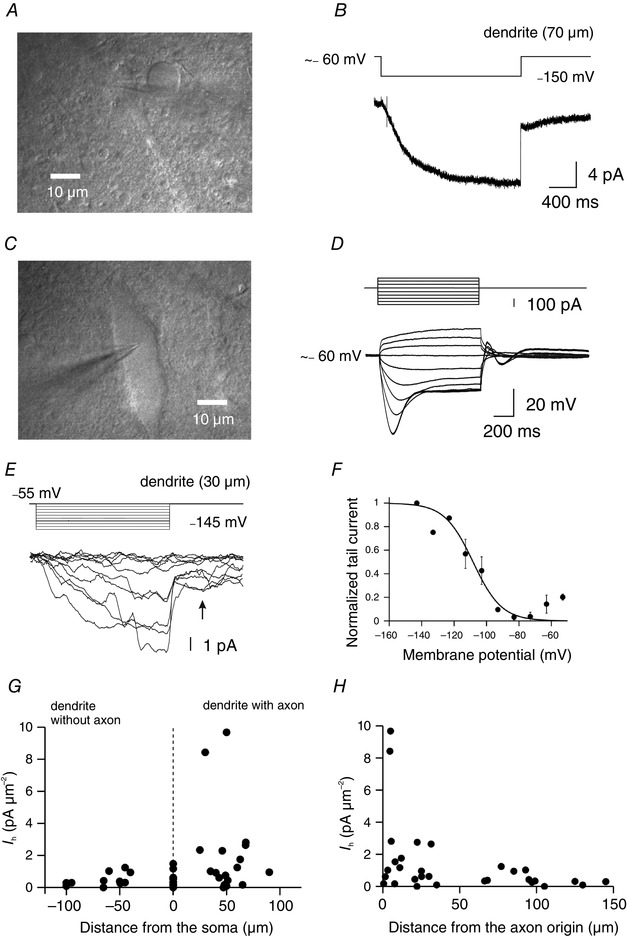
A, infrared Dodt gradient contrast (IR‐DGC) video image showing cell‐attached recording on a DA neuron dendrite at a distance of 70 μm from the soma centre. B, I h recorded from the DA neuron shown in A using a high K+ pipette solution. Hyperpolarizing voltage commands from ∼ −60 mV to ∼ −150 mV resulted in the activation of slow h‐currents. In this case, the time constant of current activation was 581 ms when fitted with a monoexponential function. C, IR‐DGC video image of the DA neuron soma corresponding to the neuron shown in A. The somatic patch pipette contained biocytin for post‐hoc labelling. D, somatic voltage responses to 1 s depolarizing and hyperpolarizing current pulses in the whole‐cell current‐clamp recording configuration. Membrane potential before the pulse was ∼−60 mV. Note the presence of the sag during hyperpolarizing current pulses and the absence of APs due to the presence of Na+ and Ca2+ channel blockers in the bath (TTX and CdCl2) to suppress spontaneous activity. E, collection of h‐currents (bottom) in response to hyperpolarizing voltage steps of increasing amplitude (−55 to −145 mV, increment 10 mV, top) in a cell‐attached patch at 30 μm from the soma and 4.6 μm from the axon origin (axon‐bearing dendrite). Note the slow activation time of these currents. The arrow indicates the measurement of tail currents. F, activation curve of I h obtained by measuring tail currents (as shown in C). The sigmoidal curve represents a single Boltzmann equation fitted to data points with V half = −108 mV and k = 8.8 (n = 2). Recordings were from axon‐bearing dendrites. G, distribution of I h density as a function of the distance from the soma along the somatodendritic domain. Note the higher current densities in axon‐bearing dendrites and the comparable current densities in the soma and the dendrites without axon. Data from 12 somatic and 29 dendritic patches. H, distribution of I h density using the axon origin as a reference point. Note the higher current densities in the membrane area close to the axon origin. Neurons were fluorescently labelled (post‐hoc) to determine the dendrite carrying the axon. Data from 31 patches.
Interestingly, the distribution of I h densities plotted as a function of the distance from the axon origin shows larger, yet variable, current densities around the origin of the axon and smaller current densities towards longer distances from the axon origin (Fig. 2 H). Within 50 μm around the axon, mean I h current density was higher (2.02 ± 0.64 pA μm−2, n = 18, range: 0–9.68 pA μm−2) than at distances greater than 50 μm from the axon origin (0.47 ± 0.11 pA μm−2, n = 12, range: 0–1.24 pA μm−2; P = 0.031, Mann–Whitney U test). These data reveal that I h is predominant in ABDs of DA neurons, in a membrane area (within ∼50 μm) around the axon emergence point. This I h distribution contrasts for instance with the one reported for cortical pyramidal neurons in which almost no current is detected in the axon (Williams & Stuart, 2000). Our data therefore shows for the first time a gradient of I h influenced by the position of the axon origin.
Influence of I h on the waveform of EPSPs
The distribution of I h along the somatodendritic axis of DA neurons may have consequences for the propagation and integration of synaptic potentials as shown for cortical, hippocampal and cerebellar neurons. To examine the influence of I h on the waveform of synaptic potentials, we generated aEPSPs by injecting EPSC‐like current waveforms (rise time constant: τrise = 0.6 ms; decay time constant: τdecay = 3 ms; peak amplitude = 100 pA) via a somatic or a dendritic whole‐cell recording and measured the resulting EPSPs at the soma using a second electrode. EPSC rise and decay time constant values were chosen to be close to the range of values describing EPSCs in DA neurons (Mereu et al. 1991). Neurons were held at −70 mV using constant current injection to suppress spontaneous firing and to achieve comparable conditions before and after the application of ZD 7288 (30 μm). Bath application of ZD 7288 reduced the sag and I h (Harris & Constanti, 1995; Neuhoff et al. 2002; Masi et al. 2013), increased the input resistance and hyperpolarized DA neurons.
Double somatic recordings indicate that the rise time of local aEPSPs is not modified in the presence of ZD 7288 (in control: 1.84 ± 0.04 ms; in ZD: 1.81 ± 0.03 ms, n = 13, P = 0.29, Wilcoxon signed rank test). In contrast, application of ZD 7288 significantly increased the mean integral of aEPSPs in comparison with the mean integral of aEPSPs in control conditions (in control: 58 ± 7 mV ms; in ZD 7288: 91 ± 9 mV ms, n = 13, P = 0.006, Fig. 3 F, G), indicating that the time course of single EPSPs generated in the soma is influenced by I h. Mean peak amplitude of aEPSPs was very slightly but significantly increased in the presence of ZD 7288 (in control: 2.78 ± 0.13 mV; in ZD: 2.91 ± 0.14 mV, n = 13, P = 0.002, paired t test).
Figure 3. Effect of Ih on single aEPSP time courses .
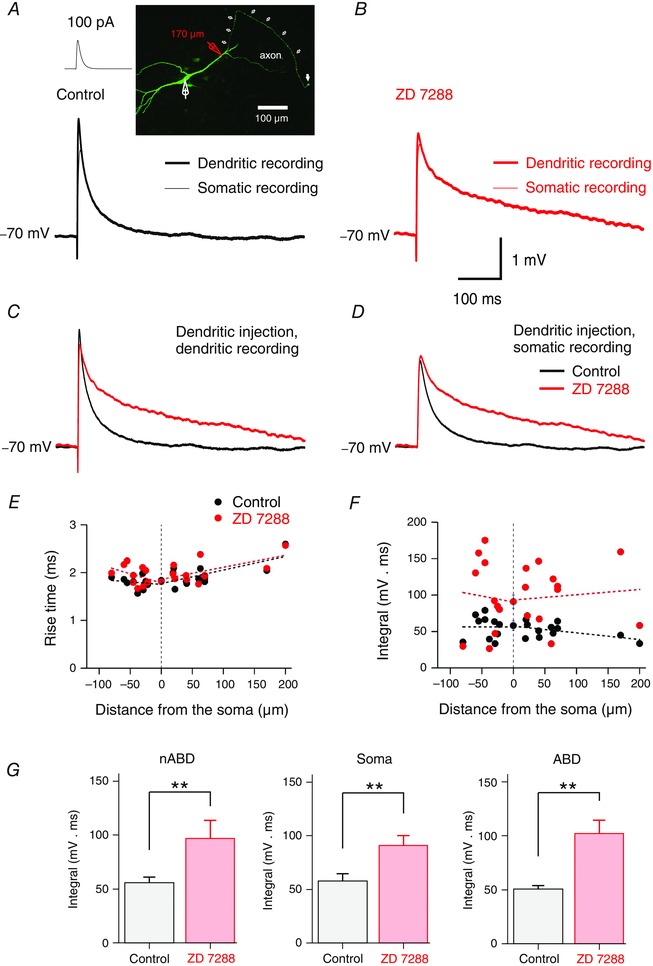
A, local artificial EPSP (aEPSP) recorded at the injection point along a dendrite (thick trace) and simultaneous aEPSP recorded at the soma (thin trace). aEPSPs were evoked with EPSC‐like waveforms of 100 pA (inset, left). Note the decrease of the aEPSP recorded at the soma due to propagation. Inset (right), confocal micrograph of a DA neuron stained with fluorescein isothiocyanate (FITC)‐conjugated avidin;106 μm stack projection. Simultaneous somatic (white pipette) and dendritic recording with red pipette at 170 μm from the soma centre. White arrows indicate the axon. The last arrow indicates the axon bleb. B, effect of blocking I h with ZD 7288 (30 μm) on aEPSPs. The integral of EPSPs is increased locally at the injection point and for the propagated EPSP recorded at the soma. C, effect of ZD 7288 on aEPSPs at the dendritic injection point. The mean trace in control (black) and mean trace in the presence of ZD 7288 (red) are overlaid. D, effect of ZD 7288 on the propagated aEPSPs recorded at the soma. Each voltage trace corresponds to the average of 40 raw traces (A−D). E, distribution of aEPSP rise time under control (black solid circles) and in the presence of ZD 7288 (red solid circles) as a function of distance between the injection point and the soma. Rise time of aEPSPs is not dependent on the injection site in control conditions and after application of ZD 7288 (P > 0.05 for all cases). F, distribution of the integral of aEPSPs recorded in the soma as a function of distance from the injection site. Data points in E and F are from 13 double somatic recordings expressed as the mean ± SEM (position 0) and 21 paired somatic–dendritic recordings. Note the absence of linear correlation before and after ZD 7288 (Spearman's r, −0.33, −0.0039, −0.007, −0.25; P > 0.05 in all cases). G, bar charts showing the effect of ZD 7288 on the EPSP integral for single aEPSPs injected in non‐axon‐bearing dendrites (left), in the soma (centre) and in axon‐bearing dendrites (right) and recorded at the soma. ZD 7288 increased significantly the integral of aEPSPs in the soma, axon‐bearing and axon‐lacking dendrites (**P < 0.01 for all cases, Wilcoxon signed rank test). The effect of ZD 7288 on the integral of aEPSPs was comparable in the three subcellular compartments (P > 0.1, Kruskal–Wallis). Data are shown as mean ± SEM for the three subcellular compartments (soma, nABD and ABD).
In somatic–dendritic paired recordings, EPSCs were injected along dendrites at various distances from the soma. Figure 3 A−D shows an example of a local and a propagated aEPSP produced by a dendritic injection of an EPSC waveform of 100 pA. In this case, the injection site was on an ABD at 176 μm from the soma. Note the slight decrease of the propagated aEPSP in control conditions and the similar effect of ZD 7288 at the injection site and for the propagated EPSP at the soma.
The rise time of aEPSPs was not dependent on the dendritic injection point either in ABDs (slope of regression line for ABD: 0.3 ms 100 μm–1) or in nABDs (0.1 ms 100 μm–1, Fig. 3 E). The application of ZD 7288 did not change the dependence of the rise time along ABDs (0.3 ms 100 μm–1) and nABDs (0.4 ms 100 μm–1, P > 0.05 for all cases).
Mean amplitude of aEPSPs recorded at the soma was not altered by ZD 7288 for EPSCs injected both in ABDs and in nABDs (in control: 2.84 ± 0.14 mV; in ZD: 2.87 ± 0.14 mV, n = 21, P = 0.11). In contrast, the mean integral of aEPSPs was significantly increased (in control: 53 ± 3 mV ms; in ZD: 100 ± 10 mV ms, n = 21, P < 0.001) throughout the entire dendritic compartment. Figure 3 F shows the distribution of the effect of ZD 7288 on the integral of aEPSPs along the somatodendritic axis of DA neurons.
In the presence of ZD 7288, the distribution of the integral of aEPSPs contrasts strongly with the distribution in control conditions and reveals larger yet variable values for the integral of aEPSPs along the somatodendritic domain. The I h blocker increased significantly the mean integral of aEPSPs both in nABDs (in control: 56 ± 5 mV ms; in ZD: 97 ± 17 mV ms, n = 10, P = 0.014) and in ABDs (in control: 51 ± 3 mV ms; in ZD: 102 ± 12 mV ms, n = 11, P = 0.006).
The mean percentage effect of ZD 7288 on the integral of aEPSPs was slightly but not significantly higher for ABDs (206 ± 25% of control, n = 11) than for nABDs (162 ± 18% of control, n = 10) or the soma (176 ± 27% of control, n = 13, P > 0.1, Kruskal–Wallis, Fig. 3 G).
These results indicate that the effect of ZD 7288 on the shape of single aEPSPs was similar along the somatodendritic domain of DA neurons.
Influence of I h on the temporal summation of EPSPs
We further explored the effect of I h on short trains of EPSCs injected along the somatodendritic axis of DA neurons. This stimulation protocol was used to reveal the contribution of I h on temporal summation of multiple and consecutive EPSPs. Five simulated EPSCs of 20 pA separated by 200 ms (50 Hz) were injected along dendrites at various distances from the soma. Temporal summation was defined as the integral of the summation of aEPSPs. Figure 4 A shows an example of local and propagated trains of aEPSPs injected along an ABD at 40 μm from the soma. Note that the effects of ZD 7288 are similar at the injection site and for the propagated sum of EPSPs at the soma.
Figure 4. Effect of Ih on the temporal summation of aEPSPs .
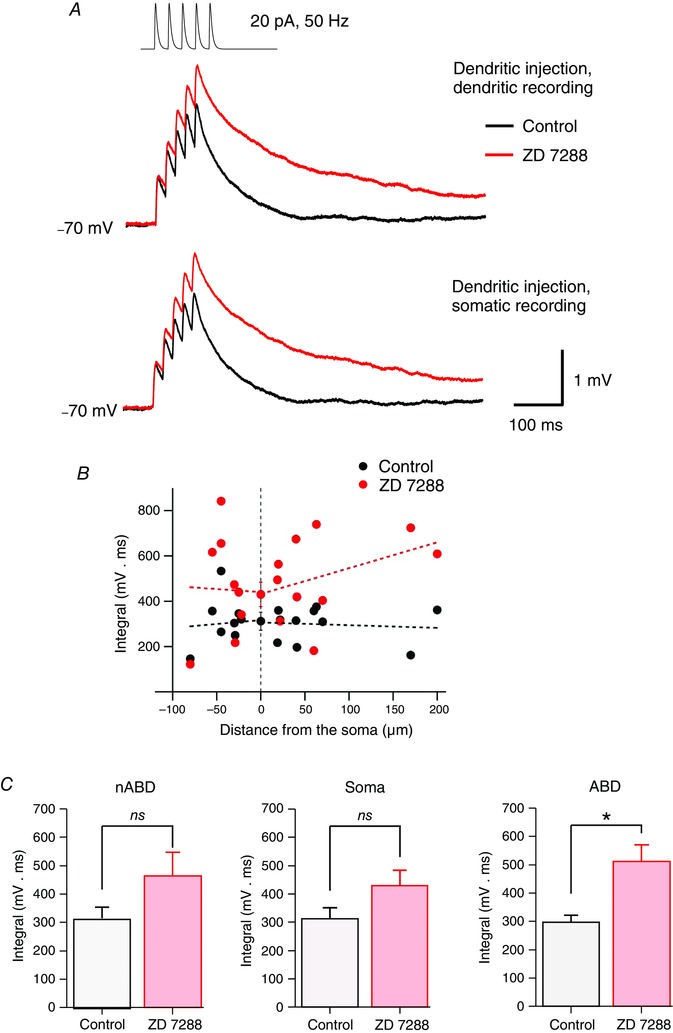
A, trains of aEPSPs recorded at the dendritic (top) and somatic (bottom) site before and after the application of ZD 7288. aEPSP trains were evoked via the injection of a sequence of five EPSC‐like waveforms of 20 pA at 50 Hz. In the example illustrated, the distance between the dendritic and the somatic pipettes was 40 μm. The mean trace in control (black) and mean trace in the presence of ZD 7288 (red) are overlaid. Traces represents the average of 40 raw voltage traces. B, distribution of the integral of aEPSP trains as a function of the distance from the soma centre in control (black solid circles) and after the application of ZD 7288 (red solid circles). The activation of I h tends to linearize the distribution of aEPSP integral. The effect of ZD 7288 was highly variable along the somatodendritic domain but increased on average temporal summation. Data points are from 11 double somatic recordings expressed as the mean ± SEM and 18 paired somatic–dendritic recordings. Note the absence of a linear correlation either in control or after ZD 7288 application (Spearman's r, 0.11, 0.13, 0.26 and −0.23; P > 0.2 in all cases). C, bar charts showing the effect of ZD 7288 on the mean integral of aEPSP trains in non‐axon‐bearing dendrites (left), in the soma (centre) and in axon‐bearing dendrites (right). The presence of ZD 7288 significantly increased temporal summation in axon‐bearing dendrites but not in the soma and non‐axon‐bearing dendrites. Data are shown as mean ± SEM. *P < 0.05; ns, not significant (Wilcoxon signed rank test).
For inputs at the soma, application of ZD 7288 did not significantly increase the temporal summation in comparison to control conditions (in control: 312 ± 40 mV ms; in ZD: 430 ± 54 mV ms, n = 11, P = 0.10, Fig. 4 C). This indicates that the temporal summation for EPSPs generated at the soma is not strongly influenced by I h.
Dual somatic–dendritic recordings revealed that the application of ZD 7288 significantly increased the mean integral of aEPSPs summation (in control: 305 ± 21 mV ms; in ZD: 490 ± 48 mV ms, n = 18, P = 0.003) throughout all dendrites. Figure 4 B shows the distribution of the effect of ZD 7288 on the integral of multiple aEPSPs along the somatodendritic axis of DA neurons. Among the dendrites, ZD 7288 significantly increased the mean integral of the sum of aEPSPs in ABDs (in control: 298 ± 24 mV ms; in ZD: 512 ± 58 mV ms, n = 10, P = 0.019) but not in nABDs (in control: 315 ± 39 mV ms; in ZD: 463 ± 84 mV ms, n = 8, P = 0.08). The mean percentage of effect of ZD 7288 on the integral of multiple aEPSP was slightly but not significantly higher for ABDs (190 ± 34% of control, n = 10) than for nABDs (147 ± 27% of control, n = 8, P = 0.16, Mann–Whitney, Fig. 4 C). These results indicate that on average I h induced a comparable effect on the temporal summation of EPSPs in both types of dendrite in DA neurons.
Basic cellular properties of DA neuron dendrites
Finally, we examined the distribution of sag amplitude and apparent input resistance (R in) in the somatodendritic domain of DA neurons (Fig. 5). Sag ratio was measured locally and normalized to the sag at the soma. Mean sag in dendrites (0.41 ± 0.02, n = 19) was not significantly different from sag in the soma (0.40 ± 0.02, n = 21, P > 0.1) and was constant as a function of distance from the soma along the somatodendritic domain. The slope of the linear regression along ABDs was 0.03 per 100 μm and along nABDs −0.02 per 100 μm (Fig. 5 C). When using the origin of the axon as a reference point, the ratio of sag dendrite/soma was also independent of location (slope of the linear regression: 0.02 per 100 μm, Fig. 5 D). These data indicate that the sag was not dependent on the location along the somatodendritic domain of DA neurons. In addition, the emergence point of the axon does not seem to influence the sag. A test for reciprocity is illustrated in Fig. 5 A (bottom). The voltage traces recorded in the soma and the dendrite in response to equal current injection at the opposite site are superimposed and the overlay indicates linear conduction in the voltage range tested. Mean apparent input resistance R in in the soma (327 ± 16 MΩ, n = 20) was not significantly different from R in in dendrites (318 ± 17 MΩ, n = 20, P > 0.1) and comparable to previous reports (Hausser et al. 1995). R inwas independent of location along ABD (slope of linear regression: 0.01 per 100 μm) and slightly but not significantly increasing along nABD (slope of linear regression: 0.11 per 100 μm, P > 0.1, Fig. 5 E). R inwas slightly but not significantly higher in nABDs than in ABDs (nABD: 327 ± 23 MΩ, n = 9; ABD: 311 ± 20 MΩ, n = 11, P > 0.1). Interestingly, when using the origin of the axon as a reference point, R in slightly but significantly increased with distance from the axon origin with a linear regression slope of 0.09 per 100 μm (P < 0.05, Fig. 5 F). The gradient of R in probably reflects the gradient of I h current density and the slightly smaller R in close to the axon agrees with a higher expression of h‐channels at this location. This assumption was confirmed by the effect of ZD 7288 on the apparent R in showing the absence of correlation with distance from the axon origin (P = 0.97).
Figure 5. Passive steady‐state properties in the somatodendritic domain of DA neurons .
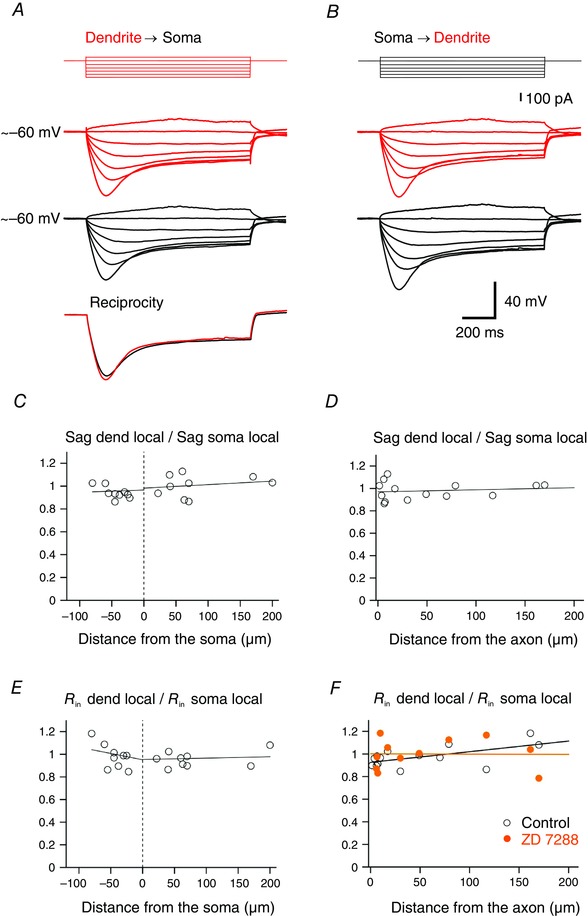
A, simultaneous recording of somatic voltage (black traces) and dendritic voltage (red traces) induced by 1 s step current injections (−200 to +40 pA, increment 40 pA) to the dendrite (red). Bottom, reciprocity illustrated by overlay of voltage traces induced by −200 pA current injection recorded with the non‐current injecting pipette. Note the similarity of the sag amplitude at both recording locations. B, dual recording of somatic voltage (black traces) and dendritic voltage (red traces) in the same neuron in response to the application of current steps as in A to the soma (black). C, ratio of local sag amplitude measured at the dendritic and somatic locations as a function of distance from the soma. Values are normalized to the sag amplitude measured at the soma for each neuron (n = 18). Voltage traces were induced by a 1 s step current of −200 pA. D, ratio of sag as a function of the distance from the axon origin (n = 14). Note the location independency of the sag along the somatodendritic domain (Pearson, P > 0.1). E, apparent input resistance (R in) as a function of distance from the soma. Values are normalized to the input resistance measured at the soma for each neuron (n = 19). R in was calculated using injection of small current amplitudes (−80 to +40 pA, increment 40 pA). F, apparent input resistance as a function of distance from the axon origin (open circle, n = 14). Data points were fitted with a linear regression (black line) showing an increase of 9% per 100 μm (Pearson, P = 0.025). Effect of ZD 7288 on apparent input resistance (orange disc, n = 11) as a function of distance from the axon origin. Linear regression (orange line) shows the absence of correlation with distance from the axon origin (Pearson, P = 0.97).
Discussion
In this study, we determined the subcellular distribution and the role of I h in synaptic integration in DA neurons of the substantia nigra. Along the somatodendritic axis of DA neurons, I h was found to be present at relatively low densities. Higher I h densities were observed in ABDs around the axon origin and lower current densities in the soma and nABDs. To our knowledge, such a gradient has not been reported previously. I h reduced comparably the average integral of single aEPSPs throughout the soma and dendritic compartments. Temporal summation was significantly increased by the blockage of I h in the dendritic compartment but not in the soma. However, changes in temporal summation were similar in ABDs and nABDs. The local sag was homogeneous in the somatodendritic domain. The apparent input resistance (R in) increased slightly with distance from the axon origin.
Level of expression and voltage‐dependent activation of I h in nigral DA neurons
We determined for the first time the voltage‐dependent activation of h‐channels from direct recordings at dendritic locations in DA neurons. The voltage of half‐activation and the slope factor were comparable to the values found in the dendrites of other neurons (Magee, 1998; Williams & Stuart, 2000; Berger et al. 2001; Kole et al. 2006; Angelo et al. 2007; Bullis et al. 2007). However, and interestingly, in these studies another set of HCN subunits is expressed in the cells (HCN1) in comparison with DA neurons (HCN2, HCN3, HCN4 but not HCN1; see below). During the cycle of spontaneous activity of DA neurons, there is probably only a very small percentage of the maximal current as revealed by the activation curve. In physiological conditions, in which the extracellular K+ concentration is reduced, V half may be shifted in the positive direction (Azene et al. 2003) and more current may be available.
The mean current density of I h is higher in ABDs than in the soma and nABDs, in a membrane region close to the origin of the axon. This I h distribution is unanticipated and contrasts largely with those reported previously for other CNS neurons in which the I h distribution was not obviously related to the site of the axon origin. CA1 pyramidal neurons, cortical pyramidal neurons and olfactory bulb mitral cells show an important increase of I h from the soma towards distal parts of dendrites (Magee, 1998; Williams & Stuart, 2000; Berger et al. 2001; Kole et al. 2006; Angelo & Margrie, 2011). Interestingly, in hippocampal PLP neurons, I h density is reversed and declines from the soma towards distal parts of dendrites (Bullis et al. 2007). In Purkinje neurons, I h is uniformly distributed in the dendritic compartment but the current is higher in dendrites than in the soma (Angelo et al. 2007). Remarkably, little or no h‐current was observed in the axonal and somatic compartments of neocortical pyramidal neurons (Williams & Stuart, 2000). Immunolabelling studies confirmed these observations by showing the absence of HCN1 in the axon and the low expression of the protein in the soma of pyramidal neurons (Lorincz et al. 2002).
When comparing absolute values of I h amplitudes reported for different cell types, our somatic I h amplitude values are comparable to those reported for Purkinje neurons (Angelo et al. 2007), but tend to be smaller than those reported for CA1 pyramidal neurons (Magee, 1998), L5 pyramidal neurons (Berger et al. 2001), olfactory bulb mitral cells (Angelo & Margrie, 2011) and PLP neurons (Bullis et al. 2007). In contrast to these previous reports, the I h density in DA neuron dendrites increases maximally 4–5‐fold, while cortical and hippocampal neurons show a much steeper increase in I h density in their dendrites. These differences in density between our recordings and recordings from other neurons may be explained, at least for some reports, by differences in the age of the animals used. Furthermore, a direct comparison of I h distribution in DA neurons with other neurons is complicated due to the particular morphology of DA neurons. In contrast to pyramidal neurons, DA neurons have shorter dendrites, are more electrically compact, have their axon origin on a dendrite and therefore have presumably a different direction for the information flow along their somatodendritic domain. Finally, the higher I h current density located close to the axon origin leaves open the possibility of even higher I h densities within the axon itself. This speculation might be strengthened by the fact that the large sag amplitude displayed by DA neurons may require a high global I h density. However, we did not attempt to perform cell‐attached patch recordings from the axon or axon initial segment or blebs. The presence of I h in the axonal compartment has been previously detected indirectly for other neurons, among them hippocampal parvalbumin‐containing interneurons (Aponte et al. 2006; Elgueta et al. 2015), cerebellar golgi interneurons (Vervaeke et al. 2012), CA3 pyramidal neurons (Soleng et al. 2003) and others (Shah, 2014).
Effect of blocking I h on temporal summation in nigral DA neurons
Our results show that I h reduces the integral of single aEPSPs without greatly affecting EPSP amplitude, in agreement with previous studies. The average effect of ZD 7288 on the integral of a single aEPSP is comparable in the soma and in both types of dendrites. The average temporal summation is significantly increased by ZD 7288 in dendrites but not in the soma. However, the effect was not different between the two types of dendrite. An increase of temporal summation consecutive to an indirect inhibition of I h has been reported previously using electrically evoked EPSPs (Masi et al. 2013), indicating that the effect of I h can be observed both on artificial and on electrically evoked multiple EPSPs.
In control conditions, I h tends to linearize the time course for both single aEPSPs and trains of aEPSPs along the somatodendritic axis. The application of ZD 7288 reveals the participation of I h in shaping the waveform of aEPSPs. The scattered distribution of aEPSP integrals after application of ZD 7288 and the absence of an evident relationship between the effect of ZD 7288 on the integral of aEPSPs and the distance from the soma is puzzling. The stronger effect of ZD 7288 on the integral of single and multiple aEPSPs observed for some cases in nABDs is conceivably not linked to the distribution of I h in the somatodendritic domain of DA neurons. A probable interpretation of this observation would be that the local density of the channel and the total amount of channels act independently to influence EPSP waveform, as reported previously for Purkinje cells (Angelo et al. 2007). This interpretation might extend to other cell types such as PLP neurons where the location independence of temporal summation observed in dendrites and soma is coupled to a gradual decrease of I h from the soma to the dendrites (Bullis et al. 2007). Location independence of temporal summation was also reported for entorhinal cortex layer V neurons (Medinilla et al. 2013). Comparably, temporal summation is only slightly location dependent in the presence of ZD 7288 in Purkinje cells (Angelo et al. 2007).
The variability of the effects observed for the integral of synaptic events under ZD 7288 may arise from several factors. (1) Neuronal architecture shows high variability within the DA neuron population. The variability includes different somatic shapes and different number, orientation and length of dendrites. (2) The unusual axon origin along a dendrite induces variability in the distance between the axon and the soma from one DA neuron to the other. (3) The organization of excitatory and inhibitory inputs along the somatodendritic domain of DA neurons is largely unknown. Of note, the effect of ZD 7288 on the integral of EPSPs has been shown to be counteracted by a GABAA receptor conductance (Atherton et al. 2010). (4) The interaction of I h with other ionic channels is not known (George et al. 2009). (5) I h is modulated by several neuromodulators (Cathala & Paupardin‐Tritsch, 1997; He et al. 2014), neurotransmitters such as dopamine (Rosenkranz & Johnston, 2006), cyclic nucleotides and auxiliary subunits (Zolles et al. 2009). The modulatory effect of dopamine via I h might be of critical importance due to the somatodendritic release of dopamine itself in nigral DA neurons. (6) The level of calcium‐binding protein calbindin expression might influence the effect of ZD 7288 or the dorso‐ventral position of the neuron (Neuhoff et al. 2002).
Mean apparent input resistance in dendrites (321 MΩ) was not significantly different from the apparent input resistance in the soma (mean: 330 MΩ) and close to previously reported values for DA neurons in comparable recording conditions, 394 MΩ (Hausser et al. 1995) and 302 MΩ (Hage & Khaliq, 2015). This contrasts with the input resistance of large L5 pyramidal neurons in which the values in the soma and dendrites are approximately an order of magnitude smaller (Zhu, 2000). Also, a constant input resistance in the somatodendritic domain has been observed in PLP neurons in the hippocampus (Bullis et al. 2007) but with ∼6‐fold smaller values. Interestingly, we noted a slight gradient (9% per 100 μm) of increasing input resistance as a function of distance from the axon origin (Fig. 5 F). This weak gradient of input resistance with distance from the axon origin is in agreement with the inverted gradient of I h (Fig. 2 H) where a higher I h density is observed close to the axon origin and a lower density at distal dendrites. The gradient of input resistance with distance from the axon origin was absent after the application of ZD 7288, confirming the influence of I h on R in along the somatodendritic domain of DA neurons. These results implicate that a reduced input resistance due to the presence of a high density of I h generates a membrane region near the location of the axon emergence with properties particular and distinct from those in the other parts of the somatodendritic domain.
DA neurons are known to display a prominent sag in the membrane potential in response to long hyperpolarizing current steps. We found that the amplitude of the local sag is constant along the somatodendritic domain of DA neurons (0.41 at the soma and 0.40 in dendrites). This homogeneity of the sag contrasts with the increase in sag amplitude with distance from the soma observed in L5 pyramidal neurons (Zhu, 2000) or CA1 pyramidal neurons (Magee, 1998) where a gradient of I h is present. The electrotonic compactness of DA neurons (Hausser et al. 1995; Hage & Khaliq, 2015) due to high input resistance is at least in part responsible for the homogeneous sag and tends to dampen a very strong location dependence of synaptic integration along the somatodendritic domain in the absence of I h.
The HCN subunits expressed in DA neurons of the substantia nigra are HCN2, HCN3 and HCN4, but not HCN1 (Franz et al. 2000; Santoro et al. 2000; Notomi & Shigemoto, 2004; Dufour et al. 2014). The absence of the HCN1 subunit is coherent with the slow activation of I h in DA neurons (Santoro et al. 2000; Chu & Zhen, 2010). These observations indicate that expression of HCN channel subunits in DA neurons differs strongly from those found in cortical, hippocampal or Purkinje neurons where HCN1 is expressed but not HCN4. However, whether I h in DA neurons is conferred by HCN2, HCN3 or HCN4 homomers or heteromers is unknown.
Physiological implications
The density of I h is high in axon‐bearing dendrites and probably even higher in the axon. This specific distribution of the channel seems to be only very weakly correlated with the effect of ZD 7288 on temporal summation observed along the somatodendritic axis of DA neurons. These observations along with the electrotonic compactness of these neurons and the homogeneous sag suggest that the influence of the site of high I h density is distributed over the whole somatodendritic domain via a “global” effect. These features may have several functional consequences both for physiological and for pathophysiological conditions. The pivotal position of I h around the axon origin, a location close to the site of AP initiation, may affect the EPSP‐spike coupling as described in pyramidal neurons (Shah et al. 2004), control the precision of EPSP–spike coupling (Gastrein et al. 2011) and bursting activity. In DA neurons, burst firing is reported to be driven by the temporal summation of NMDA receptor‐activated excitatory postsynaptic currents (Deister et al. 2009; Zweifel et al. 2009). The NMDA‐dependent bursting activity has been shown to be enhanced by blocking I h in nigral DA neurons (Mrejeru et al. 2011). The influence of I h on bursting activity will consequently affect the release of dopamine and the downstream coding of motor behaviours.
In the pathophysiological context, a study using an in vitro model of Parkinson's disease shows an increase in temporal summation in nigral DA neurons in the presence of a neurotoxin implicated in the inhibition of I h, which in turn may drive elevated excitability (Masi et al. 2013). Remarkably, alterations of h‐channels were also reported for external globus pallidus neurons where they influence the transition between bursting and pacemaking (Chan et al. 2011).
In the neighbouring ventral tegmental area DA neurons, h‐channels have been suggested to be located in the dendrites where they prevent the transition from spontaneous firing to bursting activity (Arencibia‐Albite et al. 2007). Accordingly, cocaine addiction inhibits I h and increases bursting probability (Arencibia‐Albite et al. 2012).
In conclusion, we report that I h channels are not uniformly distributed in the dendrites of nigral DA neurons but are concentrated in the dendrite carrying the axon. The activation of I h influences the time course of EPSPs over the entire somatodendritic domain of DA neurons. Temporal summation increases in the presence of ZD 7288 in dendrites but the effect of the I h blocker is similar in both types of dendrites. Input resistance is slightly lower around the axon origin probably due to the presence of I h. The strategic concentration of I h in the proximity of the axon probably influences strongly the coincidence detection time window for EPSPs and the EPSP–spike coupling and the downstream output signal of DA neurons (Sheets et al. 2011). Future investigations are necessary to determine the presence of I h in the axon and the relationship between the activity of the channel and the excitability of the axon (Elgueta et al. 2015) in order to understand the coding of AP output in DA neurons, which is critical for the control of voluntary movement.
Additional information
Competing interests
The authors declare that they have no competing interests.
Author contributions
D.E. and V.S. designed the experiments. D.E. performed the experiments. D.E. performed the data analysis and interpretation of data. D.E. wrote the manuscript. All the authors approved the manuscript for publication.
Funding
This work was supported by grants from the University of Liège (Fonds spéciaux de la Recherche, 2010) to D.E. and V.S., from the Belgian F.R.S. ‐ FNRS (U.N002.13 and T.N0015.13) to D.E. and V.S. and from the Belgian Science Policy (Interuniversity Attraction Poles program grant n° P7/10) to V.S.
Acknowledgements
We thank Drs Jochen Roeper, Alon Korngreen, Josef Bischofberger, Philippe Faure and Jean‐Marc Goaillard for helpful discussion, Drs Cheng‐Chang Lien and Jacqueline Scuvee for critically reading the manuscript, Christelle Gillissen and Laurent Massotte for excellent technical assistance and Dr Jean Defourny (GIGA‐Neurosciences) and Sandra Ormenese (GIGA‐imaging platform) for helping with the confocal microscope. We also thank Dr Jacques Destiné for the gift of the second Axopatch 200B amplifier and Dr Anne‐Françoise Donneau for advice on the statistical analysis.
References
- Angelo K, London M, Christensen SR & Hausser M (2007). Local and global effects of I h distribution in dendrites of mammalian neurons. J Neurosci 27, 8643–8653. [DOI] [PMC free article] [PubMed] [Google Scholar]
- Angelo K & Margrie TW (2011). Population diversity and function of hyperpolarization‐activated current in olfactory bulb mitral cells. Sci Rep 1, 1–11. [DOI] [PMC free article] [PubMed] [Google Scholar]
- Aponte Y, Lien CC, Reisinger E & Jonas P (2006). Hyperpolarization‐activated cation channels in fast‐spiking interneurons of rat hippocampus. J Physiol 574, 229–243. [DOI] [PMC free article] [PubMed] [Google Scholar]
- Arencibia‐Albite F, Paladini C, Williams JT & Jimenez‐Rivera CA (2007). Noradrenergic modulation of the hyperpolarization‐activated cation current (I h) in dopamine neurons of the ventral tegmental area. Neuroscience 149, 303–314. [DOI] [PMC free article] [PubMed] [Google Scholar]
- Arencibia‐Albite F, Vazquez R, Velasquez‐Martinez MC & Jimenez‐Rivera CA (2012). Cocaine sensitization inhibits the hyperpolarization‐activated cation current I h and reduces cell size in dopamine neurons of the ventral tegmental area. J Neurophysiol 107, 2271–2282. [DOI] [PMC free article] [PubMed] [Google Scholar]
- Atherton JF, Kitano K, Baufreton J, Fan K, Wokosin D, Tkatch T, Shigemoto R, Surmeier DJ & Bevan MD (2010). Selective participation of somatodendritic HCN channels in inhibitory but not excitatory synaptic integration in neurons of the subthalamic nucleus. J Neurosci 30, 16025–16040. [DOI] [PMC free article] [PubMed] [Google Scholar]
- Azene EM, Xue T & Li RA (2003). Molecular basis of the effect of potassium on heterologously expressed pacemaker (HCN) channels. J Physiol 547, 349–356. [DOI] [PMC free article] [PubMed] [Google Scholar]
- Berger T, Larkum ME & Luscher HR (2001). High I h channel density in the distal apical dendrite of layer V pyramidal cells increases bidirectional attenuation of EPSPs. J Neurophysiol 85, 855–868. [DOI] [PubMed] [Google Scholar]
- Bullis JB, Jones TD & Poolos NP (2007). Reversed somatodendritic I h gradient in a class of rat hippocampal neurons with pyramidal morphology. J Physiol 579, 431–443. [DOI] [PMC free article] [PubMed] [Google Scholar]
- Cathala L & Paupardin‐Tritsch D (1997). Neurotensin inhibition of the hyperpolarization‐activated cation current (I h) in the rat substantia nigra pars compacta implicates the protein kinase C pathway. J Physiol 503, 87–97. [DOI] [PMC free article] [PubMed] [Google Scholar]
- Chan CS, Glajch KE, Gertler TS, Guzman JN, Mercer JN, Lewis AS, Goldberg AB, Tkatch T, Shigemoto R, Fleming SM, Chetkovich DM, Osten P, Kita H & Surmeier DJ (2011). HCN channelopathy in external globus pallidus neurons in models of Parkinson's disease. Nat Neurosci 14, 85–92. [DOI] [PMC free article] [PubMed] [Google Scholar]
- Chu HY & Zhen X (2010). Hyperpolarization‐activated, cyclic nucleotide‐gated (HCN) channels in the regulation of midbrain dopamine systems. Acta Pharmacol Sin 31, 1036–1043. [DOI] [PMC free article] [PubMed] [Google Scholar]
- Deister CA, Teagarden MA, Wilson CJ & Paladini CA (2009). An intrinsic neuronal oscillator underlies dopaminergic neuron bursting. J Neurosci 29, 15888–15897. [DOI] [PMC free article] [PubMed] [Google Scholar]
- Drummond GB (2009). Reporting ethical matters in the Journal of Physiology: standards and advice. J Physiol 587, 713–719. [DOI] [PMC free article] [PubMed] [Google Scholar]
- Dufour MA, Woodhouse A & Goaillard JM (2014). Somatodendritic ion channel expression in substantia nigra pars compacta dopaminergic neurons across postnatal development. J Neurosci Res 92, 981–999. [DOI] [PubMed] [Google Scholar]
- Elgueta C, Kohler J & Bartos M (2015). Persistent discharges in dentate gyrus perisoma‐inhibiting interneurons require hyperpolarization‐activated cyclic nucleotide‐gated channel activation. J Neurosci 35, 4131–4139. [DOI] [PMC free article] [PubMed] [Google Scholar]
- Franz O, Liss B, Neu A & Roeper J (2000). Single‐cell mRNA expression of HCN1 correlates with a fast gating phenotype of hyperpolarization‐activated cyclic nucleotide‐gated ion channels (I h) in central neurons. Eur J Neurosci 12, 2685–2693. [DOI] [PubMed] [Google Scholar]
- Gastrein P, Campanac E, Gasselin C, Cudmore RH, Bialowas A, Carlier E, Fronzaroli‐Molinieres L, Ankri N & Debanne D (2011). The role of hyperpolarization‐activated cationic current in spike‐time precision and intrinsic resonance in cortical neurons in vitro . J Physiol 589, 3753–3773. [DOI] [PMC free article] [PubMed] [Google Scholar]
- Gentet LJ & Williams SR (2007). Dopamine gates action potential backpropagation in midbrain dopaminergic neurons. J Neurosci 27, 1892–1901. [DOI] [PMC free article] [PubMed] [Google Scholar]
- George MS, Abbott LF & Siegelbaum SA (2009). HCN hyperpolarization‐activated cation channels inhibit EPSPs by interactions with M‐type K+ channels. Nat Neurosci 12, 577–584. [DOI] [PMC free article] [PubMed] [Google Scholar]
- Hage TA & Khaliq ZM (2015). Tonic firing rate controls dendritic Ca2+ signaling and synaptic gain in substantia nigra dopamine neurons. J Neurosci 35, 5823–5836. [DOI] [PMC free article] [PubMed] [Google Scholar]
- Harris NC & Constanti A (1995). Mechanism of block by ZD 7288 of the hyperpolarization‐activated inward rectifying current in guinea pig substantia nigra neurons in vitro. J Neurophysiol 74, 2366–2378. [DOI] [PubMed] [Google Scholar]
- Hausser M, Stuart G, Racca C & Sakmann B (1995). Axonal initiation and active dendritic propagation of action potentials in substantia nigra neurons. Neuron 15, 637–647. [DOI] [PubMed] [Google Scholar]
- He C, Chen F, Li B & Hu Z (2014). Neurophysiology of HCN channels: from cellular functions to multiple regulations. Prog Neurobiol 112, 1–23. [DOI] [PubMed] [Google Scholar]
- Kole MH, Hallermann S & Stuart GJ (2006). Single I h channels in pyramidal neuron dendrites: properties, distribution, and impact on action potential output. J Neurosci 26, 1677–1687. [DOI] [PMC free article] [PubMed] [Google Scholar]
- Kotter R & Feizelmeier M (1998). Species‐dependence and relationship of morphological and electrophysiological properties in nigral compacta neurons. Prog Neurobiol 54, 619–632. [DOI] [PubMed] [Google Scholar]
- Lacey MG, Mercuri NB & North RA (1989). Two cell types in rat substantia nigra zona compacta distinguished by membrane properties and the actions of dopamine and opioids. J Neurosci 9, 1233–1241. [DOI] [PMC free article] [PubMed] [Google Scholar]
- London M & Hausser M (2005). Dendritic computation. Annu Rev Neurosci 28, 503–532. [DOI] [PubMed] [Google Scholar]
- Lorincz A, Notomi T, Tamas G, Shigemoto R & Nusser Z (2002). Polarized and compartment‐dependent distribution of HCN1 in pyramidal cell dendrites. Nat Neurosci 5, 1185–1193. [DOI] [PubMed] [Google Scholar]
- Maccaferri G & McBain CJ (1996). The hyperpolarization‐activated current (I h) and its contribution to pacemaker activity in rat CA1 hippocampal stratum oriens‐alveus interneurones. J Physiol 497, 119–130. [DOI] [PMC free article] [PubMed] [Google Scholar]
- Magee JC (1998). Dendritic hyperpolarization‐activated currents modify the integrative properties of hippocampal CA1 pyramidal neurons. J Neurosci 18, 7613–7624. [DOI] [PMC free article] [PubMed] [Google Scholar]
- Masi A, Narducci R, Landucci E, Moroni F & Mannaioni G (2013). MPP+‐dependent inhibition of I h reduces spontaneous activity and enhances EPSP summation in nigral dopamine neurons. Br J Pharmacol 169, 130–142. [DOI] [PMC free article] [PubMed] [Google Scholar]
- Medinilla V, Johnson O & Gasparini S (2013). Features of proximal and distal excitatory synaptic inputs to layer V neurons of the rat medial entorhinal cortex. J Physiol 591, 169–183. [DOI] [PMC free article] [PubMed] [Google Scholar]
- Mercuri NB, Bonci A, Calabresi P, Stefani A & Bernardi G (1995). Properties of the hyperpolarization‐activated cation current I h in rat midbrain dopaminergic neurons. Eur J Neurosci 7, 462–469. [DOI] [PubMed] [Google Scholar]
- Mereu G, Costa E, Armstrong DM & Vicini S (1991). Glutamate receptor subtypes mediate excitatory synaptic currents of dopamine neurons in midbrain slices. J Neurosci 11, 1359–1366. [DOI] [PMC free article] [PubMed] [Google Scholar]
- Mrejeru A, Wei A & Ramirez JM (2011). Calcium‐activated non‐selective cation currents are involved in generation of tonic and bursting activity in dopamine neurons of the substantia nigra pars compacta. J Physiol 589, 2497–2514. [DOI] [PMC free article] [PubMed] [Google Scholar]
- Nedergaard S & Hounsgaard J (1996). Fast Na+ spike generation in dendrites of guinea‐pig substantia nigra pars compacta neurons. Neuroscience 73, 381–396. [DOI] [PubMed] [Google Scholar]
- Neuhoff H, Neu A, Liss B & Roeper J (2002). I h channels contribute to the different functional properties of identified dopaminergic subpopulations in the midbrain. J Neurosci 22, 1290–1302. [DOI] [PMC free article] [PubMed] [Google Scholar]
- Notomi T & Shigemoto R (2004). Immunohistochemical localization of I h channel subunits, HCN1–4, in the rat brain. J Comp Neurol 471, 241–276. [DOI] [PubMed] [Google Scholar]
- Nusser Z (2009). Variability in the subcellular distribution of ion channels increases neuronal diversity. Trends Neurosci 32, 267–274. [DOI] [PubMed] [Google Scholar]
- Ramon y Cajal S (1911). Histologie du Système Nerveux de l'Homme et des Vertébrés. Maloine, Paris. [Google Scholar]
- Rosenkranz JA & Johnston D (2006). Dopaminergic regulation of neuronal excitability through modulation of I h in layer V entorhinal cortex. J Neurosci 26, 3229–3244. [DOI] [PMC free article] [PubMed] [Google Scholar]
- Sakmann B & Neher E (1995). Single‐channel recording, 2nd edn. Plenum Press, New York. [Google Scholar]
- Santoro B, Chen S, Luthi A, Pavlidis P, Shumyatsky GP, Tibbs GR & Siegelbaum SA (2000). Molecular and functional heterogeneity of hyperpolarization‐activated pacemaker channels in the mouse CNS. J Neurosci 20, 5264–5275. [DOI] [PMC free article] [PubMed] [Google Scholar]
- Shah MM (2014). Cortical HCN channels: function, trafficking and plasticity. J Physiol 592, 2711–2719. [DOI] [PMC free article] [PubMed] [Google Scholar]
- Shah MM, Anderson AE, Leung V, Lin X & Johnston D (2004). Seizure‐induced plasticity of h channels in entorhinal cortical layer III pyramidal neurons. Neuron 44, 495–508. [DOI] [PMC free article] [PubMed] [Google Scholar]
- Sheets PL, Suter BA, Kiritani T, Chan CS, Surmeier DJ & Shepherd GM (2011). Corticospinal‐specific HCN expression in mouse motor cortex: I h‐dependent synaptic integration as a candidate microcircuit mechanism involved in motor control. J Neurophysiol 106, 2216–2231. [DOI] [PMC free article] [PubMed] [Google Scholar]
- Shu Y, Hasenstaub A, Duque A, Yu Y & McCormick DA (2006). Modulation of intracortical synaptic potentials by presynaptic somatic membrane potential. Nature 441, 761–765. [DOI] [PubMed] [Google Scholar]
- Soleng AF, Chiu K & Raastad M (2003). Unmyelinated axons in the rat hippocampus hyperpolarize and activate an H current when spike frequency exceeds 1 Hz. J Physiol 552, 459–470. [DOI] [PMC free article] [PubMed] [Google Scholar]
- Spruston N & Johnston D (1992). Perforated patch‐clamp analysis of the passive membrane properties of three classes of hippocampal neurons. J Neurophysiol 67, 508–529. [DOI] [PubMed] [Google Scholar]
- Svoboda KR & Lupica CR (1998). Opioid inhibition of hippocampal interneurons via modulation of potassium and hyperpolarization‐activated cation (I h) currents. J Neurosci 18, 7084–7098. [DOI] [PMC free article] [PubMed] [Google Scholar]
- Tepper JM, Damlama M & Trent F (1994). Postnatal changes in the distribution and morphology of rat substantia nigra dopaminergic neurons. Neuroscience 60, 469–477. [DOI] [PubMed] [Google Scholar]
- Tepper JM, Sawyer SF & Groves PM (1987). Electrophysiologically identified nigral dopaminergic neurons intracellularly labeled with HRP: light‐microscopic analysis. J Neurosci 7, 2794–2806. [DOI] [PMC free article] [PubMed] [Google Scholar]
- Vervaeke K, Lorincz A, Nusser Z & Silver RA (2012). Gap junctions compensate for sublinear dendritic integration in an inhibitory network. Science 335, 1624–1628. [DOI] [PMC free article] [PubMed] [Google Scholar]
- Watabe‐Uchida M, Zhu L, Ogawa SK, Vamanrao A & Uchida N (2012). Whole‐brain mapping of direct inputs to midbrain dopamine neurons. Neuron 74, 858–873. [DOI] [PubMed] [Google Scholar]
- Williams SR & Stuart GJ (2000). Site independence of EPSP time course is mediated by dendritic I h in neocortical pyramidal neurons. J Neurophysiol 83, 3177–3182. [DOI] [PubMed] [Google Scholar]
- Zhu JJ (2000). Maturation of layer 5 neocortical pyramidal neurons: amplifying salient layer 1 and layer 4 inputs by Ca2+ action potentials in adult rat tuft dendrites. J Physiol 526 Pt 3, 571–587. [DOI] [PMC free article] [PubMed] [Google Scholar]
- Zhu JJ, Uhlrich DJ & Lytton WW (1999). Properties of a hyperpolarization‐activated cation current in interneurons in the rat lateral geniculate nucleus. Neuroscience 92, 445–457. [DOI] [PubMed] [Google Scholar]
- Zolles G, Wenzel D, Bildl W, Schulte U, Hofmann A, Müller CS, Thumfart JO, Vlachos A, Deller T, Pfeifer A, Fleischmann BK, Roeper J, Fakler B & Klöcker N (2009). Association with the auxiliary subunit PEX5R/Trip8b controls responsiveness of HCN channels to cAMP and adrenergic stimulation. Neuron 62, 814–825. [DOI] [PubMed] [Google Scholar]
- Zweifel LS, Parker JG, Lobb CJ, Rainwater A, Wall VZ, Fadok JP, Darvas M, Kim MJ, Mizumori SJ, Paladini CA, Phillips PE & Palmiter RD (2009). Disruption of NMDAR‐dependent burst firing by dopamine neurons provides selective assessment of phasic dopamine‐dependent behavior. Proc Natl Acad Sci USA 106, 7281–7288. [DOI] [PMC free article] [PubMed] [Google Scholar]