Abstract
A new class of advanced structural materials, based on the Fe-O-vacancy system, has exceptional resistance to high-temperature creep and excellent tolerance to extremely high-dose radiation. Although these remarkable improvements in properties compared to steels are known to be associated with the Y-Ti-O-enriched nanoclusters, the roles of vacancies in facilitating the nucleation of nanoclusters are a long-standing puzzle, due to the experimental difficulties in characterizing vacancies, particularly in-situ while the nanoclusters are forming. Here we report an experiment study that provides the compelling evidence for the presence of significant concentrations of vacancies in Y-Ti-O-enriched nanoclusters in a nanostructured ferritic alloy using a combination of state-of-the-art atom-probe tomography and in situ small angle neutron scattering. The nucleation of nanoclusters starts from the O-enriched solute clustering with vacancy mediation. The nanoclusters grow with an extremely low growth rate through attraction of vacancies and O:vacancy pairs, leading to the unusual stability of the nanoclusters.
A high density of Y-Ti-O-enriched nanoclusters (NCs) has been recently recognized to play a key role in the design of a promising new class of advanced structural materials with exceptional resistance to high-temperature creep and excellent tolerances to high-dose radiation1,2,3,4,5. These NCs improve the alloy’s creep resistance by six orders of magnitude between the temperatures 650–900 °C6,7 and also present an extremely high resistance to coarsening and dissolution under displacement cascade damage in harsh particle irradiation environments8.
Y-Ti-O-enriched NCs have been extensively investigated. Atom probe tomography (APT) has revealed that these clusters are extremely fine with diameters of 1–4 nm, and are basically composed of Y, Ti and O, as well as significant amounts of Fe and Cr2,9,10,11,12. Small angle neutron scattering (SANS) has also revealed that the number densities and volume fractions of the NCs decreased, and their radii increased, with increasing consolidation temperature12. The NCs have a defective NaCl structure and a strong structural affinity with the bcc matrix, as determined through a combination of scanning transmission electron microscopy (STEM) observation and theoretical simulation1. This defective structure involves large amount of vacancies. The NCs were found to be coherent with the Fe matrix, with truncated rhombic dodecahedron morphologies defined by the {100} and {110} planes12. The current knowledge of the NCs in ferritic alloys was mostly obtained from hot-extruded alloys9,13,14,15. However, a crucial aspect of the formation and stability of Y-Ti-O enriched NCs is imparted by the mechanical alloying process, which provides the mechanism by which Y2O3 is forced in solid solution as dissociated Y and O atoms. Mechanical alloying also introduces a large number of vacancies9,16.
Vacancies-assisted nucleation of precipitates has been intensively investigated in variety of materials, from the nucleation and growth of intermetallic nanoclusters on oxide surfaces in metal catalysts system17,18,19,20 to oxides in silicon crystals21,22,23 and Magnetic monopoles in spin ice24. The effects of vacancy on the nucleation of nanoclusters are strongly dependent on the vacancy configurations, content, and the affinity between vacancy and solute atoms22,23. Vacancy defects are also known to have a strong influence on the magnetism in oxygen-deficient pyrochlores (Y2Ti2O7), a spin-ice material24.
Vacancy clusters containing four to six vacancies have been found in the mechanical alloyed (MA) and extruded oxide dispersion strengthened (ODS) ferritic alloy by positron-life time spectroscopy14. The results from positron annihilation life-time studies in ODS steels with and without nanoclusters indicated that positron annihilations occur at high densities of Y-Ti-O enriched nm-scale features, dislocations or in large caviaties or Ar bublles25,26. It has been proposed that vacancies can be exploited as a constitutive element in this alloy11. As the vacancies are an important factor in the formation and stability of NCs, it is vitally important to characterize the vacancy content within the NCs. Positron-lifetime spectroscopy can prove only the existence of vacancies in the alloy, but not their local distributions. Although the NCs have been extensively characterized in ferritic alloys by APT and SANS27, neither of these techniques alone can provide a complete characterization of the distribution of the vacancies. In this letter, a thorough study of the NCs is conducted with a combination of in situ SANS and APT. The complementary nature of composition-sensitive APT and size-sensitive SANS, provides compelling evidence of the existence of a large number of vacancies in the NCs as a constitutive element. The vacancy concentration was found to vary with annealing time and tends towards approaching the O concentration in the NCs.
Results
Morphology and composition of Nanoclusters
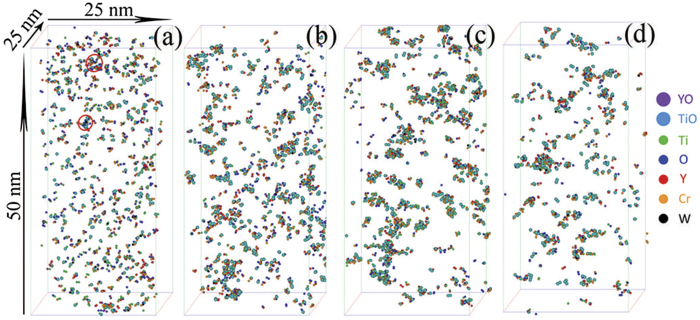
Atom maps for the as-milled (MA) and annealed specimens are shown in Fig. 1. High number densities of Ti-Y-O-enriched solute clusters, along with some larger Ti-Y-O-enriched NCs, were identified in the MA specimen (Fig. 1a). This result indicates that either mechanical alloying for 40 h was not sufficient to disperse the solutes randomly, or that some solute clustering occurred during the process. Annealing the MA material for 1 h leads to the formation of large number densities of Y-Ti-O-enriched NCs (Fig. 1b). There was no apparent growth or coarsening of the NCs during annealing for up to 24 h (Fig. 1c,d) demonstrating their ultrahigh stability. The compositions of the clusters following various annealing times are summarized in Fig. 2. In the MA specimen, the solute clusters have significant levels of Fe. After annealing for 1 h, the level of Fe decreases and the concentrations of Y, Ti, and O are ~4, ~12.5 and ~12.5 at.%, respectively. The O/Y ratio is ~3, indicating that mechanical alloying forced the atoms of the Y2O3 powder into solid solution. This result is consistent with the results observed for hot-extruded specimens2,28. The Ti/Y and Ti/O ratios are ~3 and ~1, respectively, which indicate that the NCs are not Y2Ti2O7, Y2TiO5, or TiO2 phase29, consistent with previous APT results11. The concentrations of all the elements in the NCs do not change significantly after annealing between 1 and 24 h; however, the overall concentrations of the Y, Ti, and O in the NCs for the MA material are much lower than those in the extruded specimens, where the O and Ti contents can each approach ~40 at. %28,30. This result indicates that the formation of Y-Ti-O-enriched NCs for the short aging times at 500 °C within the MA material is still in the early stage.
Figure 1.
(Zhang). Atom maps revealing the formation of Y-Ti-O enriched nanoclusters in the as-milled specimen (a) and the specimens annealed at 500°C for (b) 1 h, (c) 10 h, and (d) 24 h. Solute clustering occur during mechanical alloying and some large solute clusters nucleate, forming the Ti-Y-O nanoclusters (circled in Fig. 1a).
Figure 2.
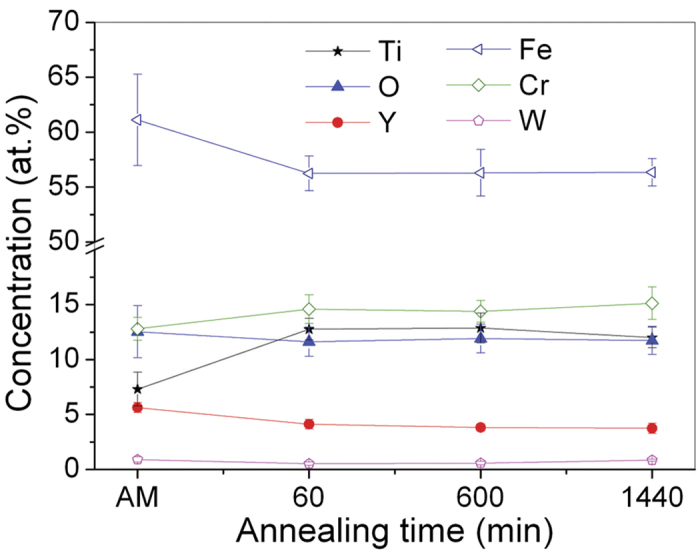
(Zhang) Composition profiles showing the compositions of clusters under various conditions.
Cluster size and volume fraction of nanoclusters
Typical in situ SANS data are presented in Fig. 3a. The temperature profile during in situ SANS measurement is shown in Fig. 3b. The SANS data can be modeled as the sum of two terms:
 |
where IL(Q) accounts for the scattering at low scattering vector Q, which is dominated by Porod power-law scattering31, with
 |
and IH(Q) describes the scattering from NCs with a polydisperse log-normal size distribution32,
 |
where R is the cluster radius, and V(R) the cluster volume. F(Q,R) is the form factor, which can be expressed as F(Q,R) =3(sin(QR) −QRcos(QR))/(QR)3 for spherical nanoscale clusters. The log-normal size distribution function N(R) is given by32,
 |
where N0 is the total number of clusters per unit volume, R0 is the mean radius, and σ is the polydispersity of the clusters. This polydisperse log-normal size distribution of NCs is verified by the APT results. Δρ = ρm −ρc is the difference in scattering length density between the NC ρc and the matrix ρm. With this polydisperse log-normal size distribution of NCs, the mean NC radius is evaluated as <R>=exp(ln(R0)+σ2/2), the mean volume of NCs <V>=4π/3exp(3ln(R0)+9σ2/2), and the volume fraction of NCs in the materials ∅ = N0<V>.
Figure 3.
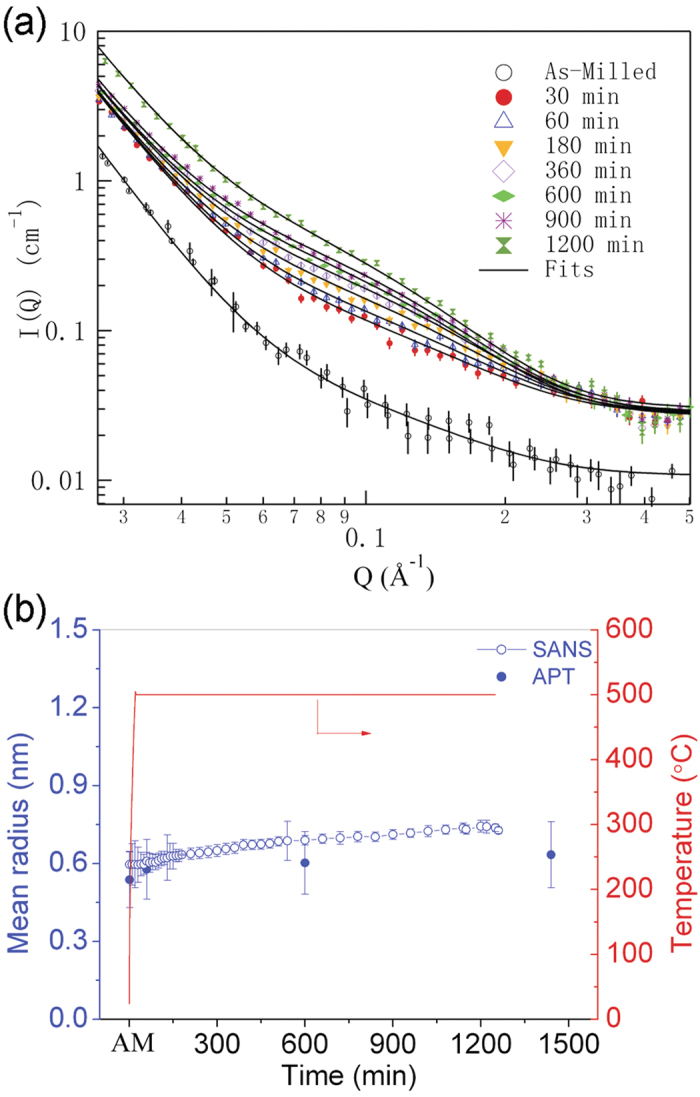
(Zhang). (a) Selected SANS-intensity distribution as a function of scattering vector. The solid lines denote the fitting results. (b) The nanocluster size determined by in situ SANS as a function of annealing time, along with independent estimates from APT data. The temperature profile for in situ SANS measurements is also shown in Fig. 3b.
Validation of this model was first verified with the wide Q range data obtained before and after in-situ annealing. The Porod power-law scattering at low-Q gives an exponent ~5 and ~4 before and after in-situ annealing, respectively (see supplementary Fig. S1). This result indicates that the scattering at low-Q arises mainly from grain boundaries33. Satisfactory fits to the in situ SANS data are obtained with Eq. (1), and are shown in Fig. 2a. The size of the NCs is plotted in Fig. 3b, as a function of annealing time, along with independent size estimates from APT data. The sizes determined from SANS are slightly larger than that determined from the APT data. The APT data shows the NC size increasing slightly after annealing for 1 h as compared to NCs in the MA specimen. This difference arises because of the large number of extremely small solute embryos that co-exist with nucleated NCs and cannot be effectively differentiated. There is no obvious increase in NC size with increasing annealing times up to 24 h; the NC size determined from in situ SANS increased by only 0.2 nm. Both APT and SANS data provide clear evidence that the NCs in this alloy are extremely stable during annealing, a trend that is quite different from conventional precipitates, such as Cu-enriched NCs in other ferritic alloys, where the cluster size can increase by a factor of two under similar annealing conditions27.
With the sizes of the NCs determined from in situ SANS, the volume fraction of NCs determined from the APT data was modified because the size in SANS is independent of the composition and therefore, more reliable. The modified volume fraction is shown in Fig. 4. The modified volume fractions were fit using the John-Mehl-Avrami (JMA) transformation theory, which estimates the volume fraction of transformed phase as x(t)=1−exp(−k(t−t0)n). Satisfactory fits to the modified volume fractions are shown in Fig. 4 (the solid line). The fit yields an exponent n = 0.142 ± 0.004, which is often used to characterize the mechanism(s) of phase transformation. The value of n decreases to 0.5 when diffusion zones start to overlap (soft impingement) and the transformation rate is retarded34, thus, a value of n = 0.142 indicates that the NC diffusion zones overlap, which is reasonable in view of the high density of NCs (up to ~1025 m−3).
Figure 4.
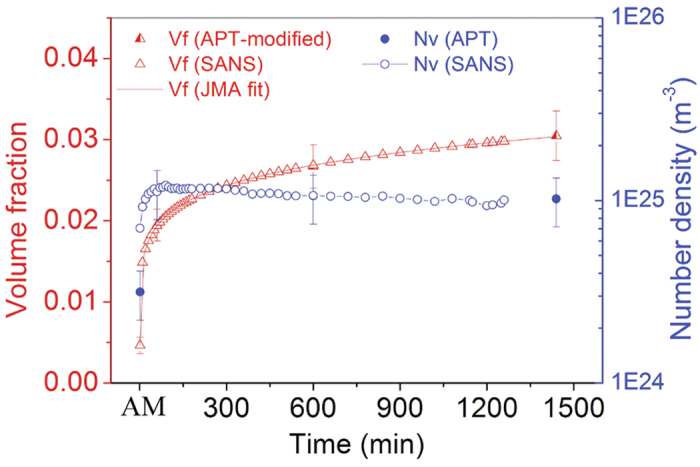
(Zhang). The number density and volume fraction determined from SANS and APT data. The solid line denotes the John-Mehl-Avrami (JMA) fitting results. The fit yielded an exponent n = 0.142 ± 0.004.
Vacancy concentration in nanoclusters.
φ and Δρ2 are multiplicative factors and are perfectly correlated in the model32. The product between φ and Δρ2, φ * Δρ2, can be determined by fitting the SANS data using the proposed model (Eq. (5)). The fitting results of product between φ and Δρ2 as a function of annealing time are shown in Fig. 5a. By establishing the NC volume fraction, φ as a function of annealing time (Fig. 4), alone with the product from the SANS data fitting (Fig. 5a), the difference in scattering length density Δρ2 can be determined.
Figure 5.
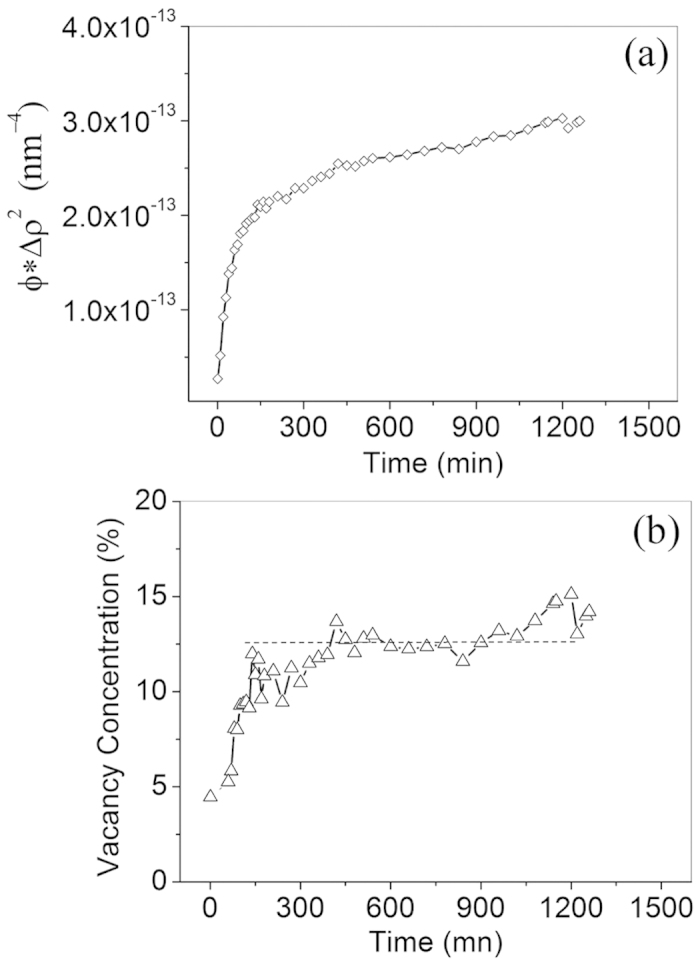
(Zhang). (a) Product of volume fraction of clusters, φ and the difference in scattering length density of alloy matrix and clusters Δρ2 as a function of annealing time. φ and Δρ2 are multiplicative factors and are perfectly correlated. The product of φ and Δρ2 is responsible for the scattering intensity and determined by fitting SANS data. (b) Vacancy concentration in nanoclusters as a function of annealing time.
The scattering length densities of matrix, ρm and clusters, ρc can be calculated, as,
 |
where bi is the bound coherent scattering length for element i, and Xi is the atom fraction of that element in the matrix or NCs. Va is the average atomic volume. The average atomic volume of elements in matrix is evaluated based on the body-centered cubic (BCC) structure of Fe and the matrix composition determined by APT are used to calculate the scattering length density of matrix. The effect of vacancy on the scattering length densities of matrix ρm can be neglected because of the very small amount of vacancies in matrix, as compared to Fe content. With the difference in scattering length density Δρ2 and the scattering length densities of matrix ρm, the scattering length densities of clusters, ρc can be determined.
In this study, the vacancy is defined as an imperfection resulting from an unoccupied element position. To determine vacancy concentration, vacancy in NCs is treated as a constitutive/solute element11 and the bound coherent scattering length of vacancy was set to 0. It is well known that atomic volume of elements can be highly sensitive to electronic bonding configuration/oxidation state, as well as mediated by a high-degree of lattice strain35. In general, the determination of individual atom volume in crystals is also dependent on the structural information, such as packing density36. However, the atomic structures of the nanoclusters are complicated and very difficult to characterize1. To copy with this difficulty, two cases with and without vacancy in clusters are proposed (Case 1 and 2 in supplementary materials) to evaluate the effect of vacancies on the fitting results of volume fraction and the average atomic volume in NCs. The vacancy volume is assumed to be the average atomic volume of elements in the NCs. The corresponding vacancy concentrations are determined, as shown in Fig. 5b. These results provide compelling evidence that a significant number of vacancies are associated with the NCs. the vacancy concentration varies with annealing time. In the MA condition, the vacancy concentration is ~5%, far lower than in the steady state condition. After annealing for 2 h, the vacancy concentration tends towards a steady state value of ~12.5%, which is comparable to the O concentration in the NCs.
Discussion
The vacancy-assisted nucleation and/or aggregation behavior of clusters have been demonstrated to be influenced by both energetics and kinetics17. For instance, the vacancy site on rutile TiO2 surface are generally believed to serve as nucleation sites that attract metal adatoms diffusing on the surface due to strong binding of vacancy to adatoms. The kinetic effects tend to favor the aggregation of mobile adatoms at nucleation sites with higher adoption energies through fast diffusion channels17,18. In As- and Sb-doped silicon crystals, it is energetically favorable to form dopant-vacancy-O complexes, which act as precursors for oxide precipitate nucleation under appropriate conditions21,22,23. Although O normally has an extremely low solubility in α-Fe, it is highly supersaturated in the α-Fe matrix of these nanostructure ferritic alloys due to the mechanical alloying process. Annealing accelerates oxygen clustering (Fig. 1). The nucleation of NCs is initiated by solute clustering, specifically O clustering with Ti, Y, and vacancies. This leads to a lower vacancy concentration during the initial nucleation stage (Fig. 5b). First principle calculations of the binding energies between vacancies, oxygen and other solute atoms in ODS 14YWT systems indicates that vacancies have an exceptionally high affinity for O35. The exceptionally strong binding between O atoms and vacancies significantly enhances the formation of oxygen: vacancy (O: vac.) pairs, similar to the dopant-vacancy-O complexes in doped silicon crystal systems. Once an O: vac. pair is formed during the annealing step, O atoms and vacancies move together as a unit37, which restricts diffusion and contributes to the ultrahigh stability of the NCs38. The continuous increase in NC vacancy concentration during the initial stage of nucleation indicates that the O: vac. pairs are prone to migrate to the NCs, leading to the similar contents of O atoms and vacancies in the NCs (Figs. 2,5b). With the formation of O-vac. pairs, Ti and Y solutes are also attracted to NCs to minimize energy, as Ti and Y have higher affinities for O than Fe, and thereby restrict the formation of TiO211,37. The attraction of NCs to vacancies is also believed to be an important factor in the formation of NCs with the defective structure, and consequently, the unusual stability of the NCs at high temperatures and under intense neutron radiation1,9,39,40.
In summary, this proof-of-concept study provides compelling evidence of the existence of vacancies as constitutive elements in NCs formed in the nanostructured ferritic ODS alloy, 14YWT. Vacancies play an indispensable role in the formation of Y-Ti-O-enriched NCs and are responsible for their ultrahigh stability. The nucleation of NCs initiates from O-enriched solute clustering in the ferrite. The NCs attract vacancies and O:vac. pairs during the initial stage of nucleation and proceed to grow during annealing. The NCs have an extremely low growth rate due to the low O mobility. The vacancy content in the clusters can be compared to the O and Ti concentration when the migration of a vacancy is replaced by an O:vac. pair. The combination of APT and in situ SANS can be used to evaluate the vacancy concentration in the NCs, and should find broad applications in the study of nucleation in other vacancy-related physical systems. In addition, control of the diffusion via oxygen-vacancy-solute interactions provides a new path for alloy design in ferritic and other systems.
Methods
The ODS 14YWT ferritic alloy (nominal composition: Fe-14Cr-3W-0.4Ti (wt.%) with 0.25wt.% Y2O3) was selected for the experimental investigation. The ferritic 14YWT alloy was processed by mechanical alloying for 40 h using attrition milling in an argon atmosphere in a water-cooled vessel. The MA flakes were used to perform the in situ SANS and APT measurements. As the NCs are formed during the hot extrusion consolidation process, the MA flakes were studied prior to hot-extrusion, such that the formation of the NCs can be tailored accurately for both temperature and time schemes. The as-milled powders were annealed at 500 °C for 1 h, 10 h and 24 h, to study the different stages of precipitation using APT. A CAMECA Instruments Inc. LEAP™ 4000X HR local electrode atom probe was used to determine the NC composition, morphology and the distribution of solutes31. The focused-ion-beam–based APT sample preparation and data analysis methods are described elsewhere41. The number of atoms collected from APT was estimated based on the calibrated detection efficiency of the single atom detector. No evidence of ion trajectory crossings were encountered in this ODS material from field ion microscopy images and field evaporation images. The atom number and composition in a nanocluster are determined by APT through an average of hundreds of clusters. To reveal the formation process of the NCs, in situ SANS experiments were conducted at the CG-2 beamline at the High Flux Isotope Reactor (HFIR) at Oak Ridge National Laboratory (ORNL). The as-milled powders were compacted at room temperature into 10 mm diameter and 1 mm thick samples for the in situ SANS measurement, which were conducted at 500 °C for up to 20 h. High-quality SANS data were collected with a detector-sample distance of 1.5 m and 4.75 Å neutrons. The SANS data were corrected for the density of the compacted powder, transmission, background, empty beam scattering, detector sensitivity, and placed on an absolute scale using the direct beam method. Thus, the scattering intensity from the reduced data directly represents the differential macroscopic scattering cross-section.
Additional Information
How to cite this article: Zhang, Z. W. et al. Vacancy-controlled ultrastable nanoclusters in nanostructured ferritic alloys. Sci. Rep. 5, 10600; doi: 10.1038/srep10600 (2015).
Supplementary Material
Acknowledgments
This research was supported by the U.S. Department of Energy (DOE), Office of Basic Energy Sciences (BES), Materials Sciences and Engineering Division. Atom probe tomography research (L. Y., MKM) was supported through a user project at ORNL’s Center for Nanophase Materials Sciences (CNMS), Scientific User Facilities Division, BES-DOE, and the neutron scattering work (ZWZ, XLW, KCL, QL) at the High Flux Isotope Reactor, was sponsored by the Scientific User Facilities Division, BES-DOE. ZWZ was supported by the Fundamental Research Funds for the Central Universities (HEUCFZ1308, HEUCFT1306), the NSFC Funding (51171081, 51371062 and U1460102), NSFHLJ (ZD201411) and the Project 2013DB04 at NPL, CAEP. The authors thank K. C. Littrell, and Q. Li for their invaluable assistance with the neutron scattering experiments, and D. Ma for comments on the manuscript.
Footnotes
Author Contributions Z. W. Z. and X. L. W. designed and coordinated the experimental study. ZWZ collected and analyzed the SANS data, discussed the results and drafted the manuscript. L. Y. collected and analyzed APT data and discussed the results. M. K. M. helped with the APT experiments and discussed the results. X. L. W. discussed the results and helped in drafting the manuscript. All authors read and commented on the manuscript.
References
- Hirata A. et al. Atomic structure of nanoclusters in oxide-dispersion-strengthened steels. Nat. Mater. 10, 922–926 (2011). [DOI] [PubMed] [Google Scholar]
- Alinger M.J., Odette G.R. & Hoelzer D.T. On the role of alloy composition and processing parameters in nanocluster formation and dispersion strengthening in nanostuctured ferritic alloys. Acta Mater. 57, 392–406 (2009). [Google Scholar]
- Hayashi T., Sarosi P.M., Schneibel J.H. & Mills M.J. Creep response and deformation processes in nanocluster-strengthened ferritic steels. Acta. Mater. 56, 1407–1416 (2008). [Google Scholar]
- Stoica G. M., A.D.S., Miller M. K., Ma D. Temperature-dependent elastic anisotropy and mesoscale deformation in a nanostructured ferritic alloy. Nat. Commun. 5, 5178, 5110.1038/ncomms6178 (2014). [DOI] [PubMed] [Google Scholar]
- Brandes M. C., Kovarik L., Miller M. K., Daehn G. S. & Mills M. J. Creep behavior and deformation mechanisms in a nanocluster strengthened ferritic steel. Acta. Mater. 60, 1827–1839 (2012). [Google Scholar]
- Klueh R. L. et al. Tensile and creep properties of an oxide dispersion-strengthened ferritic steel. J. Nucl. Mater. 307-311, Part 1, 773–777 (2002). [Google Scholar]
- Ukai S. & Fujiwara M. Perspective of ODS alloys application in nuclear environments. J. Nucl. Mater. 307, 749–757 (2002). [Google Scholar]
- Odette G. R., Alinger M. J. & Wirth B. D. Recent developments in irradiation-resistant steels. Annu Rev. Mater. Res. 38, 471–503 (2008). [Google Scholar]
- Brocq M. et al. Nanoscale characterisation and clustering mechanism in an Fe–Y2O3 model ODS alloy processed by reactive ball milling and annealing. Acta. Mater. 58, 1806–1814 (2010). [Google Scholar]
- Miller M. K. & Zhang Y. Fabrication and characterization of APT specimens from high dose heavy ion irradiated materials. Ultramicroscopy 111, 672–675 (2011). [DOI] [PubMed] [Google Scholar]
- Miller M., Fu C., Krcmar M., Hoelzer D. & Liu C. Vacancies as a constitutive element for the design of nanocluster-strengthened ferritic steels. Fron Mater. Sci. in Chi. 3, 9–14 (2009). [Google Scholar]
- Brandes M. C., Kovarik L., Miller M. K. & Mills M. J. Morphology, structure, and chemistry of nanoclusters in a mechanically alloyed nanostructured ferritic steel. J. Mater. Sci. 47, 3913–3923 (2012). [Google Scholar]
- Sakasegawa H. et al. Precipitation behavior of oxide particles in mechanically alloyed powder of oxide-dispersion-strengthened steel. J. Alloy Compd. 452, 2–6 (2008). [Google Scholar]
- Xu J., Liu C. T., Miller M. K. & Chen H. M. Nanocluster-associated vacancies in nanocluster-strengthened ferritic steel as seen via positron-lifetime spectroscopy. Phys. Rev. B 79, 020204 (2009). [Google Scholar]
- Sakasegawa H. et al. Stability of non-stoichiometric clusters in the MA957 ODS ferrtic alloy. J. Nucl. Mater. 417, 229–232 (2011). [Google Scholar]
- Zhang Z. W. et al. Formation of crystalline and amorphous solid solutions of W-Ni-Fe powder during mechanical alloying. J. Alloys and Comp. 370, 186–191 (2004). [Google Scholar]
- Gong X. Q., Selloni A., Dulub O., Jacobson P. & Diebold U. Small au and pt clusters at the anatase TiO2(101) surface: Behavior at terraces, steps, and surface oxygen vacancies. J. Am. Chem. Soc. 130, 370–381 (2008). [DOI] [PubMed] [Google Scholar]
- Giordano L., Di Valentin C., Goniakowski J. & Pacchioni G. Nucleation of Pd dimers at defect sites of the MgO(100) surface. Phys. Rev. Lett. 92, 096105 (2004). [DOI] [PubMed] [Google Scholar]
- Han Y., Liu C. J. & Ge Q. F. Effect of surface oxygen vacancy on pt cluster adsorption and growth on the defective anatase TiO2(101) surface. J. Phys. Chem. C 111, 16397–16404 (2007). [Google Scholar]
- Sichel-Tissot R. J., Devlin R. C., Ryan P. J., Kim J. W. & May S. J. The effect of oxygen vacancies on the electronic phase transition in La1/3Sr2/3FeO3 films. Appl. Phys. Lett. 103, 212905 (2013). [Google Scholar]
- Zhang X. P. et al. Impact of rapid thermal processing on oxygen precipitation in heavily arsenic and antimony doped Czochralski silicon. J. Appl. Phys. 113, 163510 (2013). [Google Scholar]
- Voronkov V. V. Grown-in defects in silicon produced by agglomeration of vacancies and self-interstitial. J. Cryst. Growth 310, 1307–1314 (2008). [Google Scholar]
- Gao C., Ma X. Y., Zhao J. J. & Yang D. R. Effect of tin on point defects and oxygen precipitation in Czochralski silicon: Experimental and theoretical studies. J. Appl. Phys. 113, 093511 (2013). [Google Scholar]
- Sala G. et al. Vacancy defects and monopole dynamics in oxygen-deficient pyrochlores. Nat. Mater. 13, 488–493 (2014). [DOI] [PubMed] [Google Scholar]
- Krsjak V., Szaraz Z. & Hahner P. Positron annihilation lifetime study of oxide dispersion strengthened steels. J. Nucl. Mater. 428, 160–164 (2012). [Google Scholar]
- Alinger M. J. et al. Positron annihilation characterization of nanostructured ferritic alloys. Mater. Scie. Engi. A 518, 150–157 (2009). [Google Scholar]
- Zhang Z. W. et al. From embryos to precipitates: A study of nucleation and growth in a multicomponent ferritic steel. Phys. Rev. B 84, 174114 (2011). [Google Scholar]
- Miller M. K., Russell K. F. & Hoelzer D. T. Characterization of precipitates in MA/ODS ferritic alloys. J. Nucl. Mater. 351, 261–268 (2006). [Google Scholar]
- Jiang Y., Smith J. R. & Robert Odette G. Prediction of structural, electronic and elastic properties of Y2Ti2O7 and Y2TiO5. Acta. Mater. 58, 1536–1543 (2010). [Google Scholar]
- Larson D. J., Maziasz P. J., Kim I. S. & Miyahara K. Three-dimensional atom probe observation of nanoscale titanium-oxygen clustering in an oxide-dispersion-strengthened Fe-12Cr-3W-0.4Ti + Y2O3 ferritic alloy. Scripta Mater. 44, 359–364 (2001). [Google Scholar]
- Guinier A. (ed.) Small Angle Scattering of X-rays. (John Wiley and Sons, New York; 1955). [Google Scholar]
- Kline S. R. Reduction and Analysis of SANS and USANS Data Using IGOR Pro. J. appl. crystall 39, 895–900 (2006). [Google Scholar]
- Schmidt P. W. et al. SMALL-ANGLE X-RAY-SCATTERING FROM THE SURFACES OF REVERSED-PHASE SILICAS - POWER-LAW SCATTERING EXPONENTS OF MAGNITUDES GREATER-THAN-4. J. Chem. Phy. 94, 1474–1479 (1991). [Google Scholar]
- Wang X. L. et al. In situ synchrotron study of phase transformation behaviors in bulk metallic glass by simultaneous diffraction and small angle scattering. Phys. Rev. Lett. 91, 265501 (2003). [DOI] [PubMed] [Google Scholar]
- Huisman L. M. et al. Mechanisms for energetic-vacancy stabilization: TiO and TiC. Phys. Rev. B 22, 991–1006 (1980). [Google Scholar]
- Banus M. D. et al. Electrical and Magnetic Properties of TiO and VO. Phys. Rev. B 5, 2775–2784 (1972). [Google Scholar]
- Fu C. L., Krčmar M., Painter G. S. & Chen X.-Q. Vacancy Mechanism of High Oxygen Solubility and Nucleation of Stable Oxygen-Enriched Clusters in Fe. Phys. Rev. Lett. 99, 225502 (2007). [DOI] [PubMed] [Google Scholar]
- Hin C., Wirth B. D. & Neaton J. B. Formation of Y2O3 nanoclusters in nanostructured ferritic alloys during isothermal and anisothermal heat treatment: A kinetic Monte Carlo study. Phys. Rev. B 80, 134118 (2009). [Google Scholar]
- Bentley J. & Hoelzer D. T. Characterization of Oxide Nano-clusters in Mechanically Alloyed Nickel Alloys. Microsc microanal 15, 1368–1369 (2009). [Google Scholar]
- Hsiung L. L. et al. Formation mechanism and the role of nanoparticles in Fe-Cr ODS steels developed for radiation tolerance. Phys. Rev. B 82, 184103 (2010). [Google Scholar]
- Zhang Z. W. et al. Effects of proton irradiation on nanocluster precipitation in ferritic steel containing fcc alloying additions. Acta. Mater. 60, 3034–3046 (2012). [Google Scholar]
Associated Data
This section collects any data citations, data availability statements, or supplementary materials included in this article.


