

Abstract
Background
Priming doses of alcohol are associated with increased desire to drink and disinhibitory effects on subsequent control over drinking. Despite the importance of alcohol priming in the cue-reactivity literature, the effects of priming on brain responses to alcohol cues remains unclear. Further, evidence suggests this relationship may be moderated by OPRM1 genotype.
Methods
Twenty individuals with alcohol dependence (6 females; 90% Caucasian; mean age=29.4) who were prospectively genotyped on the OPRM1 gene underwent two functional magnetic resonance imaging (fMRI) sessions, before and after a priming dose of alcohol, each including a gustatory alcohol cue reactivity paradigm and self-reported craving measures.
Results
Self-reported alcohol craving generally increased and remained higher for alcohol versus water cue presentations across pre- and post-priming scans. Compared to alcohol cues delivered during the post-priming scan, alcohol cues delivered pre-priming were associated with greater activation in regions including the hippocampus, amygdala, inferior frontal gyrus, temporal cortex, and occipital cortex. Controlling for alcoholism severity increased statistical significance of activation in these regions. Follow-up analyses revealed a positive correlation between alcoholism severity and pre- versus post-priming alcohol cue-reactivity primarily in frontal regions. OPRM1 genotype was also found to moderate alcohol cue-reactivity across scans.
Conclusion
This study provides initial evidence of alcohol cue-elicited habituation in fronto-temporal regions, despite continued craving, following a priming dose of alcohol. Further, it provides preliminary evidence for moderating roles of alcoholism severity and OPRM1 genotype on priming-related changes in cue-reactivity, adding to our understanding of the function of alcohol priming in alcohol dependence.
Keywords: fMRI, cue-reactivity, priming, alcohol, alcoholism
Introduction
Functional magnetic resonance imaging (fMRI) studies have effectively characterized differences in neural responses to alcohol cues between alcohol dependent individuals and healthy controls. In a meta-analytic review, Schacht et al. (2013) concluded that in response to alcohol cues, alcohol dependent individuals show greater activation of parietal and temporal regions, including posterior cingulate, precuneus and superior temporal gyrus, as compared to controls. Cue-elicited activation of the ventral striatum most frequently correlated with behavioral measures of severity of dependence, quantity of alcohol consumed, impaired self-control, and magnitude of craving, and was most often reduced by treatment, with the caveat that these results were often derived from region-of-interest (ROI) analyses that interrogated only limbic regions (1). The assessment of alcohol craving using alcohol cue reactivity paradigms offers unique opportunities for translational science, as alcohol craving can be measured in many contexts, such as within behavioral, neural, and clinical frameworks (2). Importantly, fMRI techniques have been coupled with intravenous alcohol administration, enabling the detection of neural responses related to the acutely rewarding effects of alcohol, namely activation of the striatal reward circuitry (3, 4).
As recently reviewed by Jasinska and colleagues (2014), a number of factors influence neural responses to drug cues in addiction, including addiction severity, treatment status, drug availability, sensory modality and length of cue presentation, and implicit/explicit regulation of cue-reactivity (5). An important, yet seldom studied factor that may modulate neural responses to alcohol cues is the presence of a priming dose of alcohol. Early behavioral research suggests that alcohol priming increases the desire to drink (6, 7), and it has been argued that the disinhibitory effects of alcohol priming may be associated with subsequent loss of control over drinking (8). Very few fMRI studies to date have considered the role of alcohol priming in neural responses to alcohol cues. One such study tested a sample of ten hazardous drinkers (i.e., non-dependent, but frequent consumers of ≥4 alcoholic drinks per occasion for males, ≥3 drinks for females) using an olfactory cues task (i.e., alcoholic drink odors vs. appetitive/non-appetitive control odors) in a placebo-controlled design in which alcohol/saline was delivered intravenously to a target breath alcohol concentration (BrAC) of 0.05g/dl (9). The contrasts between alcohol and appetitive/non-appetitive odors after the alcohol priming condition revealed significant activation of the nucleus accumbens, orbitofrontal, medial frontal and precuneus/posterior cingulate regions; whereas no regions of significant activation were observed for these contrasts after the saline condition. When the authors compared the alcohol odors versus appetitive odors (and alcohol odors versus non-appetitive odors) contrasts after the alcohol priming and saline conditions directly, only greater activation of the posterior cingulate/retrosplenial region was observed for the alcohol priming condition (9). A larger study using alcohol taste cues focused on genetic moderators of neural cue-reactivity and found differing priming related results for the D4 dopamine receptor gene (DRD4) variable number of tandem repeats (VNTR) and OPRM1 A118G genotypes (10). Specifically, DRD4 VNTR >7 repeat individuals showed greater blood-oxygen-level dependent (BOLD) signal response to alcohol cues, versus control cues (i.e., litchi juice), in regions such as the orbitofrontal cortex, anterior cingulate gyrus, and striatum, as compared to individuals with <7 repeats, but only at the pre-priming level of analysis. In contrast, G-allele carriers of the OPRM1 gene exhibited greater BOLD signal response to alcohol versus control cues in mesocorticolimbic areas before and after alcohol priming (target BrAC=0.03g/dl), as compared to A-allele homozygotes, suggesting insensitivity to the priming dose in G-allele carriers.
While these two fMRI studies examining alcohol priming in the context of cue-reactivity offer some insights, they each have limitations. Specifically, Bragulat et al. (2008) used olfactory cues in a small sample of hazardous drinkers and had limited power to assess magnitude differences across alcohol priming and saline control conditions with a sample size of just seven subjects included in the analysis (9). Filbey et al. (2008) focused on alcohol priming as a tool for probing genetic effects of cue-reactivity in specific brain regions, thus analyses did not evaluate the absolute difference in activation across ROIs during pre- and post-alcohol priming conditions (10). Given the importance of alcohol priming in the cue-reactivity literature and the relative paucity of studies interrogating the role of alcohol priming in neural responses during cue-reactivity, the present study used a within-subjects design to test whether BOLD signal response to alcohol taste cues (11) would change following a priming dose of alcohol (target BrAC=0.03g/dl) in a sample of non-treatment seeking alcohol dependent individuals. While the behavioral pharmacology literature suggests that alcohol priming would increase the desire to drink (i.e., increase subjective craving; 6, 12), it remains unclear whether greater brain activation indeed corresponds to greater desire for alcohol, as the findings on the relationship between subjective and objective measures of cue-induced craving are mixed (13, 14). In addition, none of the studies reviewed have tested priming effects among alcohol dependent individuals. As such, hypotheses concerning the direction of neural effects cannot be advanced, and instead, differences in the magnitude of whole-brain activation to alcohol versus control cues pre-post alcohol priming are examined. The priming dose of 0.03g/dl corresponds to approximately 1–2 standard drinks, allowing evaluation of how individuals respond to cues at low levels of subjective intoxication and when making decisions that may extend their drinking episode into heavier, possibly binge, levels. Thus, elucidating how neural responses to cues as well as subjective craving change after a priming dose has a unique set of implications for translational science of alcoholism and may be especially informative about the escalation of a drinking episode.
Materials and Methods
Sample Characteristics
Participants were non-treatment seeking problem drinkers recruited from the Los Angeles community through flyers and online advertisements as part of a larger study to investigate the effect of the OPRM1 gene on subjective responses to alcoho1 (15). The protocol was approved by the University of California, Los Angeles Institutional Review Board, and following consenting procedures, 295 participants were screened for alcohol dependence and prospectively genotyped. Of those screened, 43 alcohol dependent individuals were selected to undergo the randomized, placebo-controlled, alcohol administration (the primary aim of the parent study), which included similar numbers of participants with and without the minor (G) allele of the OPRM1 gene (AA, n = 23 and AG/GG, n = 20) (15). A subsample of 20 alcohol dependent individuals was then selected from this sample for the MRI portion of the study (AA, n=10; AG/GG, n=10). Ethnicity was matched across groups in this subsample to account for population stratification at the OPRM1 locus. Inclusion criteria were: (1) ages 21 to 55 years, (2) current DSM-IV alcohol dependence, (3) no major psychiatric disorders, (4) no current use of illicit substances (other than marijuana), verified by toxicology screening, and (5) no DSM-IV abuse or dependence on any illicit substance (including marijuana) in the past 12 months. Subjects were instructed to refrain from drinking alcohol at least 24 hours prior to their scan time, which was verified by a Breathalyzer test (Dräger, Telford, PA).
Individual Difference Measures
Demographic information was collected from all participants, including age, sex, ethnicity, education, and alcohol use/dependence indices (Table 1). Independent t-tests (or χ2 for dichotomous variables) were conducted on all demographic variables, and except for a trend level difference on alcoholism severity factor scores (p=0.09), no significant differences between genotype groups were observed (ps>0.10). Quantity and frequency of alcohol use was assessed using the 30-day timeline follow-back (TLFB; 16). Alcohol dependence and the exclusionary psychiatric diagnoses were assessed using the Structured Clinical Interview for DSM-IV (SCID; 17) under the supervision of a licensed clinical psychologist (LAR). DSM-IV symptoms of alcohol abuse and dependence were recorded for a total of 11 possible symptoms. All participants completed the Clinical Institute Withdrawal Assessment for Alcohol (CIWA-Ar; 18); Alcohol Dependence Scale (ADS; 19), Drinkers Inventory of Consequences (DrInC-2R) questionnaire (20), and the Penn Alcohol Craving Scale (PACS; 21). No individuals reported clinically significant levels of alcohol withdrawal at time of assessment as indicated by CIWA-Ar score (scores ≤6).
Table 1.
Sample Demographics
| Variable | Frequency or Mean (SD)
|
||
|---|---|---|---|
| AA (n=10) | AG/GG (n=10) | Combined (n=20) | |
|
| |||
| Age | 32.1 (11.0) | 26.7 (5.8) | 29.40 (9.01) |
|
| |||
| Sex - Male/Female | 7/3 | 7/3 | 14/6 |
|
| |||
| Ethnicity | |||
| - Caucasian | 9 | 9 | 18 |
| - African American | 1 | 1 | 2 |
|
| |||
| Drinks per Drinking Day | 6.9 (1.9) | 5.9 (2.6) | 6.42 (2.24) |
|
| |||
| Percent Drinking Days (past 30 days) | 65.3% (0.6%) | 58.3% (0.2%) | 61.83% (2.1%) |
|
| |||
| Withdrawal Symptoms (Total CIWA-Ar Score) | 2.5 (1.5) | 2.0 (1.8) | 2.25 (1.65) |
|
| |||
| Alcohol Abuse/Dependence Symptom Count | 6.70 (2.26) | 5.70 (1.94) | 6.20 (2.12) |
|
| |||
| ADS Total Score | 18.80 (5.55) | 15.40 (4.65) | 17.10 (5.28) |
|
| |||
| Alcoholism Severity Factor Score | .4957 (.9378) | −.0327 (.6415) | .248 (.873) |
|
| |||
| Education (years) | 15.7 (2.5) | 14.3 (1.9) | 15.00 (2.29) |
|
| |||
| Shipley IQ (Standard Score) | 113.3 (16.5) (n = 9) | 106.7 (22.2) | 109.84 (19.43) (n = 19) |
|
| |||
| Working Memory (Digit Span Scaled Score) | 12.3 (1.9) (n = 7) | 11.0 (3.3) (n=8) | 11.6 (2.72) (n = 15) |
|
| |||
| Marijuana Use - None/Moderate | 7/3 | 7/3 | 14/6 |
|
| |||
| Cigarettes Per Day | |||
| - 0 | 3 | 3 | 6 |
| - 1 ≤ 10 | 6 | 6 | 12 |
| - > 10 | 1 | 1 | 2 |
Note: CIWA-Ar, Clinical Institute Withdrawal Assessment for Alcohol; ADS, Alcohol Dependence Scale. Except for the trend-level group difference on alcohol dependence severity (p = .09), no significant group differences were found (ps >0.10).
To appropriately model the shared variance between the alcohol dependence severity indices and minimize the number of statistical tests, principal components analyses were conducted on the full sample (N=295) to derive factor scores capturing alcoholism severity. The principal factor method (promax oblique rotation) revealed one meaningful factor (first Eigenvalue=2.749, second Eigenvalue=0.858) with each index loading onto the factor at 0.40 or greater (ADS=0.83, PACS=0.74, Symptom Count=0.75, DrInC-2R=0.85, and CIWA-Ar=0.48), and together accounted for 55% of the total variance. Participants’ scores on the single factor (alcoholism severity) were used in subsequent analyses.
Experimental Methods
Participants underwent the fMRI alcohol taste cues task twice, once at baseline (“pre-priming”, BrAC=0.00) and once following the administration of an oral priming dose of alcohol (“post-priming”, mean BrAC=0.028, SD=0.014 immediately prior to scan). Following the baseline scan, participants were removed from the scanner, escorted back to the laboratory and administered approximately one standard drink (Sauvignon Blanc wine) designed to reach a target BrAC of 0.03g/dl, calculated using published guidelines (22). All participants received the same white wine for the priming dose and for the alcohol taste cues in the scanner, thus enabling standardization of alcohol administration across the laboratory and scanning environments. Participants were given 5min to consume the beverage and were then escorted back to the MRI scanner to complete the second alcohol cues task. The time between the consumption of the alcoholic beverage and the beginning of the second task was approximately 30min, including an additional 10min to prepare the participant for scanning.
Alcohol Cues Task
While in the scanner participants underwent an alcohol taste-cue paradigm previously reported to elicit BOLD responses in mesocorticolimbic areas (10, 11). Alcohol and water taste stimuli were delivered via Teflon tubing using a computer-controlled delivery system (Infinity Controller; J-KEM Scientific Inc., St. Louis, MO) as described by Filbey et al. (11). The paradigm consisted of 12 taste cue trials (six alcohol and six water trials in a pseudorandomized sequence) in which 1ml of liquid was delivered. Each trial consisted of a 24s taste delivery period, followed by a 6s rest period, a 12s urge rating period, and a 2s delay before the initiation of the next trial (Figure 1). The words “Alcohol Taste” or “Control Taste” were visually presented during cue delivery. During the urge rating period, participants were instructed to rate their current subjective urge to drink alcohol using a scale of 1 (no urge at all) to 4 (very high urge) using a 4 button response box placed in their right hand. Sauvignon Blanc wine was used for the alcohol taste cue and filtered tap water was used for the control cue. The presentation of visual stimuli and response collection were programmed using E-Prime (Psychology Software Tools, Inc., Sharpsburg, PA). Visual and auditory stimuli were presented using MRI compatible goggles and headphones (Resonance Technologies, Van Nuys, CA).
Figure 1.
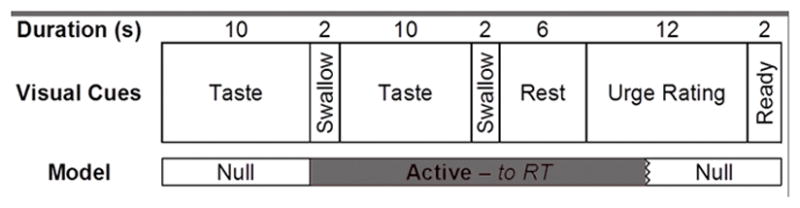
Schematic of a single taste cue trial and portions of the trial that were explicitly modeled in the general linear model fMRI analysis.
MRI Data Acquisition
Neuroimaging was conducted using a 3 Tesla Siemens Trio MRI scanner at the UCLA Ahmanson-Lovelace Brain Mapping Center. The protocol began with initial structural scans followed by a series of four functional runs, including the alcohol-cue task, a stop signal task (23), a delay-discounting task, and a risky decision-making task (results from the latter two tasks will be reported elsewhere). A T2-weighted, high resolution, matched-bandwidth, anatomical scan (MBW) and a magnetization-prepared rapid-acquisition gradient echo (MPRAGE) were acquired for each subject to enable registration (TR, 1.9s; TE, 2.26ms; FOV, 250mm; matrix, 256×256; sagittal plane; slice thickness, 1mm; 176 slices). The orientation for MBW and echoplanar image (EPI) scans was oblique axial to maximize brain coverage. The alcohol taste cues scan included 184 functional T2*-weighted EPIs (TR, 2s; TE, 30ms; flip angle, 90°; FOV, 192mm; matrix, 64x64; voxel size, 3x3x4mm3; slice thickness, 4mm; 34 slices). The first six volumes collected were discarded to allow for T1 equilibrium effects.
Imaging Preprocessing and Registration
FSL 4.1 (FMRIB’s Software Library, www.fmrib.ox.ac.uk/fsl) was used for the imaging analyses. Motion correction was carried out using the Motion Correction Linear Image Registration Tool (McFLIRT, Version 5.0) with the estimated motion parameters entered as covariates in the general linear model. Non-brain tissue/skull removal was conducted with the Brain Extraction Tool (BET). The images were high-pass filtered (100s cutoff) in the temporal domain with the FMRI Expert Analysis Tool (FEAT, Version 5.63), using a Gaussian-weighted straight line fit. The EPI images were first registered to the MBW, then to the MPRAGE using affine linear transformations, and finally into standard (Montreal Neurological Institute, MNI avg152 template) space for between subject analyses, refined by FSL’s FNIRT nonlinear registration (24). Contrast images were smoothed using a FWHM Gaussian kernel (5mm). Three subjects (two G-allele carriers and one A-allele homozygote) were excluded from further analyses due to excessive motion (exceeding 3mm of translation).
Genotyping
Saliva samples were collected using Oragene saliva collection kits (Kanata, Ontario, Canada) and sent to the UCLA Genotyping and Sequencing Core for genotyping. Polymerase chain reaction was performed on Applied Biosystems (Carlsbad, CA) dual block PCR thermal cyclers. Single-nucleotide polymorphisms were run on an AB 7900HT Fast Real-Time PCR System and analyzed using the Sequence Detection Systems software version 2.3. Genotypes were automatically scored by the allele calling software, and each genotype was verified by visual inspection.
Statistical Analyses
In-scanner craving ratings were analyzed using a repeated measures analysis of variance (ANOVA) including scan (2 levels: pre-priming, post-priming) and cue type (2 levels: alcohol, water) as repeated factors, and OPRM1 genotype as a between subject factor (2 levels: AA, AG/GG).
Whole-brain statistical analysis was performed using a multi-stage approach to implement a mixed-effects model treating pre/post priming session as a fixed-effects variable and participants as a random-effects variable. Explanatory variables for the alcohol cues task were created by convolving delta functions representing the onset of the taste period for each trial type (see Figure 1) with a double-gamma hemodynamic response function (HRF) in FEAT. Alcohol and Water cue exposure trials were modeled as separate event types. As previously done (25), the onset for each event was set at the first instruction to swallow (10s after the initial taste cue was presented) with duration of 20s plus the response time for the urge-to-drink rating. Temporal derivatives were included as covariates of no interest to improve statistical sensitivity. Null events, consisting of the post-response rating period, rest period, and first cue delivery, were not explicitly modeled and therefore constituted an implicit baseline. The following contrasts were computed: (a) Alcohol versus baseline, (b) Water versus baseline, (c) Water versus Alcohol, and (d) Alcohol versus Water, which was the primary contrast of interest.
Higher level analyses were conducted on the alcohol versus water cue contrast images transformed into standard space. This model included these contrast images to determine pre- vs. post- effects, modeling each participant’s mean separately in order account for within-subject variability. Z-statistic images were thresholded with cluster-based corrections for multiple comparisons based on the theory of Gaussian Random Fields with a cluster-forming threshold of Z>2.3 (reduced to Z>1.96 for exploratory correlational analyses) and a probability threshold of p<0.05 (26). Anatomical localization within each cluster (maximum Z statistics and MNI coordinates) was obtained by searching within maximum likelihood regions from the FSL Harvard-Oxford probabilistic atlas. To account for the trend level difference in alcoholism severity factor scores between genotype groups, alcoholism severity was modeled as the explanatory variable in whole-brain group-level analyses. OPRM1 genotype (i.e., AA and AG/GG) was also entered as a predictor variable and examined in relation to the computed contrasts. These analyses were considered exploratory due to the relatively small sample sizes for genetic and correlational analyses.
Results
The alcohol cues task elicited greater self-reported craving ratings to the alcohol versus water cues during both pre- and post-priming scans, as demonstrated by a significant main effect of cue type [F(1,16)=9.64, p=.007; Figure 2]. Further, craving ratings during the post-priming scan were found to be significantly greater than craving ratings during the pre-priming scan [F(1,16)=5.55, p=.032]. No interaction between cue-type and scan was observed (p=.775), and OPRM1 genotype did not significantly interact with either cue-type or scan (ps>.212).
Figure 2.

Mean self-reported craving ratings during the Alcohol Cues Task. *p < .05, **p < .001
As reported by Ray et al. (25), the main contrast of interest (Alcohol versus Water) during the pre-priming scan was associated with the activation of a broad set of regions including mesocorticolimbic areas such as the ventral striatum and inferior frontal gyrus. Additional areas of activation were found in limbic regions (insula, posterior cingulate gyrus, amygdala), parietal lobe (precuneus), thalamus, and occipital areas (lingual gyrus) (Table 2). Similarly, the post-priming Alcohol versus Water contrast was associated with activation in the ventral striatum, inferior frontal gyrus, and insula, among other regions (Table 2).
Table 2.
Locations of significant activation from the alcohol- versus water-cue contrast across all subjects acquired during the pre-priming (baseline) and post-priming (BrAC=0.03) scans (whole-brain cluster-corrected at Z>2.3, p<0.05).
| Pre-Priming: Alcohol- vs. Water-Cue
| ||||||
|---|---|---|---|---|---|---|
| Brain Region | Hemisphere | Cluster Voxels | Max Z | X | Y | Z |
|
| ||||||
| Postcentral Gyrus | L | 48629 | 4.31 | −48 | −14 | 34 |
| - Inferior Frontal Gyrus/Amygdala | L | 4.23 | −52 | 28 | −2 | |
| - Insular Cortex/Thalamus/Nucleus Accumbens | R | 4.16 | 38 | −12 | 12 | |
| - Occipital Pole | R | 4.14 | 14 | −100 | 6 | |
| - Middle Temporal Gyrus, Temporo- Occipital | R | 4.02 | 58 | −52 | 6 | |
| - Lingual Gyrus | L | 3.83 | −4 | 70 | −4 | |
| - Intracalcarine Cortex | R | 3.77 | 18 | −84 | 8 | |
| - Lateral Occipital Cortex | R/L | 3.66/3.14 | 26/−54 | −80/−62 | 6/32 | |
| - Posterior Cingulate Gyrus | R | 3.83 | 14 | −42 | 30 | |
| - Precuneus | R | 3.59 | 16 | −48 | 44 | |
| - Angular Gyrus | R/L | 3.40/3.22 | 36/−62 | −54/−58 | 34/20 | |
| - Anterior Cingulate Gyrus | L | 3.71 | −4 | 14 | 30 | |
| - Paracingulate Gyrus | R/L | 3.71 | 0 | 20 | 46 | |
| - Superior Frontal Gyrus | L | 3.37 | −4 | 26 | 60 | |
| - Posterior Supramarginal Gyrus | L | 3.64 | −46 | −48 | 24 | |
|
| ||||||
|
Post-Priming: Alcohol- vs. Water-Cue
| ||||||
| Cerebellum | R/L | 2753 | 3.92/4.27 | 16/−16 | −56/−62 | −28/−22 |
| Postcentral/Precentral Gyrus | R/L | 2655/833 | 3.87/4.01 | 40/−50 | −12/−14 | 32/38 |
| - Insular Cortex | R | 3.58 | 40 | 6 | −14 | |
| - Inferior Frontal Gyrus | R | 3.55 | 32 | 32 | 8 | |
| Anterior Cingulate Gyrus | R/L | 1049 | 3.51/3.46 | 8/−12 | 4/12 | 28/32 |
| Insular Cortex | L | 743 | 3.67 | −36 | 14 | −2 |
| - Temporal Pole | L | 3.50 | −60 | 6 | −2 | |
| Subcallosal Cortex/Caudate/Nucleus Accumbens (L/R) | R | 509 | 3.24 | 12 | 18 | −16 |
| - Orbito Frontal Cortex | R | 3.10 | 16 | 20 | −22 | |
| Anterior Prefrontal Cortex | R | 499 | 3.59 | 32 | 68 | −8 |
Note: X, Y, and Z MNI coordinates indicate the location of peak voxel activation (or local maxima for subregions) within each cluster. R, right, L, left.
To determine potentially separable effects of the alcohol prime on alcohol and water cues, we examined the effect of the alcohol prime on alcohol- and water-cue trials separately. We found an increase in activation to water cues following the prime (post- versus pre-priming contrast) across several cortical regions, including fronto-temporal regions and central opercular cortex. For alcohol cue trials, we found activation decreases in occipital regions (pre- versus post-priming) and increases in bilateral post-central and central opercular cortex (post- versus pre-priming; see supplementary materials).
Contrasting the pre- and post-priming scans within the Alcohol versus Water Cues contrasts, the main contrast of interest, revealed significantly greater activation associated with the pre-priming scan in the hippocampus, amygdala, inferior frontal gyrus, temporal regions, occipital cortex, and other areas (Table 3). Controlling for alcoholism severity in the model intensified these regions of activation such that pre-priming alcohol cues were associated with larger clusters of activation in the hippocampus and amygdala, inferior frontal gyrus, temporal regions, and occipital areas (Table 3, Figure 3). No regions of significant activation were found for the reverse contrast (post- versus pre-priming) or when comparing OPRM1 genotype within either model. No correlations were observed between whole-brain BOLD measures and self-reported craving assessments, as commonly reported in previous studies (e.g., 11, 27, 28).
Table 3.
Locations of significant activation contrasting the alcohol- versus water-cue, pre- versus post-priming scans, with and without controlling for alcoholism severity (whole-brain cluster-corrected at Z>2.3, p<0.05). No significant activation was observed for the reverse contrast: post- versus pre-priming.
| Pre- vs. Post-Priming
| ||||||
|---|---|---|---|---|---|---|
| Brain Region | Hemisphere | Cluster Voxels | Max Z | X | Y | Z |
|
| ||||||
| Occipital Pole/Lingual Gyrus/Intracalcarine Cortex | L | 1977 | 3.62 | −10 | −94 | −6 |
| - Superior Lateral Occipital Cortex | L | 3.42 | −30 | −80 | 16 | |
| Superior Lateral Occipital Cortex | R | 976 | 4.01 | 26 | −84 | 16 |
| - Occipital Pole | R | 3.37 | 14 | −98 | 8 | |
| - Inferior Lateral Occipital Cortex | R | 3.19 | 36 | −82 | 6 | |
| Superior Temporal Gyrus | L | 769 | 3.09 | −54 | 2 | −16 |
| - Middle Temporal Gyrus | L | 3.08 | −52 | −44 | 0 | |
| Hippocampus | R | 545 | 3.46 | 28 | −8 | −26 |
| - Amygdala | R | 3.35 | 30 | 2 | −22 | |
| - Temporal Fusiform Cortex | R | 3.13 | 40 | −10 | −26 | |
| - Temporal Pole | R | 3.12 | 28 | 6 | −28 | |
| - Middle Temporal Gyrus | R | 3.05 | 50 | −8 | −18 | |
| - Parahippocampal Gyrus | R | 2.95 | 28 | −8 | −32 | |
| Inferior Frontal Gyrus | L | 465 | 3.85 | −54 | 28 | 14 |
|
| ||||||
|
Pre- vs. Post-Priming Controlling for Alcoholism Severity
| ||||||
| Superior Lateral Occipital Cortex | R | 5487 | 4.01 | 26 | −84 | 16 |
| - Occipital Pole | R/L | 3.68/3.73 | 14/−10 | −98/−94 | 8/−6 | |
| - Superior Lateral Occipital Cortex | L | 3.56 | −30 | −80 | 16 | |
| Middle Temporal Gyrus | L | 1464 | 3.22 | −64 | −24 | −6 |
| - Superior Temporal Gyrus | L | 3.13 | −56 | −12 | −8 | |
| - Temporal Pole | L | 3.11 | −54 | 6 | −34 | |
| Hippocampus/Amygdala | R | 884 | 3.59 | 28 | −8 | −26 |
| - Temporal Fusiform Cortex | R | 3.37 | 42 | −10 | −26 | |
| - Middle Temporal Gyrus | R | 3.34 | 58 | 0 | −24 | |
| - Temporal Pole | R | 3.33 | 28 | 6 | −28 | |
| Inferior Frontal Gyrus/Orbitofrontal Cortex | L | 850 | 3.77 | −54 | 28 | 12 |
| - Anterior Prefrontal Cortex | L | 3.33 | −54 | 36 | −4 | |
| Superior Frontal Gyrus | L | 399 | 3.67 | −4 | 28 | 60 |
Note: X, Y, and Z MNI coordinates indicate the location of peak voxel activation (or local maxima for subregions) within each cluster. R, right, L, left.
Figure 3.

Brain activation within the alcohol- versus water-cue, pre- versus post-priming scan contrast, controlling for alcoholism severity (see Table 3 for list of regions). Z-statistic maps are whole-brain cluster-corrected, Z>2.3, p=0.05. Coordinates are in MNI space, and the brain is displayed in radiological convention (left = right).
Significant results of the exploratory follow-up analyses examining the correlation between alcoholism severity and priming-related alcohol cue reactivity were not observed at a voxel height threshold of Z>2.3 (cluster-corrected). Due to the limited power afforded by the smaller sample size, the threshold was reduced to Z>1.96, which revealed a significant and positive correlation between severity and pre- versus post-priming alcohol cue reactivity, primarily within frontal regions including the anterior prefrontal cortex, inferior and superior frontal gyri (Table 4, Figure 4). No significant negative correlation was observed at either threshold.
Table 4.
Locations of significant activation from the alcohol- versus water-cue, pre- versus post-priming scan contrast that were positively correlated with alcoholism severity (whole-brain cluster-corrected at a reduced threshold of Z>1.96, p<0.05). No negative correlations were observed.
| Pre- vs. Post-Priming: Positive Correlation with Alcoholism Severity
| ||||||
|---|---|---|---|---|---|---|
| Brain Region | Hemisphere | Cluster Voxels | Max Z | X | Y | Z |
|
| ||||||
| Anterior Prefrontal Cortex | L | 1528 | 3.46 | −14 | 52 | 38 |
| - Superior Frontal Gyrus | R | 3.28 | 2 | 56 | 34 | |
| - Paracingulate Gyrus | R | 3.08 | 6 | 28 | 44 | |
| Inferior Frontal Gyrus | L | 1048 | 3.15 | −54 | 22 | 16 |
| - Precentral Gyrus | L | 2.88 | −34 | 6 | 24 | |
| - Anterior Prefrontal Cortex | L | 2.76 | −44 | 46 | −12 | |
Note: X, Y, and Z MNI coordinates indicate the location of peak voxel activation (or local maxima for subregions) within each cluster. R, right, L, left.
Figure 4.

Brain activation within the alcohol- versus water-cue, pre- versus post-priming scan contrast which positively correlates with alcoholism severity (see Table 4 for list of regions). Z-statistic maps are whole-brain cluster-corrected at a reduced threshold of Z>1.96, p=0.05. Coordinates are in MNI space, and the brain is displayed in radiological convention (left = right).
Preliminary OPRM1 genotype differences were observed at the Z>2.3 threshold with alcoholism severity included as a covariate. Specifically, G-allele carriers were found to exhibit greater pre- versus post-priming alcohol cue-reactivity activation in regions including the left caudate, thalamus, putamen, and bilateral supramarginal gyrus and parietal operculum cortex, as compared to the A-allele homozygotes (Table 5).
Table 5.
Locations of significantly greater activation for the G-carriers of the OPRM1 gene as compared to the A-allele homozygotes (AG/GG vs. AA) for the pre- versus post-priming scan contrast of alcohol- versus water-cues, controlling for alcoholism severity (whole-brain cluster-corrected at Z>2.3, p<0.05). No results were obtained for the reverse contrast (AA vs. AG/GG).
| Pre- vs. Post-Priming: AG/GG vs. AA
| ||||||
|---|---|---|---|---|---|---|
| Brain Region | Hemisphere | Cluster Voxels | Max Z | X | Y | Z |
|
| ||||||
| Parietal Operculum Cortex/Planum Temporale | L | 349 | 3.45 | −54 | −38 | 20 |
| - Posterior Supramarginal Gyrus | L | 3.26 | −54 | −44 | 28 | |
| Anterior Supramarginal Gyrus | R | 333 | 3.09 | 64 | −30 | 30 |
| - Parietal Operculum Cortex | R | 3.05 | 48 | −26 | 18 | |
| - Central Opercular Cortex | R | 2.61 | 54 | −18 | 20 | |
| White Matter/Caudate | L | 306 | 3.21 | −28 | −8 | 30 |
| - Thalamus | L | 2.88 | −14 | −14 | 14 | |
| - Putamen | L | 2.86 | −24 | 4 | 14 | |
Discussion
Despite the importance of alcohol priming in cue-reactivity literature, the effects of priming doses of alcohol on neural responses to alcohol cues remains largely unclear. The only study to directly investigate this question suggests a general increase in responsivity to cues following an alcohol priming dose in hazardous drinkers (9); however, the limited power afforded by the small sample of the Bragulat et al. (9) study warrants further inquiry, and the effects of alcohol priming in alcohol dependent individuals remains unknown.
Contrary to results from the study by Bragulat et al. (9), the present study revealed a general decrease in BOLD response to alcohol taste cues following alcohol priming in an alcohol dependent sample. The brain regions exhibiting significant decreases in activation post-priming included the hippocampus, amygdala, inferior frontal gyrus, temporal regions, and occipital areas, and this effect was more pronounced when controlling for alcoholism severity. Exploratory analyses revealed higher alcoholism severity is associated with greater reductions in alcohol cue-elicited frontal activation following priming, suggesting the observed post-priming decreases in activation of these regions may be driven by the nature of our alcohol dependent sample. In other words, hazardous drinkers may be less likely to show this pattern of decreased activation to the extent to which there is a linear relationship between alcohol use severity and decreased neural response to alcohol cues after alcohol priming.
Habituation to the alcohol cues is the most plausible interpretation for the general decrease in alcohol cue-elicited activation following alcohol priming observed in our sample. Importantly, regions which exhibited this decrease primarily included frontal and temporal regions, which are generally thought to have a role in executive/inhibitory control (e.g., 29) and gustatory sensory processing (e.g., 30), respectively. Traditionally-labeled “reward-related” regions activated by the alcohol cues task (i.e., insula and nucleus accumbens) did not display significant differences in activation between pre- and post-priming scans. Further, self-reported alcohol craving during the task generally increased within scans and remained higher for alcohol versus water cue presentations across both pre- and post-priming scans, although no significant correlations with BOLD activations were observed at the whole-brain level. This pattern of results is consistent with the notion of an alcohol priming-related increase in desire to drink and disinhibition effect on subsequent control over drinking in an alcohol dependent sample, and are especially relevant given evidence supporting disruption of connectivity between inhibitory control (primarily frontal) and reward processing (primarily striatal) networks in individuals experiencing greater alcohol-related problems (23, 31, 32).
A secondary aim of the study was to investigate the potential moderating role of the OPRM1 gene on priming-related differences in alcohol cue-reactivity. The exploratory analysis controlling for alcoholism severity revealed greater region specific alcohol cue-elicited changes in activation between pre- and post-priming scans for G-allele carriers, as compared to the A-allele homozygotes. Specifically, the G-allele carriers exhibited greater priming related decreases in activation during alcohol cues in regions such as the left caudate, thalamus, putamen, and parietal cortex. Although the precise nature of these genotype differences remains unclear, the greater reduction in activation post-priming observed in the G-allele carriers may be related to reduced OPRM1 receptor expression, and potential subsequent reduction of receptor activation, relative to A-allele homozygotes (33, 34). The abundance of mu-opioid receptors in the thalamus, caudate nucleus, and putamen, in particular, further support this hypothesis (35, 36). These findings are somewhat discordant with the results of the study by Filbey and colleagues (10), where the G-allele carriers exhibited greater mesocorticolimbic activation than A-allele homozygotes both pre- and post-priming, although the absence of a pre- versus post-priming contrast in the Filbey paper limits the comparability of the study results. Further, the difference in sample characteristics between the two studies may add to the complexity of the findings. For example, the endogenous opioid-mediated dopaminergic functioning caused by the ingestion of alcohol may differ in alcohol dependent individuals (as in the current study) as compared to non-dependent light or heavy drinkers (as in the Filbey study) (37), which could potentially explain the discrepancy of reward-related regional activation between the two study samples. The present study findings should be considered preliminary, however, given the small sample sizes available for the genetic analysis.
These results should be interpreted in the context of the study’s strengths and limitations. Strengths include the within-subjects alcohol priming study design, well-validated neuroimaging methods, effective alcohol priming dosing procedures resulting in reasonably controlled blood alcohol levels, and the well-ascertained sample of individuals with alcohol dependence. The use of a single alcoholism severity factor score is another strength of the study as this technique is able to capture the multifaceted nature of alcohol addiction (38). Lastly, the use of a consistent alcoholic beverage for the priming dose as well as the alcohol cues delivered in the scanner adds to the translational value of the study results as it more closely models what would be experienced in a naturalistic environment; however, the decision not to use the participants’ preferred alcoholic beverage (e.g., 11) represents a limitation of the study design, despite evidence for significant increases in self-reported craving across the standardized alcohol taste cue trials as compared with water taste cue trials.
The absence of a control group that did not receive a priming dose of alcohol represents a study limitation, as a control group could have provided additional assurances that the observed post-priming craving and BOLD effects are due to the alcohol priming dose specifically, as opposed to an accumulation and carryover effect of repeated cue presentations during the pre-priming scan. This alternative explanation is unlikely, at least in terms of the craving results, as cue-induced craving episodes are typically shown to return close to baseline within 15–30 minutes (39); thus, without the priming dose of alcohol, we would expect to see a significant drop in craving at the beginning of the post-priming scan given it occurred approximately 40 minutes after the cessation of the pre-priming scan. Furthermore, separate analyses of the alcohol and water cue trials suggest that the post-priming habituation effect is specific to the alcohol cues, and is not due to a general decrease in task novelty (see supplementary materials). The relatively small sample size is another limitation, but is mitigated by the within-subject design for the primary analyses, presumably increasing the power to detect true associations. The genotype and correlational analyses, however, should be interpreted with caution until the results are replicated within larger samples. It should also be noted that the results obtained from the prospective genotyping groups may be different in a genetically unselected sample. Thus, future research is needed to validate these findings in larger, genetically unselected samples.
In conclusion, this study provides initial evidence of alcohol cue-elicited habituation effects in fronto-temporal regions, despite continued alcohol craving, following a priming dose of alcohol in an alcohol dependent sample. Further, preliminary evidence is provided for potential region-specific moderating roles of alcoholism severity and OPRM1 genotype on priming-related changes in cue-reactivity. These results add to our understanding of the function of alcohol priming doses in the course of alcohol dependence by suggesting neural mechanisms and moderators (i.e., alcoholism severity, craving, OPRM1 genotype) underlying the escalation from moderate (e.g., 1–2 standard drinks) to heavy, potential binge drinking, alcohol consumption.
Supplementary Material
Acknowledgments
The authors would like to thank Andia Heydari, Pauline Chin, and Ellen Chang for their contribution to data collection and data management for this project.
FUNDING
This study was supported by a grant from ABMRF, the Foundation for Alcohol Research and a grant from NIAAA (1R03 AA019569). KEC was supported by the UCLA Training Program in Translational Neuroscience of Drug Abuse (T32 DA024635) and a National Research Service Award awarded by NIDA (F31 DA035604).
Footnotes
Conflict of Interest: LAR is a paid consultant for GSK. All other authors declare that they have no conflicts of interest.
References
- 1.Schacht JP, Anton RF, Myrick H. Functional neuroimaging studies of alcohol cue reactivity: a quantitative meta-analysis and systematic review. Addict Biol. 2013;18(1):121–133. doi: 10.1111/j.1369-1600.2012.00464.x. [DOI] [PMC free article] [PubMed] [Google Scholar]
- 2.Hutchison KE. Alcohol dependence: neuroimaging and the development of translational phenotypes. Alcohol Clin Exp Res. 2008;32(7):1111–1112. doi: 10.1111/j.1530-0277.2008.00691.x. [DOI] [PMC free article] [PubMed] [Google Scholar]
- 3.Gilman JM, Ramchandani VA, Davis MB, Bjork JM, Hommer DW. Why we like to drink: a functional magnetic resonance imaging study of the rewarding and anxiolytic effects of alcohol. J Neurosci. 2008;28(18):4583–4591. doi: 10.1523/JNEUROSCI.0086-08.2008. [DOI] [PMC free article] [PubMed] [Google Scholar]
- 4.Gilman JM, Ramchandani VA, Crouss T, Hommer DW. Subjective and neural responses to intravenous alcohol in young adults with light and heavy drinking patterns. Neuropsychopharmacology. 2012;37(2):467–477. doi: 10.1038/npp.2011.206. [DOI] [PMC free article] [PubMed] [Google Scholar]
- 5.Jasinska AJ, Stein EA, Kaiser J, Naumer MJ, Yalachkov Y. Factors modulating neural reactivity to drug cues in addiction: a survey of human neuroimaging studies. Neurosci Biobehav Rev. 2014;38:1–16. doi: 10.1016/j.neubiorev.2013.10.013. [DOI] [PMC free article] [PubMed] [Google Scholar]
- 6.de Wit H, Chutuape MA. Increased ethanol choice in social drinkers following ethanol preload. Behav Pharmacol. 1993;4(1):29–36. [PubMed] [Google Scholar]
- 7.Fillmore MI, Rush CR. Alcohol effects on inhibitory and activational response strategies in the acquisition of alcohol and other reinforcers: priming the motivation to drink. J Stud Alcohol. 2001;62(5):646–656. doi: 10.15288/jsa.2001.62.646. [DOI] [PubMed] [Google Scholar]
- 8.Shaham Y, Shalev U, Lu L, De Wit H, Stewart J. The reinstatement model of drug relapse: history, methodology and major findings. Psychopharmacology (Berl) 2003;168(1–2):3–20. doi: 10.1007/s00213-002-1224-x. [DOI] [PubMed] [Google Scholar]
- 9.Bragulat V, Dzemidzic M, Talavage T, Davidson D, O’Connor SJ, Kareken DA. Alcohol sensitizes cerebral responses to the odors of alcoholic drinks: an fMRI study. Alcohol Clin Exp Res. 2008;32(7):1124–1134. doi: 10.1111/j.1530-0277.2008.00693.x. [DOI] [PMC free article] [PubMed] [Google Scholar]
- 10.Filbey FM, Ray L, Smolen A, Claus ED, Audette A, Hutchison KE. Differential neural response to alcohol priming and alcohol taste cues is associated with DRD4 VNTR and OPRM1 genotypes. Alcohol Clin Exp Res. 2008;32(7):1113–1123. doi: 10.1111/j.1530-0277.2008.00692.x. [DOI] [PMC free article] [PubMed] [Google Scholar]
- 11.Filbey FM, Claus E, Audette AR, Niculescu M, Banich MT, Tanabe J, Du YP, Hutchison KE. Exposure to the taste of alcohol elicits activation of the mesocorticolimbic neurocircuitry. Neuropsychopharmacology. 2008;33(6):1391–1401. doi: 10.1038/sj.npp.1301513. [DOI] [PMC free article] [PubMed] [Google Scholar]
- 12.Ray LA, Meskew-Stacer S, Hutchison KE. The relationship between prospective self-rating of alcohol sensitivity and craving and experimental results from two alcohol challenge studies. J Stud Alcohol Drugs. 2007;68(3):379–384. doi: 10.15288/jsad.2007.68.379. [DOI] [PubMed] [Google Scholar]
- 13.Courtney KE, Ashenhurst J, Bacio G, Moallem N, Bujarski S, Hartwell E, Ray LA. Craving and subjective responses to alcohol administration: validation of the desires for alcohol questionnaire in the human laboratory. J Stud Alcohol Drugs. 2013;74(5):797–802. doi: 10.15288/jsad.2013.74.797. [DOI] [PMC free article] [PubMed] [Google Scholar]
- 14.Filbey FM, Schacht JP, Myers US, Chavez RS, Hutchison KE. Marijuana craving in the brain. Proc Natl Acad Sci U S A. 2009;106(31):13016–13021. doi: 10.1073/pnas.0903863106. [DOI] [PMC free article] [PubMed] [Google Scholar]
- 15.Ray LA, Bujarski S, MacKillop J, Courtney KE, Monti PM, Miotto K. Subjective Response to Alcohol Among Alcohol-Dependent Individuals: Effects of the Mu-Opioid Receptor (OPRM1) Gene and Alcoholism Severity. Alcohol Clin Exp Res. 2013;37:E116–E124. doi: 10.1111/j.1530-0277.2012.01916.x. [DOI] [PMC free article] [PubMed] [Google Scholar]
- 16.Sobell LC, Sobell MB. Convergent validity: An approach to increasing confidence in treatment oucome conclusions with alcohol and drug abusers. In: Sobell LC, Sobell MB, Ward E, editors. Evaluating Alcohol and Drug Abuse Treatment Effectiveness: Recent Advances. Elmsford, NY: Pergamon Press; 1980. pp. 177–209. [Google Scholar]
- 17.First MB, Spitzer RL, Gibbon M, Williams JBW. Structured Clinical Interview for DSM-IV Axis I disorders - Patient edition (SCID-I/P, version 2.0) New York: Biometrics Research Department, New York State Psychiatric Institute; 1995. [Google Scholar]
- 18.Sullivan J, Sykora K, Schneiderman J, Naranjo C, Sellers E. Assessment of alcohol withdrawal: The revised Clinical Institute Withdrawal Assessment for Alcohol scale (CIWA-AR) Brit J Addict. 1989;84:1353–1357. doi: 10.1111/j.1360-0443.1989.tb00737.x. [DOI] [PubMed] [Google Scholar]
- 19.Skinner HA, Allen BA. Alcohol dependence syndrome: Measurement and validation. J Abnorm Psychol. 1982;91:199–209. doi: 10.1037//0021-843x.91.3.199. [DOI] [PubMed] [Google Scholar]
- 20.Miller WR, Tonigan JS, Longabaugh R. The Drinker Inventory of Consequences (DrInC): An Instrument for Assessing Adverse Consequences of Alcohol Abuse. Rockville, MD: National Institute on Alcohol Abuse and Alcoholism; 1995. [Google Scholar]
- 21.Flannery BA, Volpicelli JR, Pettinati HM. Psychometric properties of the Penn Alcohol Craving Scale. Alcohol Clin Exp Res. 1999;23(8):1289–1295. [PubMed] [Google Scholar]
- 22.Brick J. Standardization of alcohol calculations in research. Alcohol Clin Exp Res. 2006;30(8):1276–1287. doi: 10.1111/j.1530-0277.2006.00155.x. [DOI] [PubMed] [Google Scholar]
- 23.Courtney KE, Ghahremani DG, Ray LA. Fronto-striatal functional connectivity during response inhibition in alcohol dependence. Addict Biol. 2013;18(3):593–604. doi: 10.1111/adb.12013. [DOI] [PMC free article] [PubMed] [Google Scholar]
- 24.Andersson J, Jenkinson M, Smith S. Technical report TR07JA2. Non-linear registration. FMRIB 2007. [Google Scholar]
- 25.Ray LA, Courtney KE, Hutchison KE, Mackillop J, Galvan A, Ghahremani DG. Initial evidence that OPRM1 genotype moderates ventral and dorsal striatum functional connectivity during alcohol cues. Alcohol Clin Exp Res. 2014;38(1):78–89. doi: 10.1111/acer.12136. [DOI] [PMC free article] [PubMed] [Google Scholar]
- 26.Worsley KJ. Statistical analysis of activation images. In: Jezzard P, Matthews PM, Smith SM, editors. Functional MRI: An Introduction to Methods. Oxford University Press; 2001. [Google Scholar]
- 27.Heinz A, Siessmeier T, Wrase J, Hermann D, Klein S, Grusser SM, Flor H, Braus DF, Buchholz HG, Grunder G, Schreckenberger M, Smolka MN, Rosch F, Mann K, Bartenstein P. Correlation between dopamine D(2) receptors in the ventral striatum and central processing of alcohol cues and craving. Am J Psychiatry. 2004;161(10):1783–1789. doi: 10.1176/appi.ajp.161.10.1783. [DOI] [PubMed] [Google Scholar]
- 28.Due DL, Huettel SA, Hall WG, Rubin DC. Activation in mesolimbic and visuospatial neural circuits elicited by smoking cues: Evidence from functional magnetic resonance imaging. Am J Psychiatry. 2002;159(6):954–960. doi: 10.1176/appi.ajp.159.6.954. [DOI] [PubMed] [Google Scholar]
- 29.Aron AR, Robbins TW, Poldrack RA. Inhibition and the right inferior frontal cortex. Trends Cogn Sci. 2004;8(4):170–177. doi: 10.1016/j.tics.2004.02.010. [DOI] [PubMed] [Google Scholar]
- 30.Barros-Loscertales A, Gonzalez J, Pulvermuller F, Ventura-Campos N, Bustamante JC, Costumero V, Parcet MA, Avila C. Reading salt activates gustatory brain regions: fMRI evidence for semantic grounding in a novel sensory modality. Cereb Cortex. 2012;22(11):2554–2563. doi: 10.1093/cercor/bhr324. [DOI] [PMC free article] [PubMed] [Google Scholar]
- 31.Karoly HC, Weiland BJ, Sabbineni A, Hutchison KE. Preliminary functional MRI results from a combined stop-signal alcohol-cue task. J Stud Alcohol Drugs. 2014;75(4):664–673. doi: 10.15288/jsad.2014.75.664. [DOI] [PMC free article] [PubMed] [Google Scholar]
- 32.Baler RD, Volkow ND. Drug addiction: the neurobiology of disrupted self-control. Trends Mol Med. 2006;12(12):559–566. doi: 10.1016/j.molmed.2006.10.005. [DOI] [PubMed] [Google Scholar]
- 33.Zhang Y, Wang D, Johnson AD, Papp AC, Sadee W. Allelic expression imbalance of human mu opioid receptor (OPRM1) caused by variant A118G. J Biol Chem. 2005;280(38):32618–32624. doi: 10.1074/jbc.M504942200. [DOI] [PubMed] [Google Scholar]
- 34.Weerts EM, McCaul ME, Kuwabara H, Yang X, Xu X, Dannals RF, Frost JJ, Wong DF, Wand GS. Influence of OPRM1 Asn40Asp variant (A118G) on [11C]carfentanil binding potential: preliminary findings in human subjects. Int J Neuropsychopharmacol. 2013;16(1):47–53. doi: 10.1017/S146114571200017X. [DOI] [PubMed] [Google Scholar]
- 35.Frost JJ, Wagner HN, Jr, Dannals RF, Ravert HT, Links JM, Wilson AA, Burns HD, Wong DF, McPherson RW, Rosenbaum AE, et al. Imaging opiate receptors in the human brain by positron tomography. J Comput Assist Tomogr. 1985;9(2):231–236. doi: 10.1097/00004728-198503000-00001. [DOI] [PubMed] [Google Scholar]
- 36.Cross AJ, Hille C, Slater P. Subtraction autoradiography of opiate receptor subtypes in human brain. Brain Res. 1987;418(2):343–348. doi: 10.1016/0006-8993(87)90101-6. [DOI] [PubMed] [Google Scholar]
- 37.Rommelspacher H, Smolka M, Schmidt LG, Samochowiec J, Hoehe MR. Genetic analysis of the μ-opioid receptor in alcohol-dependent individuals. Alcohol. 2001;24(2):129–135. doi: 10.1016/s0741-8329(01)00139-2. [DOI] [PubMed] [Google Scholar]
- 38.Moallem NR, Courtney KE, Bacio GA, Ray LA. Modeling alcohol use disorder severity: an integrative structural equation modeling approach. Front Psychiatry. 2013;4:75. doi: 10.3389/fpsyt.2013.00075. [DOI] [PMC free article] [PubMed] [Google Scholar]
- 39.Fox HC, Bergquist KL, Hong KI, Sinha R. Stress-induced and alcohol cue-induced craving in recently abstinent alcohol-dependent individuals. Alcohol Clin Exp Res. 2007;31(3):395–403. doi: 10.1111/j.1530-0277.2006.00320.x. [DOI] [PubMed] [Google Scholar]
Associated Data
This section collects any data citations, data availability statements, or supplementary materials included in this article.