

Abstract
Objective
The aim of this study was to investigate the use of dental cone beam CT (CBCT) grey values for density estimations by calculating the correlation with multislice CT (MSCT) values and the grey value error after recalibration.
Methods
A polymethyl methacrylate (PMMA) phantom was developed containing inserts of different density: air, PMMA, hydroxyapatite (HA) 50 mg cm−3, HA 100, HA 200 and aluminium. The phantom was scanned on 13 CBCT devices and 1 MSCT device. Correlation between CBCT grey values and CT numbers was calculated, and the average error of the CBCT values was estimated in the medium-density range after recalibration.
Results
Pearson correlation coefficients ranged between 0.7014 and 0.9996 in the full-density range and between 0.5620 and 0.9991 in the medium-density range. The average error of CBCT voxel values in the medium-density range was between 35 and 1562.
Conclusion
Even though most CBCT devices showed a good overall correlation with CT numbers, large errors can be seen when using the grey values in a quantitative way. Although it could be possible to obtain pseudo-Hounsfield units from certain CBCTs, alternative methods of assessing bone tissue should be further investigated.
Advances in knowledge
The suitability of dental CBCT for density estimations was assessed, involving a large number of devices and protocols. The possibility for grey value calibration was thoroughly investigated.
A variety of radiographic tools has been applied in dentistry for the pre-operative planning of implant placement. Conventional two-dimensional (2D) projection techniques are still used routinely as primary assessment of the jaw bones and for certain linear measurements [1]. However, the superposition of various tissues in 2D radiography is a significant limitation that inhibits an appropriate evaluation of potential implant sites in many cases. Apart from the localisation of various anatomical structures, three-dimensional (3D) radiography can be used for the evaluation of bone tissue characteristics such as width, depth, density and structure [1-3].
Different 3D imaging modalities are available for implant planning. In the past years, multislice CT (MSCT) has been gradually replaced with alternatives such as conventional (linear or spiral) tomography and cone beam CT (CBCT) [2]. CBCT has been applied in dentistry for over 10 years, and is now routinely used for a variety of clinical purposes. It allows for the acquisition of true volumetric images of the dentomaxillofacial area at a high spatial resolution. Furthermore, patient radiation doses from CBCT are generally low, although a wide dose range with organ and effective doses between those of 2D radiographic techniques and MSCT has been reported [4]. Many authors have proposed to consider CBCT as the modality of choice for dental implant planning [2,5-7].
The accuracy of CBCT for bone dimension measurements has been thoroughly investigated, using a variety of available scanners. Current-generation CBCT scanners allow for linear and volumetric measurements at potential implant sites in the jaw bones at submillimetre accuracy [7-11]. However, there are contradictory reports as to whether CBCT can be used for bone tissue evaluations by means of density estimations [10-22], similar to the use of Hounsfield units (HU) in MSCT which can be related to absolute density [3,23-27]. Although most CBCT devices use 12-bit images (i.e. 4096 grey values) scaled in an HU-like fashion (i.e. between −1000 and +3000), it is assumed by many that CBCT grey values cannot be as accurately calibrated as HU due to the relatively large amount of noise, different types of artefacts, the cone beam geometry and the limited field of view (FOV) size. Previous investigations and applications of CBCT grey values as HU were often limited to a single device, and may have been too optimistic about the actual accuracy of density estimations in practice.
The aim of this study was to investigate the relationship between CBCT and MSCT grey values. The linear correlation between grey values from CBCT and MSCT images was calculated for a variety of scanners to evaluate whether CBCT grey values can be related to attenuation coefficients. In addition, CBCT grey values were recalibrated according to the grey value scale obtained from MSCT, and the calibration error was assessed.
Methods and materials
For the evaluation of CBCT grey values, a customised polymethyl methacrylate (PMMA) phantom was manufactured by Leeds Test Objects Ltd (Boroughbridge, UK). The phantom is cylindrical and represents an adult head (diameter 16.0 cm, height 17.7 cm). It contains one central and six peripheral holes, which allow for the placement of inserts for image quality analysis (Figure 1) [22]. In this study, six different inserts were used. They consist of small PMMA cylinders (diameter 3.5 cm, height 2.0 cm) containing a central rod of 1.0 cm diameter. Five types of materials were used for the central rod: air, aluminium and hydroxyapatite (HA) in three different concentrations (50, 100 and 200 mg cm−3). The sixth insert contained homogeneous PMMA.
Figure 1.

Customised polymethyl methacrylate phantom for the evaluation of grey values. The insert holder of 16 cm diameter is shown along with a selection of inserts of 3.5 cm diameter. In this study, six types of inserts were used containing materials of different density.
As the region of interest (ROI) for dental radiographic images is typically located close to the periphery of the head, the inserts were placed in the six peripheral columns of the large phantom. The phantom was filled up using PMMA inserts to ensure that the total mass of an average human head was represented. 13 CBCT devices were used for the scanning of the phantom: 3D Accuitomo 170, 3D Accuitomo XYZ image intensifier version and Veraviewepocs 3D (J. Morita, Kyoto, Japan), GALILEOS Comfort (Sirona Dental Systems, Bensheim, Germany), i-CAT® Next Generation (Imaging Sciences International, Hatfield, PA), Kodak 9000 3D and Kodak 9500 (Carestream Health, New York, NY), NewTom VGi (Quantitative Radiology, Verona, Italy), Pax-Uni3D and Picasso Trio (Value Added Technologies, Yongin, South Korea), ProMax 3D (Planmeca Oy, Helsinki, Finland), SCANORA® 3D (Soredex, Tuusula, Finland) and SkyView (Cefla Dental Group, Imola, Italy). The phantom was also scanned with an MSCT device (Somatom Sensation 64, Siemens, Erlangen, Germany) using a bone and soft-tissue protocol to obtain reference grey values for the correlation analysis and the recalibration of the CBCT grey values. Where available, scanning was performed using different exposure and reconstruction parameters (e.g. FOV size, tube current–time product, voxel size). A total of 30 selected clinical CBCT scanning protocols were included (Table 1). Axial CBCT and MSCT slices from each insert are shown in Figure 2.
Table 1. Selected exposure protocols for cone beam CT (CBCT) and multislice CT (MSCT) devices.
| Protocola | |||||||
| Device | FOV | Doseb | FOV (cm) | kVp | mA | Exposure time (s) | Voxel size (mm) |
| CBCT | |||||||
| 3D Accuitomo 170 | LV | HI | 17×12 | 90 | 5 | 31 | 0.25 |
| LV | LO | 17×12 | 90 | 5 | 18 | 0.25 | |
| SV | HI | 6×6 | 90 | 5 | 31 | 0.08 | |
| SV | LO | 6×6 | 90 | 5 | 18 | 0.08 | |
| 3D Accuitomo XYZ | SV | 4×3 | 80 | 4 | 18 | 0.125 | |
| GALILEOS Comfort | LV | 15×15 | 85 | 7 | 4 | 0.29 | |
| i-CAT® Next Generation | XLV | HI | 23×16 | 120 | 5 | 7.3 | 0.3 |
| XLV | LO | 23×16 | 120 | 5 | 3.7 | 0.3 | |
| LV | XHI | 16×13 | 120 | 5 | 7.3 | 0.25 | |
| LV | HI | 16×13 | 120 | 5 | 4.0 | 0.25 | |
| LV | LO | 16×13 | 120 | 5 | 3.7 | 0.4 | |
| LV | XLO | 16×13 | 120 | 5 | 2 | 0.4 | |
| Kodak 9000 3D | SV | 5×3.6 | 70 | 10 | 11 | 0.076 | |
| Kodak 9500 | XLV | 20×18 | 90 | 10 | 11 | 0.3 | |
| LV | 14.5×8.3 | 90 | 10 | 11 | 0.2 | ||
| NewTom VGi | MV | HI | 12×8 | 110 | 12 | 15 | 0.24 |
| MV | LO | 12×8 | 110 | 4 | 10 | 0.24 | |
| PaX-Uni3D | SV | 5×5 | 85 | 6 | 20c | 0.2 | |
| Picasso Trio | MV | HI | 12×7 | 85 | 4.8 | 24c | 0.2 |
| MV | LO | 12×7 | 85 | 4.8 | 15c | 0.3 | |
| ProMax 3D | MV | HI1 | 8×8 | 84 | 14 | 12 | 0.16 |
| MV | HI2 | 8×8 | 84 | 14 | 12 | 0.32 | |
| MV | LO | 8×8 | 84 | 7 | 3 | 0.32 | |
| SCANORA® 3D | MV | HI | 10×7.5 | 85 | 15 | 3.8 | 0.2 |
| MV | ME | 10×7.5 | 85 | 8 | 3.8 | 0.2 | |
| MV | LO | 10×7.5 | 85 | 8 | 3.8 | 0.3 | |
| SkyView | LV | HI | 17×17 | 90 | 6.5 | 15 | 0.34 |
| LV | ME | 17×17 | 90 | 6.5 | 8 | 0.34 | |
| LV | LO | 17×17 | 90 | 6.5 | 6 | 0.34 | |
| Veraviewepocs 3D | MV | 8×8 | 70 | 3 | 17 | 0.125 | |
| MSCT | |||||||
| Somatom Sensation 64 | H30s | Full | 120 | 139 | 1 | 0.39 | |
| H60s | Full | 120 | 127 | 1 | 0.39 | ||
FOV, field of view; HI, high dose; LO, low dose; LV, large volume; ME, medium dose; MV, medium volume, SV, small volume; X, extra.
aA selection of protocols was made based on the availability of the device and the clinical relevance of the protocol. Other clinical exposure protocols may be available.
bThe mentioning of HI, ME or LO refers only to the exposure range of that specific device, the exposure of different devices cannot be compared based on this terminology.
cThese values represent the acquisition (scan) time, as the actual exposure time could not be retrieved from the image header and was not shared by the manufacturer.
Figure 2.
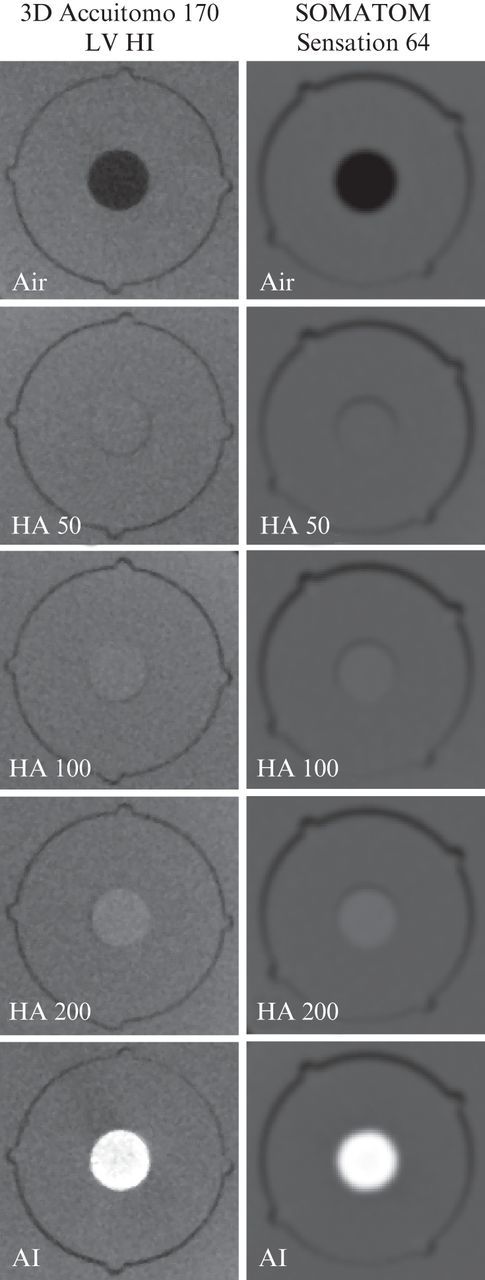
Cone beam and multislice CT slices of five inserts used for grey value correlation analysis. Polymethyl methacrylate insert not shown. For the multislice CT, the H60s bone protocol is shown.
All data sets were exported as axial stacks using the Digital Imaging and Communications in Medicine (DICOM) file format. ImageJ software (v. 1.41, National Institutes of Health, Bethesda, MD, http://rsb.info.nih.gov/ij/) was used for measurements on the CBCT and MSCT images. For all six materials inside the inserts, the mean grey value was determined using a circular ROI of approximately 2 cm2. Measurements from 10 consecutive axial slices were averaged, leading to a total measurement area of 20 cm2. The number of voxels included in the ROI was between 12 500 (voxel size 0.4 mm) and 346 260 (voxel size 0.076 mm). All measurements were performed by two researchers with extensive experience in image analysis.
Grey value measurements from the two MSCT protocols were averaged and used as reference values for correlation analysis. For all 30 CBCT protocols, Pearson's sample correlation coefficient was calculated for a linear fit using all six materials, with the formula:
 |
(1) |
In this formula, Xi and Yi are the mean grey values for the CBCT and MSCT for the different materials,  and
and  are the sample means, sX and sY are the sample standard deviation, and n equals six (i.e. air, PMMA, HA 50, HA 100, HA 200, aluminium). A second correlation coefficient was determined by excluding the air and aluminium measurements:
 |
(2) |
In this formula, n equals four (i.e. PMMA, HA 50, HA 100, HA 200). For both correlation coefficients, a value closer to 1 corresponds to an increased linear correlation between the grey values from the CBCT and MSCT. This does not imply that the numerical grey values themselves correspond.
As an additional measurement of grey value accuracy in the medium-density range, the CBCT measurements were rescaled using the measured MSCT values for air and aluminium as reference points. For the four other materials, the deviation (“error”) in grey value between the MSCT and the rescaled CBCT values was calculated and averaged using the formula:
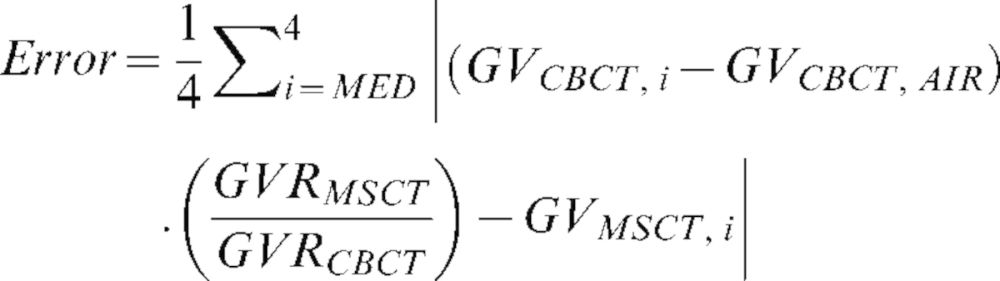 |
(3) |
GV is the measured mean grey value on the CBCT or MSCT image for material i, GVRMSCT is the grey value range (i.e. the difference in GV for air and aluminium) for the MSCT device and GVRCBCT is the grey value range for the CBCT in question. Equation (3) can be interpreted as a transformation of the CBCT grey values of PMMA and HA from their original scale to that of the MSCT image. This is done by subtracting the CBCT grey value for air and multiplying the result by the ratio of the grey value ranges for MSCT and CBCT, which is defined by air and aluminium. This result represents the grey value the material would have if the values for air and aluminium were equal to that of the MSCT. The difference between the transformed CBCT grey value and the actual MSCT grey value was calculated and averaged for the four materials.
Results
Table 2 shows the Pearson sample correlation coefficients (r-value) for the full-density range (rALL) and the medium-density range (rMED). The exposure protocols are ranked from high to low according to the value for rALL. The ranking for rMED is also included. The difference between the two r-values and the difference between the two ranks are shown. For the 30 investigated CBCT exposure protocols, rALL ranged between 0.7014 [3D Accuitomo XYZ, small volume (SV)] and 0.9996 [SCANORA 3D, medium volume (MV) medium dose (ME)]. Three protocols showed rALL-values below 0.8, all other protocols had coefficients of 0.96 or higher. Apart from five protocols, all rALL-values were higher than 0.99.
Table 2. Results of correlation analysis using multislice CT grey values as a reference.
| Protocol |
|||||||||
| Device | FOV | Dose | rALL | rMED | rMED-rALL | Rank rALL | Rank rMED | Rank rALL–rank rMED | Error |
| SCANORA® 3D | MV | ME | 0.9996 | 0.9820 | −0.02 | 1 | 10 | −9 | 35 |
| Kodak 9500 | LV | 0.9991 | 0.9820 | −0.02 | 2 | 9 | −7 | 35 | |
| 3D Accuitomo 170 | LV | HI | 0.9984 | 0.9797 | −0.02 | 3 | 12 | −9 | 55 |
| NewTom VGi | MV | HI | 0.9983 | 0.9135 | −0.08 | 4 | 22 | −18 | 54 |
| SCANORA 3D | MV | LO | 0.9982 | 0.8514 | −0.15 | 5 | 27 | −22 | 77 |
| NewTom VGi | MV | LO | 0.9982 | 0.9186 | −0.08 | 6 | 21 | −15 | 54 |
| 3D Accuitomo 170 | LV | LO | 0.9982 | 0.9809 | −0.02 | 7 | 11 | −4 | 63 |
| I-CAT® NG | LV | LO | 0.9980 | 0.9969 | −0.00 | 8 | 2 | 6 | 117 |
| I-CAT® NG | LV | XHI | 0.9972 | 0.9991 | +0.00 | 9 | 1 | 8 | 143 |
| 3D Accuitomo 170 | SV | LO | 0.9969 | 0.9773 | −0.02 | 10 | 13 | −3 | 100 |
| SCANORA 3D | MV | HI | 0.9967 | 0.8381 | −0.16 | 11 | 29 | −18 | 98 |
| 3D Accuitomo 170 | SV | HI | 0.9967 | 0.9767 | −0.02 | 12 | 14 | −2 | 105 |
| Galileos Comfort | LV | HI | 0.9965 | 0.9402 | −0.06 | 13 | 19 | −6 | 84 |
| Kodak 9500 | XLV | 0.9959 | 0.9713 | −0.02 | 14 | 15 | −1 | 91 | |
| SkyView | LV | HI | 0.9958 | 0.9677 | −0.03 | 15 | 16 | −1 | 99 |
| Picasso Trio | MV | HI | 0.9957 | 0.9660 | −0.03 | 16 | 17 | −1 | 166 |
| SkyView | LV | ME | 0.9957 | 0.9840 | −0.01 | 17 | 7 | 10 | 109 |
| ProMax 3D | MV | HI1 | 0.9954 | 0.9043 | −0.09 | 18 | 24 | −6 | 88 |
| I-CAT NG | XLV | HI | 0.9951 | 0.9135 | −0.08 | 19 | 23 | −4 | 196 |
| I-CAT NG | XLV | LO | 0.9948 | 0.9190 | −0.08 | 20 | 20 | 0 | 202 |
| SkyView | LV | LO | 0.9947 | 0.9838 | −0.01 | 21 | 8 | 13 | 134 |
| ProMax 3D | MV | HI1 | 0.9942 | 0.8832 | −0.11 | 22 | 26 | −4 | 92 |
| ProMax 3D | MV | HI2 | 0.9941 | 0.8877 | −0.11 | 23 | 25 | −2 | 91 |
| Picasso Trio | MV | LO | 0.9936 | 0.9963 | +0.00 | 24 | 3 | 21 | 196 |
| I-CAT NG | LV | XLO | 0.9905 | 0.9963 | +0.01 | 25 | 4 | 21 | 273 |
| I-CAT NG | LV | HI | 0.9885 | 0.9932 | +0.00 | 26 | 5 | 21 | 307 |
| PaX-Uni3D | SV | 0.9595 | 0.5620 | −0.40 | 27 | 30 | −3 | 365 | |
| Kodak 9000 3D | SV | 0.7997 | 0.8497 | +0.05 | 28 | 28 | 0 | 972 | |
| Veraviewepocs 3D | MV | 0.7777 | 0.9921 | +0.21 | 29 | 6 | 23 | 1261 | |
| 3D Accuitomo XYZ | SV | 0.7014 | 0.9625 | +0.26 | 30 | 18 | 12 | 1562 | |
Error, average deviation of medium density grey values after recalibration; HI, high dose; LO, low dose; LV, large volume; ME, medium dose; MV, medium volume; N.G., Next Generation; rALL, correlation coefficient for all six materials; rMED, correlation coefficient for medium density materials, excluding air and aluminium; rMED–rALL, absolute difference between correlation coefficients; SV, small volume; X, extra.
The rMED value was between 0.5620 (Pax-Uni3D, SV) and 0.9991 [i-CAT Next Generation, large volume (LV) extra high dose (XHI)]. Compared with the value for rALL, most exposure protocols showed a drop for rMED. For five protocols, changes in r-value were minimal (<0.006). It is noteworthy that four of these five protocols are from the i-CAT Next Generation LV, whereas the extra large volume (XLV) protocols from this device did show a decrease for rMED. For 22 protocols, a clear drop for rMED was seen, with a decrease ranging between 0.011 and 0.398 with an average of 0.073. For three protocols (VeraviewEpocs 3D MV, 3D Accuitomo XYZ SV, Kodak 9000 3D SV) the coefficient showed an increase for rMED ranging between 0.050 and 0.261, with an average of 0.175. These three protocols showed the worst score for the full-density range, but are ranked at 6, 18 and 28 for the medium-density range, respectively.
When considering the ranking of the protocols for the two calculated r-values, large differences in ranks can be seen for most exposure protocols. Only four exposure protocols are ranked in the upper third (i.e. 10 or higher) for both r-values, showing a consistent correlation irrespective of the density range. For 12 protocols, the difference in rank was 5 or lower. For 8 protocols, the difference was 15 or higher.
The average grey value deviation of the four medium-density materials after rescaling to the MSCT values was 241, corresponding to 5.9% of the total grey value range after rescaling to the MSCT values (i.e. 12 bit or 4096 grey values). The range of errors was between 35 (SCANORA 3D MV ME and Kodak 9500 LV) and 1562 (3D Accuitomo XYZ SV). For the protocols with an r-value higher than 0.99 for the full-density range, the average error was 110 (2.7%). The three protocols with the lowest rALL-value (<0.80) had an average error of 1265 (30.9%). A good correlation was seen between rALL and the calculated error (inverse linear relationship, r=−0.986). No correlation was seen between the rMED and the average error (r=−0.046).
Discussion
Three parameters were used to evaluate the linearity of CBCT grey values, providing complementary information. Correlation coefficients were generally high for the full-density range between air and aluminium. Most CBCT protocols showed an rALL-value higher than 0.99, implying an excellent linear fit between the CBCT and MSCT grey values. However, the possibility for CBCT voxel values to be calibrated for density measurements cannot be evaluated solely based on the overall correlation with MSCT. Especially for large FOV devices containing all inserts in a single scan, a general correlation between grey values and density is self-evident, as it would be for any X-ray modality. The second correlation coefficient, which was calculated for the four materials in the medium-density range, provided further insights regarding the use of CBCT grey values for density measurements. When considering only the medium-density range, the correlation coefficient is more sensitive to variability in grey values. The rMED was clearly lower than the rALL for most devices, although for some protocols the difference was minimal. Since the previous studies have found correlation coefficients that were interpreted as “high” but were lower than most of the rMED values in this study [15,16], additional information was needed to evaluate the coefficients calculated in this study, avoiding subjective interpretation. The error values after recalibration demonstrate whether or not the generally high correlation coefficients imply that the currently investigated CBCT devices are useful for density assessment. The average error for the materials in the medium-density range clearly shows the error margin that can be expected when using CBCT grey values in a quantitative way. The two exposure protocols with the highest rALL-value both had an average error of 35; for all other protocols this error was larger than 50. Half of the exposure protocols showed an error value larger than 100.
When looking at the use of HU in dental practice, the implication of the grey value errors that were calculated in this study can be investigated. The main use for density estimations would be in the evaluation of bone tissue before implant placement. Different studies have investigated bone quality based on HU from MSCT scans from implant patients [3,23-27]. However, there are different terms currently used in literature to denote bone tissue attributes, and there is no standardised definition for terms like bone quantity and quality [28]. In addition, various bone classification systems have been proposed, and there is no consistency regarding the diagnostic assessment of bone tissue on 3D radiographic images. Nevertheless, the classification of bone tissue based on HU has been assessed, and ranges have been proposed [27]. It can be seen that the error margins for some CBCT protocols are well below the proposed HU ranges, showing that density estimations with reasonable accuracy would be possible for implant planning using these CBCT protocols. However, previous studies have used CBCT grey values for the differential diagnosis and follow-up of bony lesions [29-32]. Based on the current results, the quantitative use of CBCT grey values for differentiating lesions should be generally avoided. Even the best-performing devices will not enable different types of lesions to be distinguished (e.g. cysts and granulomas) based on grey values. For the detection of root lesions and the evaluation of bone healing over time, the added value of CBCT grey values is questionable, as visual inspection typically provides the required information [33-35]. Furthermore, no thresholds or ranges for bone healing based on HU have been determined.
It is important to note that the current evaluation did not take the absolute grey values into account, as they are often dynamically distributed along an extended (e.g. 16 bit) scale. Before actually using CBCT grey values for density estimations, a histogram calibration is needed. This calibration process can be taken care of by the manufacturer, but it is also possible for the user to implement it in clinical practice. The use of a reference object in the FOV containing at least two materials of known density could allow for a routine HU calibration, similar to the use of reference phantoms in quantitative CT (QCT). Further investigation is needed to assess the accuracy and clinical applicability of this kind of calibration method.
There are different CBCT exposure factors that contribute to the deviation of grey values. Exposures in dental CBCT imaging yield doses far below conventional MSCT protocols. Although the spatial resolution of CBCT is considered to be higher than MSCT, the amount of noise is higher as well. Excessive noise may lead to aberrant grey values when measuring the mean voxel value of small areas. However, in this study the effect of noise has been limited because of the large measurement area. For most devices, correlation coefficients were similar for high- and low-dose protocols, showing that noise and voxel size did not affect the measurements. In practice, when small bony lesions or areas adjacent to planned implants would be investigated, the noise will randomly affect the measured mean grey value.
Another factor is beam hardening, which occurs primarily with low-energy beams passing through dense tissue, resulting in the increase of the beam energy (i.e. hardening) due to the predominant absorption of low-energy photons. The hardened X-rays will pass through adjacent tissues more easily, resulting in an underestimation of the density of these tissues appearing as dark areas on the image [19,36,37]. In addition, the inclusion of metal objects in the scanned area can result in additional grey value inaccuracy in clinical practice. Metal artefacts are a prominent feature in all forms of CT imaging, causing dark and bright streaks in the vicinity of the metal object due to a variety of effects such as beam hardening, scatter and photon starvation [36,37].
Another aspect of CBCT imaging that affects grey value distributions is the limited FOV, which can be as small as a few cubic centimetres. Although field limitation is an essential part of dose reduction for CBCT examinations, there are certain implications in terms of grey value accuracy, as previously shown by Katsumata et al [14]. The presence of non-homogeneous and non-symmetrical tissues outside the FOV leads to variable projection data from different angles along the rotation arc. This is known as the local tomography effect, and it can lead to grey value gradients or even artefacts, depending on the mass and spatial distribution of materials or tissues outside the FOV [12,38]. In this study, the effect of local tomography was limited because the position of the insert columns was accurately reproduced when only the peripheral portion of the phantom could be scanned. Any shading or gradient due to the asymmetrical position of the phantom would have influenced all inserts equally. Previous studies have investigated the effect of the position of test objects on CBCT grey values, with contradictory results for different scanners. Although the theory behind the local tomography effect is sound, the degree of this effect may vary between devices based on the interplay of exposure and reconstruction factors.
Three devices showed an r-value which was clearly lower (<0.8) than the others (>0.95). Apart from the local tomography effect, which has been described above, the devices appear to have incorporated a “histogram shift” in their reconstruction algorithm, implying that the grey values are distributed based on the contents of the scan. In this way, the contrast of each individual scan is optimised, but grey values differ between scans containing low- or high-density materials. The presence of high-density objects in the scan shifts the histogram, leading to lower grey values throughout the image. This is illustrated in Figure 3, showing axial slices through the HA 200 and aluminium inserts of the 3D Accuitomo XYZ, Veraviewepocs 3D and Kodak 9000 3D, as well as the grey value histograms for these images. All images are displayed using the same window/level setting. It can be seen that the aluminium rod leads to a shift of the histogram to the left, resulting in a relatively low grey value of aluminium compared with HA 200. The grey value of the PMMA background illustrates the histogram shift clearly, as it appears much darker on the images containing aluminium. For these three devices, which showed the lowest rALL-value for the full density range and excessive error values after recalibration, a clear increase for the rMED value was seen, as the effect of the histogram shift was much less pronounced when only considering the four medium-density materials. This dynamic display range is an intentional choice by the manufacturer, renouncing the quantitative use of grey values.
Figure 3.
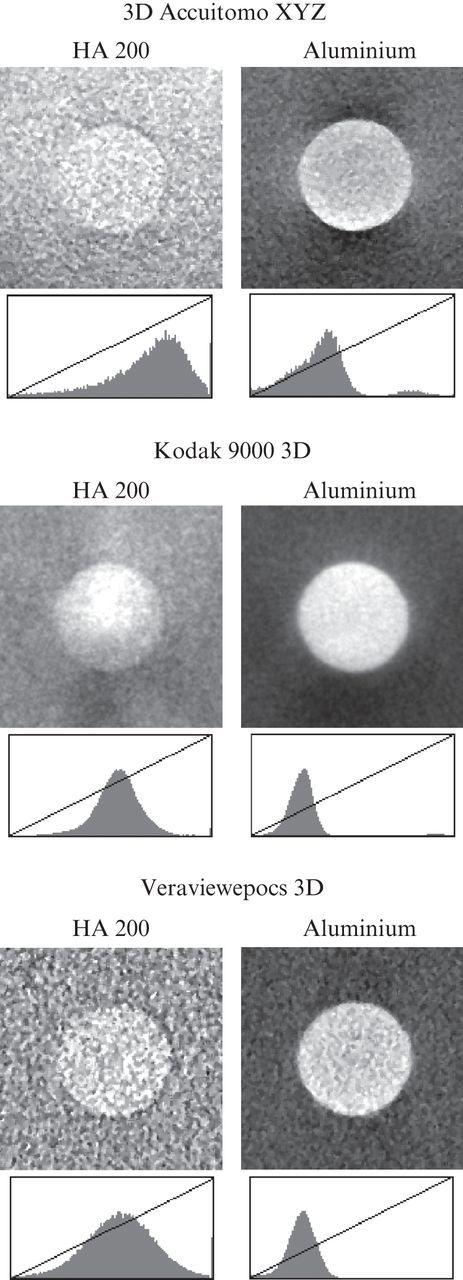
Slices from the HA 200 and aluminium inserts, showing the effect of histogram shifting. The presence of an aluminium rod results in a shift towards the left (i.e. lower grey values), resulting in relatively low grey values of aluminium compared with HA 200. The histograms correspond to the entire axial slice rather than the illustrated region of interest containing the rods.
When comparing the current results to previous investigations on the use of CBCT grey values, it should be noted that findings and conclusions from past studies were often limited to a single CBCT device [11-18]. However, because of the wide range seen in CBCT image quality and radiation dose, it is not feasible to make statements regarding CBCT as a whole based on the results from particular CBCT devices. In this study, 30 exposure protocols from 13 CBCT devices were evaluated, which is still only a sample from the large amount of devices that are currently on the market. It is therefore not possible to draw general conclusions regarding the use of CBCT for density estimations. The current study shows that exposure protocols from certain devices show stable grey values that could be related to HU and density. However, the correlation coefficients and error values were independent of the absolute grey values of the CBCT images. In practice, the actual grey scale will depend on the bit depth of the images and the calibration by the manufacturers. Even for MSCT devices, the relation between grey values and density is, to some extent, scanner type-specific. It is doubtful if grey value ranges for bone tissue classification, bone healing or differential diagnosis can be determined for CBCT. If this is not possible, the quantitative application of CBCT grey values will be limited, and the practitioner should use these with great care.
Recently, alternative methods of bone tissue analysis using CBCT images have been proposed. Fanuscu and Chang [39] have investigated the relation between morphometric parameters obtained from micro-CT images and bone density from CT and 2D radiography. While the study should be extended to larger sample sizes, there is an indication that morphometric parameters could be useful for application on CBCT data sets as well for the assessment of bone quality, providing that the image quality suffices in terms of spatial resolution, noise and bone contrast. Alternatively, structural analysis using fractal dimension can provide an evaluation of bone density and structure. Torres et al [40] applied fractal dimension analysis on bisphosphonate-associated osteonecrosis patients. Although fractal analysis needs to be further explored before implementation in clinical practice, it is certainly useful to apply it retrospectively, providing that large patient samples can be used. Hua et al [13] related fractal analysis and morphometric analysis on CBCT data with bone mineral density from dual energy X-ray absorptiometry scans. They found a correlation between fractal dimension and morphometric bone area, but not for morphometric bone density. In two related studies by Hohlweg-Majert et al [10,11], the applicability of two CBCT systems for the measurement of bone quantity and quality was assessed. Although it was found that structural analysis of trabecular bone can only be performed using images of high spatial resolution, the small voxel sizes (<200 μm) of certain CBCT protocols point out that it should be possible to apply them for the assessment of bone density and architecture. Although improvements in CBCT imaging (e.g. reconstruction) could lead to more accurate grey value distributions that could be used as HU, the topic of bone tissue analysis using fractal or morphometric analysis should be further explored in vitro or using patient data. Providing that large sample sizes are used, varying CBCT devices are included and a worthy gold standard is available, dedicated and validated bone quality parameters could be determined. Jiang et al [41] investigated the combination of BMD and structural analysis to predict mechanical properties of the bone, finding an improvement in the predictive value when combining multiple parameters. Possibly, a prediction model for CBCT with multiple variables will offer the most accurate correlation with mechanical properties of the bone.
Conclusions
Even though most CBCT devices showed a good overall correlation with CT numbers, large errors can be seen when using the grey values in a quantitative way. The relatively large amount of noise in CBCT may lead to inaccurate grey values in the medium-density range, and the limited FOV diameter implies that the part of the scanned object which is outside the reconstructed volume can affect the grey values inside the FOV in a non-uniform way. Furthermore, it is possible that the grey values are distributed based on the densities within the FOV, leading to shifts in the grey value histogram. Although it could be possible to obtain pseudo-HU from certain CBCTs, the main focus in research should be the investigation and validation of alternative methods of assessing bone tissue characteristics.
Acknowledgments
The authors wish to thank Pieter Avontroodt, Bruno Collaert, Walter Coudyzer, Renaat De Clerck, Marc Hermans, Jules Poukens, David Roudergues, Luc Van den Bossche and Olaf Veth for kindly enabling the scanning of the phantom on various devices.
Footnotes
The research leading to these results has received funding from the European Atomic Energy Community's Seventh Framework Programme FP7/2007–2011 under grant agreement no 212246 (SEDENTEXCT: Safety and Efficacy of a New and Emerging Dental X-ray Modality).
References
- 1.Bou Serhal C, Jacobs R, Quirynen M, van Steenberghe D. Imaging technique selection for the preoperative planning of oral implants: a review of the literature. Clin Implant Dent Relat Res 2002;4:156–72. [DOI] [PubMed] [Google Scholar]
- 2.Guerrero ME, Jacobs R, Loubele M, Schutyser F, Suetens P, van Steenberghe D. State-of-the-art on cone beam CT imaging for preoperative planning of implant placement. Clin Oral Investig 2006;10:1–7. [DOI] [PubMed] [Google Scholar]
- 3.Turkyilmaz I, Tumer C, Ozbek EN, Tözüm TF. Relations between the bone density values from computerized tomography, and implant stability parameters: a clinical study of 230 regular platform implants. J Clin Periodontol 2007;34:716–22. [DOI] [PubMed] [Google Scholar]
- 4.Pauwels R, Beinsberger J, Collaert B, Theodorakou C, Rogers J, Walker A, et al. Effective dose range for dental cone beam computed tomography scanners. Eur J Radiol 2012;81:267–71. [DOI] [PubMed] [Google Scholar]
- 5.Hatcher DC, Dial C, Mayorga C. Cone beam CT for pre-surgical assessment of implant sites. J Calif Dent Assoc 2003;31:825–33. [PubMed] [Google Scholar]
- 6.Monsour PA, Dudhia R. Implant radiography and radiology. Aust Dent J 2008;53:S11–25. [DOI] [PubMed] [Google Scholar]
- 7.Van Assche N, van Steenberghe D, Guerrero ME, Hirsch E, Schutyser F, Quirynen M, et al. Accuracy of implant placement based on pre-surgical planning of three-dimensional cone-beam images: a pilot study. J Clin Periodontol 2007;34:816–21. [DOI] [PubMed] [Google Scholar]
- 8.Veyre-Goulet S, Fortin T, Thierry A. Accuracy of linear measurement provided by cone beam computed tomography to assess bone quantity in the posterior maxilla: a human cadaver study. Clin Implant Dent Relat Res 2008;10:226–30. [DOI] [PubMed] [Google Scholar]
- 9.Moreira CR, Sales MA, Lopes PM, Cavalcanti MG. Assessment of linear and angular measurements on three-dimensional cone-beam computed tomographic images. Oral Surg Oral Med Oral Pathol Oral Radiol Endod 2009;108:430–6. [DOI] [PubMed] [Google Scholar]
- 10.Hohlweg-Majert B, Pautke C, Deppe H, Metzger MC, Wagner K, Schulze D. Qualitative and quantitative evaluation of bony structures based on DICOM dataset. J Oral Maxillofac Surg 2011;69:2763–70. [DOI] [PubMed] [Google Scholar]
- 11.Hohlweg-Majert B, Metzger MC, Kummer T, Schulze D. Morphometric analysis - Cone beam computed tomography to predict bone quality and quantity. J Craniomaxillofac Surg 2011;39:330–4. [DOI] [PubMed] [Google Scholar]
- 12.Bryant JA, Drage NA, Richmond S. Study of the scan uniformity from an i-CAT cone beam computed tomography dental imaging system. Dentomaxillofac Radiol 2008;37:365–74. [DOI] [PubMed] [Google Scholar]
- 13.Hua Y, Nackaerts O, Duyck J, Maes F, Jacobs R. Bone quality assessment based on cone beam computed tomography imaging. Clin Oral Implants Res 2009;20:767–71. [DOI] [PubMed] [Google Scholar]
- 14.Katsumata A, Hirukawa A, Okumura S, Naitoh M, Fujishita M, Ariji E, et al. Relationship between density variability and imaging volume size in cone-beam computerized tomographic scanning of the maxillofacial region: an in vitro study. Oral Surg Oral Med Oral Pathol Oral Radiol Endod 2009;107:420–5. [DOI] [PubMed] [Google Scholar]
- 15.Lagravère MO, Carey J, Ben-Zvi M, Packota GV, Major PW. Effect of object location on the density measurement and Hounsfield conversion in a NewTom 3G cone beam computed tomography unit. Dentomaxillofac Radiol 2008;37:305–8. [DOI] [PubMed] [Google Scholar]
- 16.Naitoh M, Hirukawa A, Katsumata A, Ariji E. Evaluation of voxel values in mandibular cancellous bone: relationship between cone-beam computed tomography and multislice helical computed tomography. Clin Oral Implants Res 2009;20:503–6. [DOI] [PubMed] [Google Scholar]
- 17.Naitoh M, Hirukawa A, Katsumata A, Ariji E. Prospective study to estimate mandibular cancellous bone density using large-volume cone-beam computed tomography. Clin Oral Implants Res 2010;21:1309–13. [DOI] [PubMed] [Google Scholar]
- 18.Fuster-Torres MÁ, Peñarrocha-Diago M, Peñarrocha-Oltra D, Peñarrocha-Diago M. Relationships between bone density values from cone beam computed tomography, maximum insertion torque, and resonance frequency analysis at implant placement: a pilot study. Int J Oral Maxillofac Implants 2011;26:1051–6. [PubMed] [Google Scholar]
- 19.Katsumata A, Hirukawa A, Okumura S, Naitoh M, Fujishita M, Ariji E, et al. Effects of image artifacts on gray-value density in limited-volume cone-beam computerized tomography. Oral Surg Oral Med Oral Pathol Oral Radiol Endod 2007;104:829–36. [DOI] [PubMed] [Google Scholar]
- 20.Mah P, Reeves TE, McDavid WD. Deriving Hounsfield units using grey levels in cone beam computed tomography. Dentomaxillofac Radiol 2010;39:323–35. [DOI] [PMC free article] [PubMed] [Google Scholar]
- 21.Nackaerts O, Maes F, Yan H, Couto Souza P, Pauwels R, Jacobs R. Analysis of intensity variability in multislice and cone beam computed tomography. Clin Oral Implants Res 2011;22:873–9. [DOI] [PubMed] [Google Scholar]
- 22.Pauwels R, Stamatakis H, Manousaridis G, Walker A, Michielsen K, Bosmans H, et al. Development and applicability of a quality control phantom for dental cone-beam CT. J Appl Clin Med Phys 2011;12:245–60. [DOI] [PMC free article] [PubMed] [Google Scholar]
- 23.Fuh LJ, Huang HL, Chen CS, Fu KL, Shen YW, Tu MG, et al. Variations in bone density at dental implant sites in different regions of the jawbone. J Oral Rehabil 2010;37:346–51. [DOI] [PubMed] [Google Scholar]
- 24.Turkyilmaz I, Tözüm TF, Tumer C, Ozbek EN. Assessment of correlation between computerized tomography values of the bone, and maximum torque and resonance frequency values at dental implant placement. J Oral Rehabil 2006;33:881–8. [DOI] [PubMed] [Google Scholar]
- 25.Sogo M, Ikebe K, Yang TC, Wada M, Maeda Y. Assessment of bone density in the posterior maxilla based on Hounsfield units to enhance the initial stability of implants. Clin Implant Dent Relat Res 2012. 14 Supple 1:e183–7. [DOI] [PubMed] [Google Scholar]
- 26.de Oliveira RC, Leles CR, Normanha LM, Lindh C, Ribeiro-Rotta RF. Assessments of trabecular bone density at implant sites on CT images. Oral Surg Oral Med Oral Pathol Oral Radiol Endod 2008;105:231–8. [DOI] [PubMed] [Google Scholar]
- 27.Norton MR, Gamble C. Bone classification: an objective scale of bone density using the computerized tomography scan. Clin Oral Implants Res 2001;12:79–84. [DOI] [PubMed] [Google Scholar]
- 28.Ribeiro-Rotta RF, Lindh C, Pereira AC, Rohlin M. Ambiguity in bone tissue characteristics as presented in studies on dental implant planning and placement: a systematic review. Clin Oral Implants Res 2011;22:789–801. [DOI] [PubMed] [Google Scholar]
- 29.Simon JH, Enciso R, Malfaz JM, Roges R, Bailey-Perry M, Patel A. Differential diagnosis of large periapical lesions using cone-beam computed tomography measurements and biopsy. J Endod 2006;32:833–7. [DOI] [PubMed] [Google Scholar]
- 30.Kaya S, Yavuz I, Uysal I, Akkuş Z. Measuring bone density in healing periapical lesions by using cone beam computed tomography: a clinical investigation. J Endod 2012;38:28–31. [DOI] [PubMed] [Google Scholar]
- 31.Rosenberg PA, Frisbie J, Lee J, Lee K, Frommer H, Kottal S, et al. Evaluation of pathologists (histopathology) and radiologists (cone beam computed tomography) differentiating radicular cysts from granulomas. J Endod 2010;36:423–8. [DOI] [PubMed] [Google Scholar]
- 32.Cankaya AB, Erdem MA, Isler SC, Demircan S, Soluk M, Kasapoglu C, et al. Use of cone-beam computerized tomography for evaluation of bisphosphonate-associated osteonecrosis of the jaws in an experimental rat model. Int J Med Sci 2011;8:667–72. [DOI] [PMC free article] [PubMed] [Google Scholar]
- 33.Ordinola-Zapata R, Bramante CM, Duarte MH, Ramos Fernandes LM, Camargo EJ, de Moraes IG, et al. The influence of cone-beam computed tomography and periapical radiographic evaluation on the assessment of periapical bone destruction in dog's teeth. Oral Surg Oral Med Oral Pathol Oral Radiol Endod 2011;112:272–9. [DOI] [PubMed] [Google Scholar]
- 34.Patel S, Wilson R, Dawood A, Mannocci F. Detection of periapical pathology using intraoral radiography and cone beam computed tomography - a clinical study. Int Endod J 2012;45:702–10. [DOI] [PubMed] [Google Scholar]
- 35.Kumar V, Gossett L, Blattner A, Iwasaki LR, Williams K, Nickel JC. Comparison between cone-beam computed tomography and intraoral digital radiography for assessment of tooth root lesions. Am J Orthod Dentofacial Orthop 2011;139:e533–41. [DOI] [PubMed] [Google Scholar]
- 36.Schulze R, Heil U, Gross D, Bruellmann DD, Dranischnikow E, Schwanecke U, et al. Artefacts in CBCT: a review. Dentomaxillofac Radiol 2011;40:265–73. [DOI] [PMC free article] [PubMed] [Google Scholar]
- 37.Pauwels R, Stamatakis H, Bosmans H, Bogaerts R, Jacobs R, Horner K, et al. Quantification of metal artifacts on cone beam computed tomography images. Clin Oral Implants Res 2011. Epub ahead of print. doi: 10.1111/j.1600–0501.2011.02382.x. [DOI] [PubMed] [Google Scholar]
- 38.Siltanen S, Kolehmainen V, Järvenpää S, Kaipio JP, Koistinen P, Lassas M, et al. Statistical inversion for medical x-ray tomography with few radiographs: I. General theory. Phys Med Biol 2003;48:1437–63. [DOI] [PubMed] [Google Scholar]
- 39.Fanuscu MI, Chang TL. Three-dimensional morphometric analysis of human cadaver bone: microstructural data from maxilla and mandible. Clin Oral Implants Res 2004;15:213–18. [DOI] [PubMed] [Google Scholar]
- 40.Torres SR, Chen CS, Leroux BG, Lee PP, Hollender LG, Schubert MM. Fractal dimension evaluation of cone beam computed tomography in patients with bisphosphonate-associated osteonecrosis. Dentomaxillofac Radiol 2011;40:501–5. [DOI] [PMC free article] [PubMed] [Google Scholar]
- 41.Jiang C, Giger ML, Chinander MR, Martell JM, Kwak S, Favus MJ. Characterization of bone quality using computer-extracted radiographic features. Med Phys 1999;26:872–9. [DOI] [PubMed] [Google Scholar]