Abstract
Microvascular obstruction (MVO) is usually seen in a proportion of patients with acute myocardial infarction following reperfusion therapy of an occluded coronary artery. It is characterized by damage and dysfunction of the myocardial microvasculature with a no-reflow phenomenon within the infarct zone. While MVO may be demonstrated via a number of different imaging modalities, cardiac MR (CMR) enables accurate identification of MVO and also permits assessment of infarct extent and overall left ventricular function during the same imaging examination. We present a pictorial review of the characteristic appearances of MVO on CMR and highlight the importance of this imaging diagnosis for patient outcome following acute myocardial infarction.
Microvascular obstruction (MVO) usually arises following reperfusion therapy in patients after a prolonged period of severe myocardial ischaemia.1,2 It is most commonly, but not exclusively, seen in patients with a delayed presentation to definitive reperfusion treatment following acute coronary occlusion.3,4 MVO was first described in the 1970s and is characterized by damage and dysfunction of the myocardial microvasculature resulting in a “no-reflow” phenomenon, where, essentially, blood flow cannot penetrate beyond the myocardial capillary bed.3 While several different imaging modalities may be utilized in the diagnosis of MVO, cardiac MR (CMR) has a number of distinct advantages as it enables precise delineation of both infarct site and MVO along with accurate quantification of both global and segmental left ventricular function during a single imaging examination. Accurate diagnosis of MVO is of great importance, as its presence has been shown to be an independent predictor of poor prognostic outcome following myocardial infarction, including adverse left ventricular remodelling, subsequent major adverse cardiovascular events and death.1,4–6
PATHOPHYSIOLOGY OF MICROVASCULAR OBSTRUCTION
The pathophysiological mechanisms that result in MVO remain ill defined, but MVO is likely to result from an interaction of multiple related pathological processes.3,7 In animal models, ischaemia causes endothelial damage that narrows the capillary lumen impairing blood flow.7 The presence of further luminal narrowing of the myocardial capillary bed caused by combined aggregates of fibrin, platelets and erythrocytes creates an additional mechanical barrier to blood flow. Leucocyte aggregation is also seen at sites of MVO that, as well as causing mechanical obstruction to blood flow, may also impair vasodilatation by triggering oxidative stress pathways.3,7 Human studies have shown that microembolization plays an important contributory role in MVO, with distal showers of embolic material causing additional mechanical obstruction and stimulating an inflammatory response.3
Myocardial haemorrhage can be seen within the infarct core, and although MVO and haemorrhage are closely linked, they remain distinct pathological entities.3,5 At sites of MVO, red cell extravasation may be demonstrated in regions of endothelial damage at the myocardial capillary bed.3 Animal studies have shown that MVO may occur in the absence of myocardial haemorrhage, but myocardial haemorrhage does not occur in the absence of MVO.8 In addition, although there is concurrence in the anatomical site of both processes, the site of myocardial haemorrhage is typically smaller than the site of MVO.8
CARDIAC MR IMAGING PROTOCOL AND APPEARANCES OF MICROVASCULAR OBSTRUCTION
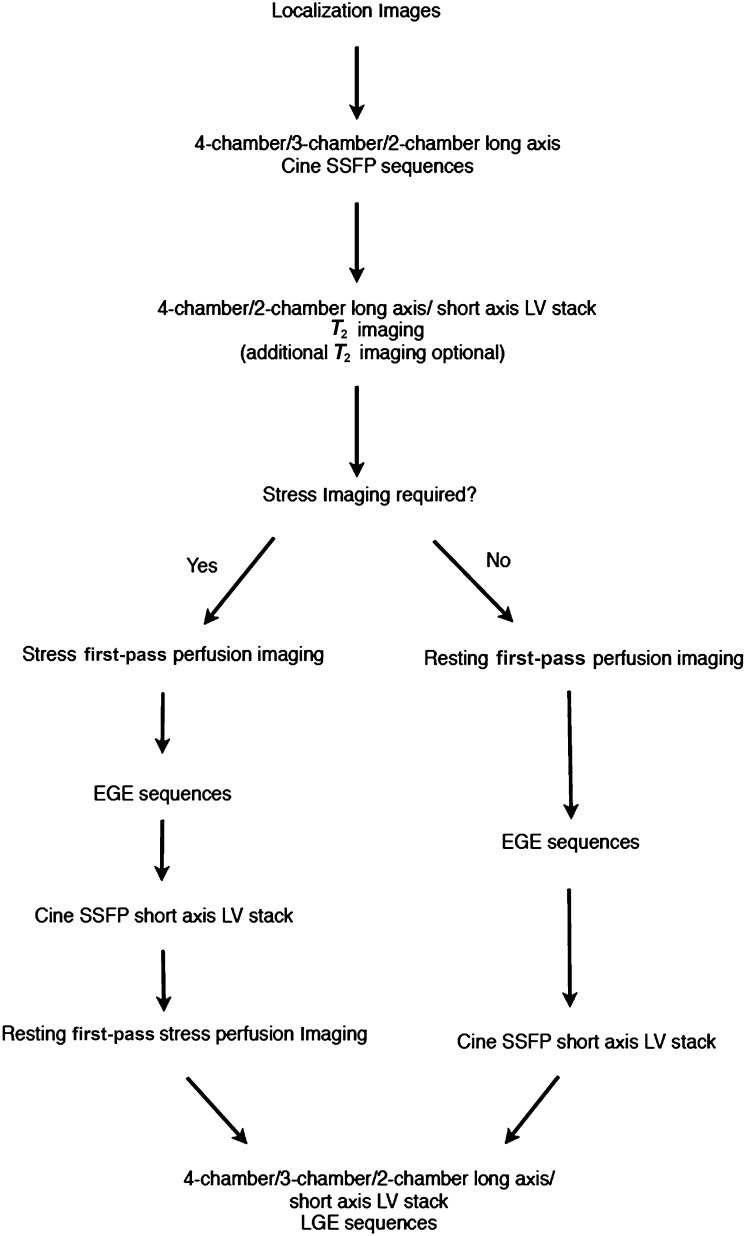
A recommended CMR protocol for the investigation of MVO is shown in Figure 1. On first-pass perfusion studies (performed during and immediately following the injection of gadolinium contrast agent), MVO typically appears as a central dark focus within an area of early enhancing myocardium signifying a focal absence of contrast enhancement within a site of myocardial infarct (Figure 2).9 MVO demonstrates similar appearances on both early gadolinium-enhancement (EGE) sequences (typically performed between 1 and 3 min post gadolinium injection) and late gadolinium-enhancement (LGE) sequences (typically performed at 8–10 min post gadolinium injection). It is important to note that a longer inversion time (TI) of approximately 440 ms is used when acquiring EGE sequences than with a shorter TI time of between 220 and 250 ms used to acquire the LGE sequences.9 MVO is seen on both EGE and LGE imaging sequences as a central focus of low signal within an avidly enhancing site of myocardial infarction.4,9 The area of myocardium involved typically corresponds to a recognized anatomical coronary artery territory (Figures 2–4). The cine steady-state free-procession sequences show that the affected segments of myocardium are hypokinetic or akinetic as one might expect for a site of myocardial infarction. T2 weighted images performed as part of the CMR imaging protocol can be used to demonstrate myocardial oedema and potential areas of myocardium at risk. This is in marked distinction to MVO, which represents areas of irreversible myocardial infarction.
Figure 1.
Standard cardiac MR protocol used for patients being assessed for possible microvascular obstruction. EGE, early gadolinium enhancement; LGE, late gadolinium enhancement; LV, left ventricle; SSFP, steady state free procession.
Figure 2.
Cardiac MR acquired 4 days following delayed presentation acute ST elevation myocardial infarction to evaluate for myocardial viability. Images from (a) short axis resting first-pass perfusion sequence, (b) short axis steady-state free-procession sequence acquired 3 min post gadolinium injection, and (c) short axis late gadolinium enhancement (LGE) sequence, all acquired at the mid left ventricular level and (d) three-chamber LGE sequence showing a focal area of microvascular obstruction within the mid inferolateral left ventricular wall (white arrows). Metal artefact related to previous sternotomy wires is also evident (interrupted white arrow). The measured ejection fraction was 42%.
Figure 4.
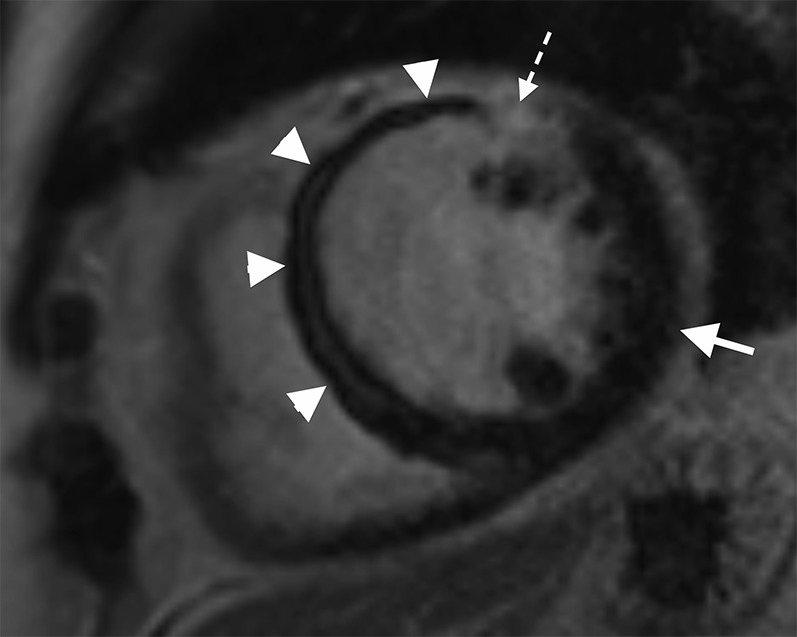
Cardiac MR performed following a late presentation ST elevation myocardial infarction. Short axis late gadolinium enhancement sequence performed at mid left ventricle level showing an extensive area of microvascular obstruction (MVO) within the septal wall extending onto the anterior wall (white arrow heads) with only a very limited rim of late enhancement (interrupted white arrow). Note the marked difference in appearance between the nulled normal myocardium of the lateral wall (white arrow) and the site of MVO within the septal wall. The measured ejection fraction was 27%.
Figure 3.
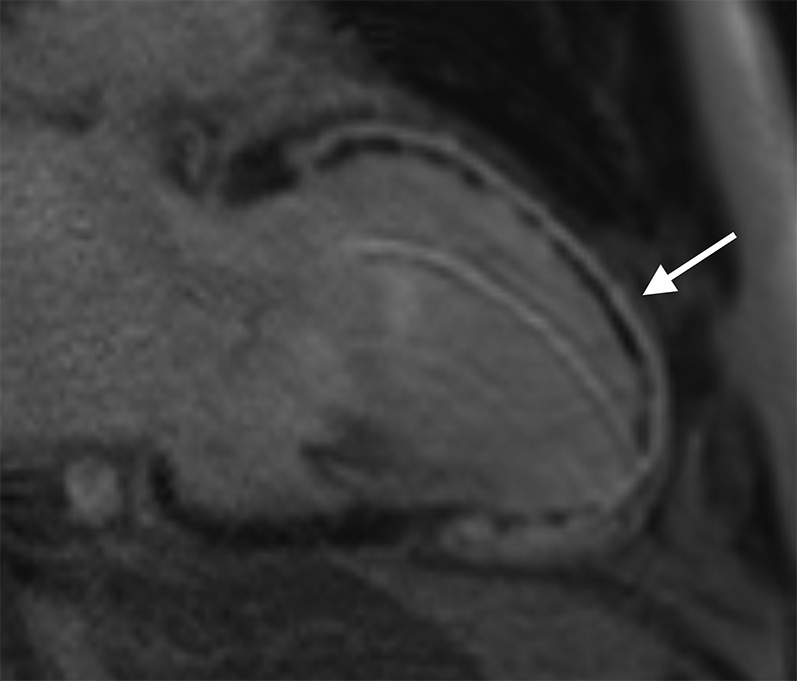
Cardiac MR performed in a patient 3 days post primary percutaneous coronary intervention to the left anterior descending coronary artery. Two-chamber long axis late gadolinium enhancement sequence showing full thickness infarct involving the entire anterior left ventricular wall extending onto the apex (white arrow). Subendocardial low signal within the infarct corresponds to a large region of microvascular obstruction. The measured ejection fraction was 25%.
Although the appearances of MVO seen on first-pass perfusion, EGE and LGE sequences are broadly similar, there are some important differences. As a result of slow diffusion of gadolinium contrast agent over time around the periphery of the no-reflow site, the true area of MVO seen on LGE sequences is smaller than either first-pass perfusion or EGE.9 As a result, first-pass perfusion imaging identifies the presence of MVO in a larger proportion of patients than with either EGE or LGE imaging.9 However, and perhaps more importantly, the presence of MVO on LGE is a more accurate prognostic marker than MVO seen on first pass perfusion or EGE sequences in predicting patients at risk of adverse left ventricular remodelling and future major adverse cardiovascular events.1,4
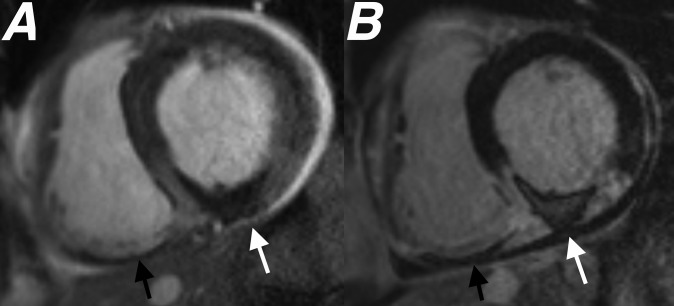
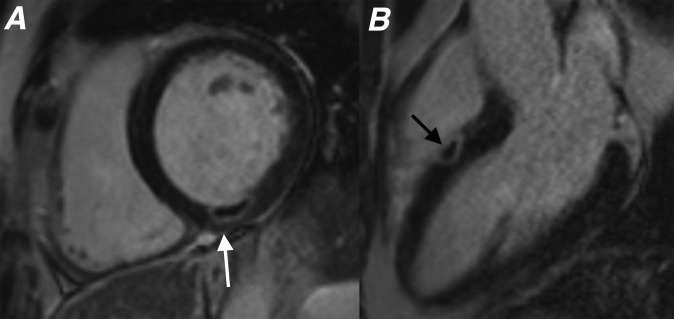
It is important to note that MVO may affect any coronary artery territory and may be seen at sites of myocardial infarct involving the right ventricle (Figure 5). Although MVO is seen most commonly in patients following myocardial infarction secondary to coronary artery occlusion, it may also be seen following iatrogenic myocardial damage, for example, following myocardial ablation therapy for ventricular arrhythmias (Figure 6).
Figure 5.
Cardiac MR performed 4 days after primary percutaneous coronary intervention to the right coronary artery. Images from (a) short axis steady-state free-procession cine sequence performed 3 min following gadolinium injection and (b) short axis late gadolinium enhancement study both performed at basal left ventricular level showing a large area of microvascular obstruction (MVO) within the inferior left ventricular wall (white arrows). An additional area of MVO is seen within the inferior right ventricular wall (black arrows), highlighting that MVO is not just limited to infarcts involving the left ventricle. The measured ejection fraction was 46%.
Figure 6.
Cardiac MR study performed within 10 days following myocardial radiofrequency ablation therapy in two different patients. (a) Short axis late gadolinium enhancement (LGE) sequence showing focal area of microvascular obstruction (MVO) within the inferior wall (white arrow) corresponding to the site of recent ablation. (b) Three-chamber long axis LGE showing small focus of MVO in the septal left ventricular wall (black arrow) following ablation performed via the right ventricle. The tiny focal region of myocardial involvement is typical for MVO associated with myocardial thermal ablation.
Focal myocardial haemorrhage is revealed by a central dark zone on either T2 or T2* weighted MRI sequences owing to the paramagnetic properties of haemoglobin breakdown products in the subacute phase following haemorrhage.3 While MVO without haemorrhage can potentially be seen as low-signal areas within the myocardium on T2 weighted sequences, MVO without haemorrhage does not typically demonstrate low signal on T2* weighted sequences.3,8
CONDITIONS MIMICKING THE APPEARANCE OF MICROVASCULAR OBSTRUCTION
While MVO demonstrates pathognomonic appearances on CMR, there are a number of disease processes that are important to differentiate from MVO.
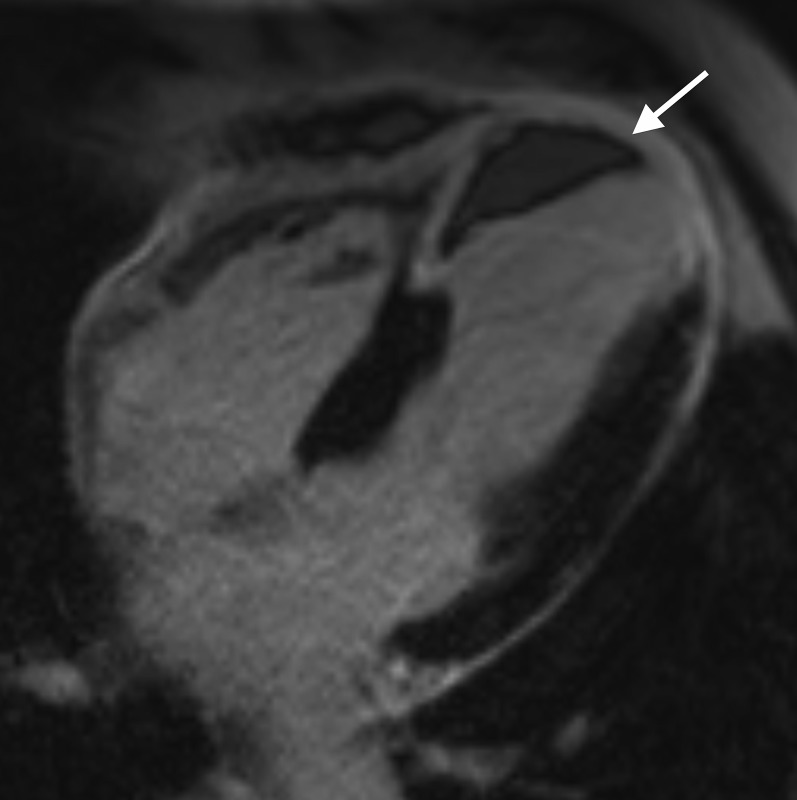
Left ventricular thrombus may mimic MVO and therefore careful evaluation of the site of disease using multiple imaging planes is essential. The low signal seen in patients with MVO is confined within the myocardium, while low signal seen on LGE imaging within the cavity abutting the wall of the myocardium would be consistent with the presence of thrombus (Figure 7).2
Figure 7.
Four-chamber late gadolinium enhancement image showing a full thickness infarct involving the distal septal left ventricular wall and apex. An intracavitary left ventricular thrombus (white arrow) is seen abutting the distal septal left ventricle wall. Note how the low signal thrombus lies against the myocardial wall unlike microvascular obstruction, where the low signal is seen within the myocardium.
Like MVO, calcified infarcts may appear as focal areas of low signal within a region of myocardium showing avid enhancement on LGE sequences. The timing of the study, history of previous myocardial infarct and evidence of left ventricular remodelling should enable clear distinction between MVO and an established calcified infarct. Myocardial thinning is a useful imaging discriminator between these two processes as myocardial thickness should remain preserved in patients presenting acutely following a myocardial infarct with MVO (Figure 8).2
Figure 8.
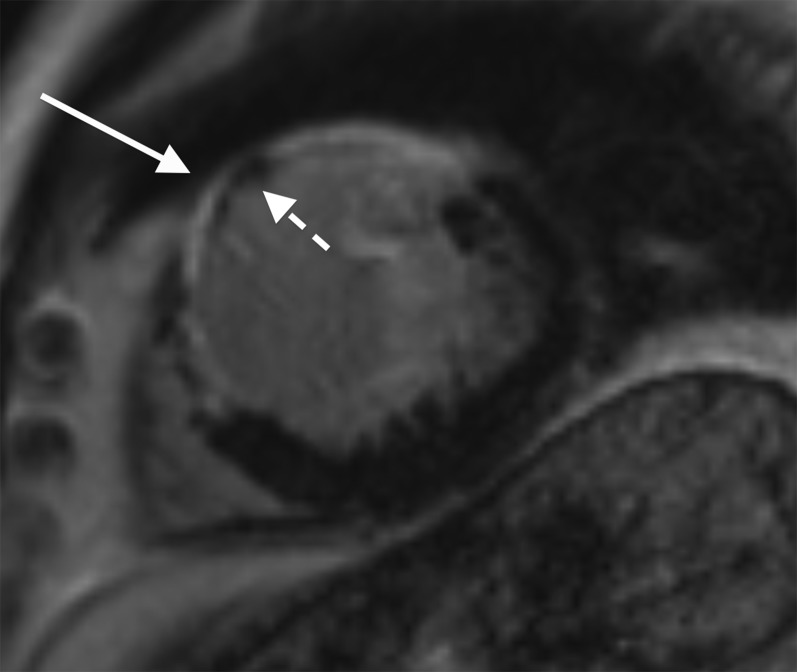
Short axis late gadolinium enhancement sequence acquired at the mid left ventricular level showing a full thickness infarct involving the anterior and anteroseptal left ventricular wall (white arrow). Areas of low signal within the myocardium at the site of infarct (interrupted arrow) corresponded with foci of calcification seen on a previous CT in keeping with a calcified myocardial infarct. Note that unlike patients with microvascular obstruction, the myocardium is significantly thinned in patients with a long-standing calcified infarct.
CLINICAL IMPACT AND PROGNOSTIC SIGNIFICANCE OF MICROVASCULAR OBSTRUCTION
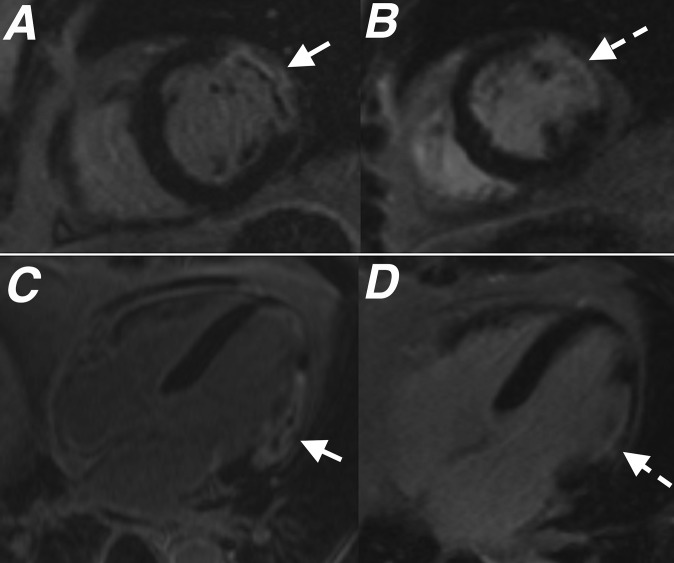
The extent of MVO seen on CMR demonstrates close correlation with the anatomical extent of MVO in both animal and human studies. MVO increases in size over the first 24–48 h following reperfusion and starts to reduce in size 2–7 days post event.6 While in severe cases MVO may persist beyond 1 month post event, the majority of patients will demonstrate complete resolution of MVO when imaged 4–6 weeks after the acute episode (Figure 9).3,6
Figure 9.
Images from (a) short axis late gadolinium enhancement (LGE) and (c) four-chamber LGE performed 2 days following acute infarct show a full thickness infarct within the anterolateral left ventricular wall with a central area of microvascular obstruction (MVO) (white arrows). Images from (b) short axis LGE and (d) four-chamber LGE taken from the follow-up cardiac MR performed 2 months later show infarct with thinning of the anterolateral wall and resolution of MVO (interrupted white arrows).
The presence of MVO on LGE sequences has a significant adverse prognostic impact and has been shown to correlate closely with adverse left ventricular remodelling.5,7 Patients with MVO demonstrate greater left ventricular end-diastolic and end-systolic volumes at follow-up.1,5,7 Patients with MVO on LGE typically demonstrate persistent global left ventricular dysfunction, with less improvement in left ventricular ejection fraction when compared with patients without MVO.1,4 In addition, patients with MVO on LGE are significantly more likely to experience future major adverse cardiovascular events, hospital admission and pre-mature cardiovascular-related death than patients do without MVO.4,6,10
Studies have shown that the incidence of MVO remains largely unchanged despite significantly improved provision and uptake of early invasive reperfusion therapies across the world.4 Its presence still confers an adverse outcome for patients despite recent trends towards a higher uptake of pharmacological antiremodelling therapies in post-infarct patients.4 Importantly, the relationship between MVO seen on LGE and both adverse outcome and poor left ventricular remodelling remains independent of infarct size and left ventricular function.1,3,4 This confirms that the prognostic impact of MVO is not simply a surrogate marker of overall infarct extent.4 Patients with a combination of myocardial haemorrhage and MVO have a worse outcome than with MVO alone.3
CONCLUSION
MVO is a common occurrence following reperfusion of acute myocardial infarction and is a marker of adverse prognosis. CMR is a reliable method for assessing this and its imaging features following gadolinium administration are characteristic.
REFERENCES
- 1.Nijveldt R, Hofman MB, Hirsch A, Beek AM, Umans VA, Algra PR, et al. Assessment of microvascular obstruction and prediction of short-term remodelling after acute myocardial infarction: cardiac MR imaging study. Radiology 2009; 250: 363–70. doi: 10.1148/radiol.2502080739 [DOI] [PubMed] [Google Scholar]
- 2.Rajiah P, Desai MY, Kwon D, Flamm SD. MR imaging of myocardial infarction. Radiographics 2013; 33: 1383–412. doi: 10.1148/rg.335125722 [DOI] [PubMed] [Google Scholar]
- 3.Wu KC. CMR of microvascular obstruction and hemorrhage in myocardial infarction. J Cardiovasc Magn Reson 2012; 14: 68. doi: 10.1186/1532-429X-14-68 [DOI] [PMC free article] [PubMed] [Google Scholar]
- 4.Weir RA, Murphy CA, Petrie CJ, Martin TN, Balmain S, Clements S, et al. Microvascular obstruction remains a portent of adverse remodeling in optimally treated patients with left ventricular systolic dysfunction after acute myocardial infarction. Circ Cardiovasc Imaging 2010; 3: 360–7. doi: 10.1161/CIRCIMAGING.109.897439 [DOI] [PubMed] [Google Scholar]
- 5.Kidambi A, Mather AN, Motwani M, Swoboda P, Uddin A, Greenwood JP, et al. The effect of microvascular obstruction and intramyocardial hemorrhage on contractile recovery in reperfused myocardial infarction: insights from cardiovascular magnetic resonance. J Cardiovasc Magn Reson 2013; 15: 58. doi: 10.1186/1532-429X-15-58 [DOI] [PMC free article] [PubMed] [Google Scholar]
- 6.Mather AN, Fairbairn TA, Artis NJ, Greenwood JP, Plein S. Timing of cardiovascular MR imaging after acute myocardial infarction: effect of estimates of infarct characteristics and prediction of late ventricular remodeling. Radiology 2011; 261: 116–26. doi: 10.1148/radiol.11110228 [DOI] [PMC free article] [PubMed] [Google Scholar]
- 7.Schwartz BG, Kloer RA. Coronary no reflow. J Mol Cell Cardiol 2011; 52: 873–82. doi: 10.1016/j.yjmcc.2011.06.009 [DOI] [PubMed] [Google Scholar]
- 8.Kumar A, Green JD, Sykes JM, Ephrat P, Carson JJ, Mitchell AJ, et al. Detection and quantification of myocardial reperfusion hemorrhage using T2*-weighted CMR. JACC Cardiovasc Imaging 2011; 4: 1274–83. doi: 10.1016/j.jcmg.2011.08.016 [DOI] [PubMed] [Google Scholar]
- 9.Mather AN, Lockie T, Nagel E, Marber M, Perera D, Redwood S, et al. Appearance of microvascular obstruction on high resolution first-pass perfusion, early and late gadolinium enhancement CMR in patients with acute myocardial infarction. J Cardiovasc Magn Reson 2009; 11: 33. doi: 10.1186/1532-429X-11-33 [DOI] [PMC free article] [PubMed] [Google Scholar]
- 10.Bodi V, Sanchis J, Nunez J, Mainar L, Lopez-Lereu MP, Monmeneu JV, et al. Prognostic value of a comprehensive cardiac magnetic resonance assessment soon after first ST-segment elevation myocardial infarction. JACC Cardiovasc Imaging 2009; 2: 835–42. doi: 10.1016/j.jcmg.2009.03.011 [DOI] [PubMed] [Google Scholar]


