Abstract
Objective:
To assess the image quality and dosimetric effects of the Philips orthopaedic metal artefact reduction (OMAR) (Philips Healthcare System, Cleveland, OH) function for reducing metal artefacts on CT images of head and neck (H&N) patients.
Methods:
11 patients and a custom-built phantom with metal bead inserts (alumina, titanium, zirconia and chrome) were scanned. The image was reconstructed in two ways: with and without OMAR (OMAR and non-OMAR image). The mean and standard deviation values of CT Hounsfield unit (HU) for selected regions of interest of each case were investigated for both images. Volumetric modulated arc therapy plans were generated for all cases. Gamma analysis of each dose distribution pair in the patient (1%/1 mm criteria) and phantom (2%/2 mm and 3%/3 mm criteria) images was performed. The film measurements in phantom for two metal beads were conducted for evaluating the calculated dose on both OMAR and non-OMAR images.
Results:
In the OMAR images, noise values were generally reduced, and the mean HU became closer to the reference value (measured from patients without metal implants) in both patient and phantom cases. Although dosimetric difference was insignificant for the eight closed-mouth patients (γ = 99.4 ± 0.5%), there was a large discrepancy in dosimetric calculation between OMAR and non-OMAR images for the three opened-mouth patients (γ = 91.1%, 94.8% and 96.6%). Moreover, the calculated dose on the OMAR image is closer to the real delivered dose on a radiochromic film than was the dose from the non-OMAR image.
Conclusion:
The OMAR algorithm increases the accuracy of CT HU and reduces the noise such that the entire radiation treatment planning process can be improved, especially for contouring and segmentation.
Advances in knowledge:
OMAR reconstruction is appropriate for the radiotherapy planning process of H&N patients, particularly of patients who use a bite block.
Over the duration of several surgeries and treatments, metallic objects such as orthopaedic implants, surgical staples and clips, radioisotope seeds or dental implants may be inserted into the patient's body. Owing to the high Z of these materials, metal streak artefacts in the CT image can be induced through the combination of beam hardening, scatter, photon starvation, partial volume effects and aliasing.1–5 These artefacts cause systematic discrepancies between the true attenuation coefficients of the objects and the CT Hounsfield units (HUs) in the reconstructed image.1 The discrepancies not only degrade diagnostic image quality but also compromise parts of the radiation treatment planning process such as structure delineation, treatment geometry definition and the extraction of the electron density distribution used for dose calculation.6–8
Since the research with regards to the metal artefact reduction (MAR) algorithm was first introduced in 1981,9 several studies have proposed improved methods for MAR, such as the interpolation method,10 iterative method11,12 and filtering method.5,13–22 Recently, the orthopaedic metal artefact reduction function (OMAR; Philips Healthcare System, Cleveland, OH), a commercial MAR module, has become clinically available. The principal method of the Philips OMAR function is an iterative projection modification. The OMAR algorithm divides the original image into a metal-only image and a tissue-classified image, then projection and filtering procedures are performed iteratively so that a corrected image is acquired.23 Although OMAR has begun to find implementation in radiation oncology clinics, few published studies have evaluated its performance for treatment planning. Li et al24 reported that the use of OMAR can improve the image quality of CT imaging of patients with orthopaedic implants and also that the confidence of radiation oncologists in delineating the target volume could be boosted. Hilgers et al25 reported that the CT numbers acquired by the OMAR reconstruction were more accurate than that of the non-OMAR reconstruction. However, for both studies, the dosimetric differences from CT number correction were not of clinical relevance. Huang et al26 studied several commercial MAR modules including the OMAR function by evaluating several phantoms containing metal implants (hip prostheses, dental fillings and spinal fixation rods). However, this study was limited to the evaluation of the image quality.
In the head and neck (H&N) region, metal streak artefacts due to dental implants are common in CT images. Often, during treatment of H&N cancer, a bite block is used to immobilize the oral cavity and make the tongue lie flat.27,28 This bite block forces the mouth of the patient open, and the CT HU into the oral cavity should be near that of air. For dental implant patients, however, the metal streak artefacts fill the oral cavity with inappropriate HU values and make the mouth of the patient appear sealed in the CT image. For radiation therapy of H&N cancer, it is important to get accurate CT images for target delineation and dose calculation because of the concave-shaped target volumes, the complex anatomy and the relative abundance of sensitive normal tissues close to the target.29,30 This study evaluated the effectiveness of the OMAR function in correcting for the metal artefacts induced by dental implants in closed- and opened-mouth H&N patients. Moreover, the dosimetric effect was investigated by type of dental implant using a in-house custom-built phantom.
METHODS AND MATERIALS
Clinical case evaluation
After approval from the institutional review board (No. 1302-010-460), we retrospectively selected 11 cases of H&N cancer patients with dental implants, 3 of whom used a bite block (8 closed-mouth patients). Table 1 shows the treatment site and bite-block availability of each patient. The patients were scanned on a large bore CT (Philips Healthcare System) with the settings of 120 kVp, 400 mAs per slice, 16 × 1.5 mm2 collimation setting, 0.813 pitch, 1-s rotation time, 600 mm field of view, 1 mm slice thickness, standard resolution and standard filter B. The scanned images were reconstructed with OMAR (OMAR image) and without OMAR (non-OMAR image).
Table 1.
Patient list. In this study, CT images and volumetric modulated arc therapy treatment plans of 11 head and neck patients were analysed. Among 11 patients, 8 patients were treated without a bite block (closed group) and 3 were treated with a bite block (opened group)
| Patient number | Treatment site | Bite block |
|---|---|---|
| 1 | Nasopharynx | X |
| 2 | Nasopharynx | X |
| 3 | Nasopharynx | X |
| 4 | Parotid gland | X |
| 5 | Submandibular gland | X |
| 6 | Oral cavity | X |
| 7 | Tongue | X |
| 8 | Tongue | X |
| 9 | Mandible | O |
| 10 | Tongue (base) | O |
| 11 | Tonsil | O |
Orthopaedic metal artefact reduction phantom
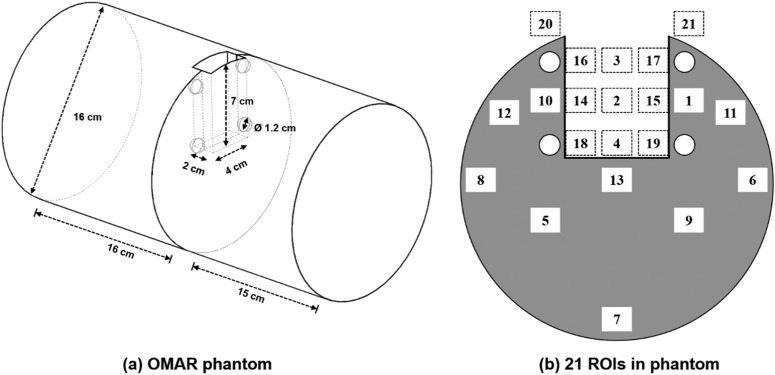
The influence of the dental filling artefacts on dose distribution and image quality was investigated with a in-house custom-built phantom, which we called the OMAR phantom, as shown in Figure 1a. The OMAR phantom was composed of a polymethyl methacrylate (PMMA) cylinder (physical density, 1.18 g cm–3) with dimensions of 160 mm in diameter and 210 mm in height. The phantom is divided into two sections to allow film measurements. The phantom was designed to contain an oral cavity space and holes for dental implants. The oral cavity space is a cuboid with dimensions of 40 mm in width, 70 mm in depth and 20 mm in height. There are four implantable holes that are aligned symmetrically near the air cavity, each with a diameter of 12 mm. These four holes are inside the phantom, and metal beads representing dental implants can be inserted into these holes. The diameter of the beads is 10 mm, which is based on the standard molar size.31 The phantom was constructed by incorporating four metallic beads, which were alumina (Al2O3, 3.61 g cm–3),32 titanium (Ti, 4.54 g cm–3),33 zirconia (ZrO2, 6.05 g cm–3)34 and chromium (Cr, 7.9 g cm–3) (the substitution for stainless steel). Two beads of titanium and chromium were divided in half, so that the radiation dose inside the phantom can be measured without cutting the film. A dental modelling wax (Kim's International, Inc., Seoul, Republic of Korea) was used to immobilize the metal beads and to fill the cavities of empty holes. The OMAR phantom images were acquired with the H&N patient image protocols as described above.
Figure 1.
The diagram of the in-house custom-built phantom (a) and 21 regions of interest (ROIs) in the centre plane of cavity of phantom (b) for analysing the image property.
Image comparison
For the clinical study, one physician contoured the regions of interest such as planning target volume (PTV), outer (i.e. close to lip) and inner oral cavity, parotid on both sides and spinal cord in the OMAR images. All structures from the OMAR image were copied to the non-OMAR image. Region of interest (ROI) was defined as an area of 10 × 10 pixels in order to compare the CT HU and the image noise levels (HU standard deviation) for both OMAR and non-OMAR images. The centre of the oral cavity was located in the selected CT slice. The difference values of CT HU and HU standard deviation were calculated by using the equation:
The significance of the differences was calculated to determine whether the two reconstructed images were statistically different. The improvement of image quality of OMAR image was investigated with the paired t-test with 95% confidence level.
For the phantom study, 21 ROIs of 10 × 10 pixels were chosen to evaluate the change of CT HU. 10 ROIs were located in the region composed of PMMA and the remaining ROIs in the region of the air cavity. The ROIs were located in the CT slice of the centre of the cavity in the phantom as shown in Figure 1b. The mean and standard deviation values of CT HU for each of the ROIs were measured on both OMAR and non-OMAR images. These values were then compared with the corresponding values of CT images of the OMAR phantom without the metal beads. The changes in the image quality and the degree of occurrence of artefacts according to the changing of the metal beads (i.e. density) were observed.
Dosimetric comparison
For the 11 patient cases with dental implants, volumetric modulated arc therapy (VMAT) plans with a 6-MV photon beam were generated using the Varian Eclipse™ v. 10.0 (Varian® Medical Systems, Palo Alto, CA) treatment planning system. For both reconstructed images, identical VMAT plans were used for dose calculation using the analytic anisotropic algorithm with a grid size of 0.1 cm. After dose calculation, the calculated dose planes of the CT slices perturbed by metal artefacts were selected and compared for both reconstructed patient images.
A single clinical VMAT plan was used for the dosimetric comparison between OMAR and non-OMAR images in the phantom. The selected clinical plan delivered a high-dose region in the air cavity. The calculated dose planes of the CT slice located in the centre of the cavity were selected in the phantom.
Gamma analysis was performed for each dose distribution pair in the patient images using 1%/1 mm criteria with 10% threshold dose. For phantom evaluation, 2%/2 mm and 3%/3 mm criteria were added in the gamma analysis.
Film measurements in the phantom
Dosimetric comparison in the phantom was evaluated with film measurements. Gafchromic® EBT2 (International Specialty Products, Wayne, NJ) was used to measure the influence of the dental artefacts on dose distribution in the phantom. Two metal beads of titanium and chromium were used during film measurements. The bead, divided in half, was inserted into the OMAR phantom's implant hole. A film was inserted into the section gap of the phantom, which corresponded to the centre of the oral cavity and implant hole. The selected clinical plan was administrated by a Trilogy linear accelerator, in VMAT mode, equipped with a millennium 120 MLC (Varian® Medical Systems). The measured films were scanned on an Epson 10000XL flatbed scanner (Epson America Inc., Long Beach, CA) with landscape orientation and transparency unit. The entire scanning area was scanned with 300 dpi resolution and saved as a 48-bit RGB colour TIFF image file. Radiation Imaging Technology, Inc. software dosimetry system was used to acquire the calibration curve and perform dosimetric analysis. Uniformity correction was performed on the centre of the scanning region in the landscape direction with a size of 8 × 10 inches. Parallel calibration mode was used for acquiring the calibration curve of films ranging from 0 to 500 cGy. IMRT measurement mode was used to compare film to film, or film to planned two dimensional dose distribution, where gamma analysis was performed with 3%/3 mm criteria and threshold of 10% of maximum dose.
RESULTS
Image analysis of patient cases
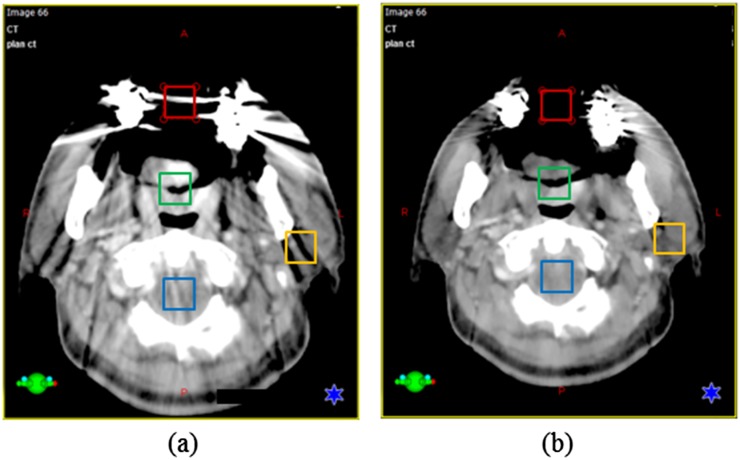
Figure 2 shows an example of image analysis for tongue base cancer using a bite block. The mouth of the patient was open, and the PTV was affected by metal artefacts. The differences of average HU and noise in each of the ROIs between the OMAR image and the non-OMAR image were compared. The HU of the outer oral cavity changed from −215.5 ± 386.0 (non-OMAR image) to −457.9 ± 229.5 (OMAR image). The metallic implant artefact produces an observable build-up region at the entrance of the cavity in the non-OMAR image. Although this virtual build-up region disappeared in the OMAR reconstruction image, the HU in the OMAR image is still affected by an artefact that, although invisible to the naked eye, was not close to the reference value of −1000 HU. For the other soft tissue, the mean HU value stayed the same for both reconstructed images, but the noise levels were reduced for the selected ROIs.
Figure 2.
An example of tongue base cancer using a bite block, the average CT number [Hounsfield unit (HU)] and standard deviation (SD) were checked in regions of interest (ROIs). Same coloured ROI on both images means the same area (red—outer cavity, green—planning target volume, yellow—left parotid and blue—spinal cord). (a) A non-orthopaedic metal artefact reduction (OMAR) image. For the red-coloured ROI, HU = −215.5, SD = 386.0. For the blue-coloured ROI, HU = 69.4, SD = 125.4. For the yellow-coloured ROI, HU = −12.1, SD = 50.4. For the green-coloured ROI, HU = 54.4, SD = 21.9. (b) An OMAR image. For the red-coloured ROI, HU = −457.9, SD = 229.5. For the blue-coloured ROI, HU = −23.9, SD = 114.1. For the yellow-coloured ROI, HU = −11.0, SD = 40.9. For the green-coloured ROI, HU = 53.5, SD = 17.5.
For all patients, the averaged HU values and the averaged noise values were investigated in the ROIs of OARs in both reconstructed images excluding the PTV as the target location was not constant for all patients, making statistical analysis infeasible.
Table 2 summarizes the results of the patient image analysis with the averaged HU differences and the averaged noise value differences between the non-OMAR and OMAR images.
Table 2.
The averaged Hounsfield unit (HU) difference and the averaged noise value difference between non-orthopaedic metal artefact reduction (OMAR) image and OMAR image for ROIs. The studied patients were grouped into a closed group and an opened group, according to the mouth status
| Organs at risk | Closed group |
Opened group |
Total patients |
|||
|---|---|---|---|---|---|---|
| Averaged HU difference (p-value) | Averaged SD difference (p-value) | Averaged HU difference (p-value) | Averaged SD difference (p-value) | Averaged HU difference (p-value) | Averaged SD difference (p-value) | |
| Spinal cord | −5.8 (0.525) | 6.9 (0.015) | 6.6 (0.316) | 17.9 (0.152) | −1.7 (0.717) | 10.5 (0.006) |
| Outer cavity | 170.7 (0.092) | 109.3 (0.063) | 203.1 (0.108) | 305.3 (0.102) | 181.5 (0.02) | 174.6 (0.01) |
| Inner cavity | 85.8 (0.008) | 6.1 (0.743) | 204.9 (0.08) | 68.1 (0.098) | 125.5 (0.002) | 26.7 (0.19) |
| Left parotid | 5.0 (0.461) | 16.0 (0.044) | 47.4 (0.423) | 69.1 (0.251) | 19.1 (0.244) | 33.7 (0.046) |
| Right parotid | −19.3 (0.146) | 11.9 (0.021) | 15.4 (0.683) | 10.5 (0.196) | −7.8 (0.444) | 11.4 (0.004) |
SD, standard deviation.
Significant p-values (<0.05) are italicized for emphasis.
The differences were calculated using the following equation: HU in non-OMAR image−HU in OMAR image.
Positive HU values in Table 2 indicate that the HU value in the non-OMAR image was greater than the HU in the OMAR image for the averaged HU and noise analysis. In the spinal cord region, the averaged HU values of the closed-mouth group and opened-mouth group were negative and positive, respectively. For the closed group, the averaged HU values for non-OMAR and OMAR images were 44.2 and 50, respectively. For the opened group, the averaged HU values for non-OMAR and OMAR images were 47.5 and 40.9, respectively. The averaged HU difference for both groups was not significant; however, the difference in noise levels was significant. The parotid on both sides showed tendencies similar to the results of the spinal cord, as the parotid and the spinal cord have similar soft tissue compositions. In the right parotid, for the closed group, the averaged HU values for non-OMAR and OMAR images were −15.8 and −20.8, respectively. For the opened group, the averaged HU values for non-OMAR and OMAR images were 54.3 and 6.9, respectively. In the left parotid, for the closed group, the averaged HU values for non-OMAR and OMAR images were −19.4 and 0, respectively. For the opened group, the averaged HU values for non-OMAR and OMAR images were 5.3 and −10.1, respectively.
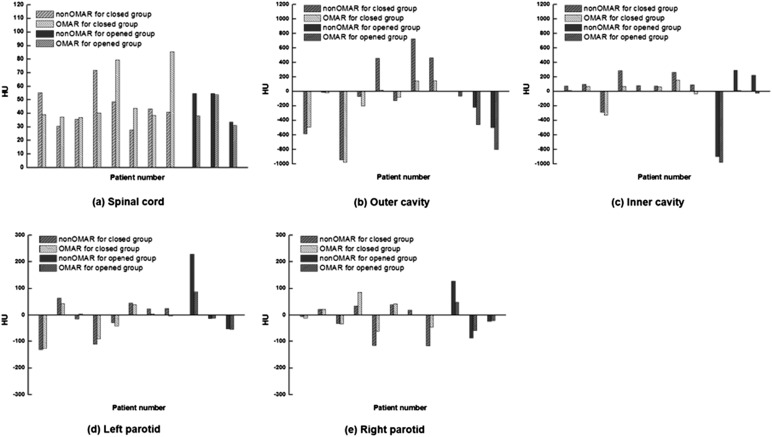
In both of the oral cavity ROIs, the HU difference was of a positive value. The averaged difference value was much higher than that of soft tissue structures. For the closed group, the averaged difference was 170.7 and 85.8 HU for the outer cavity and inner cavity, respectively. For the opened group, the averaged difference was 203.1 and 204.9 HU for the outer cavity and inner cavity, respectively. These large differences in values in the opened group were due to artefacts. The outer cavity of the opened group had a particularly large difference, with average HU values of −238.7 and −441.8 for non-OMAR and OMAR images, respectively. This ROI was an air cavity region. In this case, the OMAR algorithm reduced the artefact and improved the image quality. The HU values for all patients are shown in Figure 3.
Figure 3.
Hounsfield unit (HU) values for the opened and closed groups between non-orthopaedic metal artefact reduction (OMAR) image and OMAR image; (a) spinal cord, (b) outer cavity, (c) inner cavity, (d) left parotid and (e) right parotid.
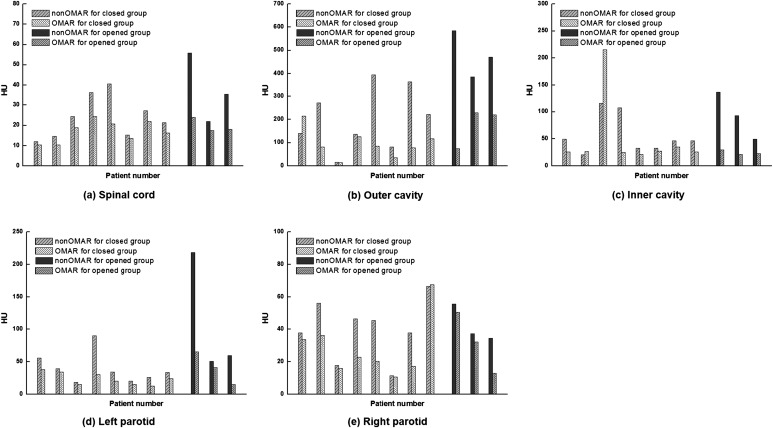
The averaged SD difference for all analyses was a positive value, as summarized in Table 2. For the closed group, the averaged SD difference ranged from 6.1 to 109.3 HU. For the opened group, the averaged SD difference ranged from 10.5 to 305.3 HU. The outer cavity ROI showed the maximum SD difference for both groups. Figure 4 shows the reduction of SD in the OMAR image. In particular, for the outer cavity of the closed group, the average SD value was 203.5 and 94.2 HU for non-OMAR and OMAR images, respectively. For the opened group, the average SD value was 480.3 and 175.0 HU for non-OMAR and OMAR images, respectively. While residual artefacts remained in the OMAR images, the artefacts in the cavity regions were dramatically reduced on the opened group.
Figure 4.
Standard deviation values for the opened and closed groups between non-orthopaedic metal artefact reduction (OMAR) image and OMAR image; (a) spinal cord, (b) outer cavity, (c) inner cavity, (d) left parotid and (e) right parotid.
Dosimetric comparison of patient cases
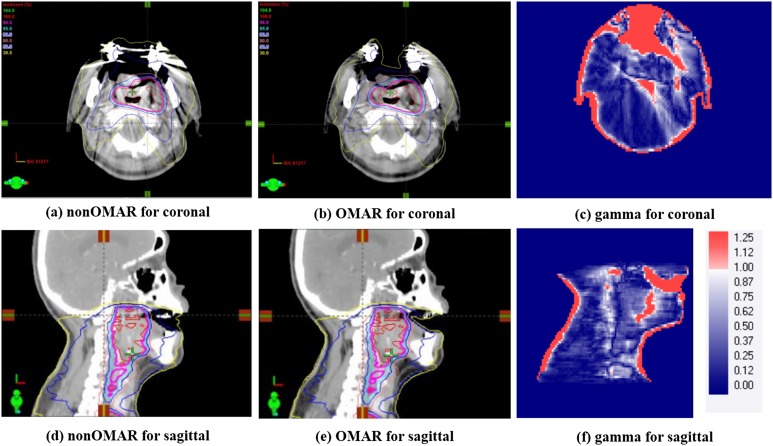
For all patients, the dose distributions were calculated and compared between the non-OMAR and OMAR images. The eight closed patients included cases with treatments such as nasopharynx, parotid glands and the submandibular salivary gland, the targets of which are generally not close to the air cavity and therefore less irradiated in the cavity region. The gamma pass rates (prescription dose) of those cases were 99.2% (67.5 Gy), 99.7% (67.5 Gy), 99.7% (67.5 Gy), 98.5% (75 Gy), 98.9% (72 Gy), 99.9% (63 Gy), 100.0% (72 Gy) and 99.1% (63 Gy) with criteria of 1%/1 mm and 10% threshold. The mean gamma passing rate was 99.4 ± 0.5% for the calculated dose distributions between the non-OMAR and OMAR images. The difference in HU of images was sensitive to the difference of dose distributions between non-OMAR and OMAR reconstructions. However, the opened group of three patients included cases where targets such as the tongue and the tonsil were close to the air cavity and consequently irradiated in that cavity region. The gamma pass rates (prescription dose) were 91.1% (63 Gy), 94.8% (67.5 Gy) and 96.6% (63 Gy) with criteria of 1%/1 mm and 10% threshold. Figure 5 shows the results of gamma analysis for one case from the opened group. These patients showed large discrepancies in the air cavity region in the coronal and sagittal plane including the oral cavity. In the non-OMAR image, a virtual build-up structure was created in front of the cavity region due to artefacts. This artefact made the 30% and 50% isodose lines fill the air cavity in the non-OMAR image.
Figure 5.
Comparison of volumetric modulated arc therapy treatment plans for gamma analysis with 1%/1 mm criteria. For comparison, left side is non-orthopaedic metal artefact reduction (OMAR) image at (a) the coronal and (d) the sagittal planes. Right side is OMAR image at (b) the coronal and (e) the sagittal planes. The results of gamma testing are for (c) coronal and (f) sagittal planes.
Image analysis of phantom case
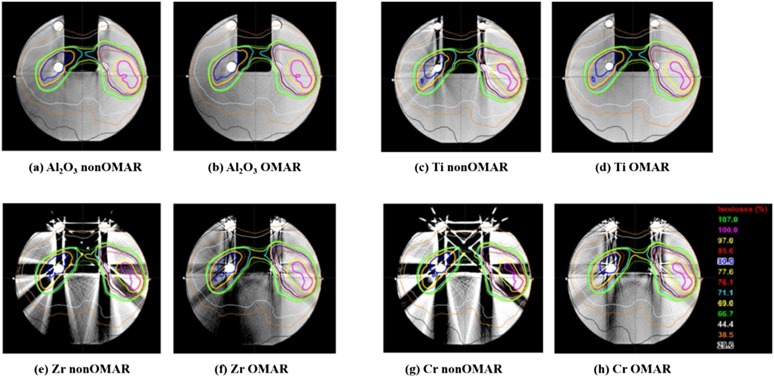
Figure 6 shows both the OMAR image and the non-OMAR image of the phantom with each bead. Improvement of image quality in the OMAR reconstructed image is clear to the naked eye. The distortion in both the PMMA region and in the air cavity region was evaluated by statistical analysis of HU of ROIs in each region. As shown in Figure 1b, the PMMA and air cavity region consisted of ROIs to evaluate the local effects of metal artefacts. In the PMMA region, the 10 ROIs were grouped into three regions. One was region (A), near the implanted metal ball. Next was region (B), away from the metal ball but close to the surface. Finally, region (C), which was not affected by the metal ball.
Figure 6.
Four pairs of CT images and dose distribution of the orthopaedic metal artefact reduction (OMAR) phantom with four types of metal beads. For each pair, left side is for non-OMAR image of the phantom with (a) alumina, (c) titanium, (e) zirconia and (g) chrome, and right side is for OMAR image of the phantom with (b) alumina, (d) titanium, (f) zirconia and (h) chrome.
In the cavity region, the 11 ROIs were grouped into 3 regions. One was region (D), near the implanted metal ball and the surface. Next was region (E) in the centre of the cavity. Finally, region (F), outside of the phantom at the edge of the cavity. Tables 3 and 4 show the averaged mean and standard deviation values of HU of each grouped region, respectively. Statistically significant differences were shown between the images with no metal ball and the non-OMAR images with metal ball (e.g. p-value of Al non-OMAR to no metal ball) for both PMMA region and air cavity region. There was also a statistically significant difference between the non-OMAR and the OMAR images with the metal ball, as shown in the metal with OMAR (e.g. p-value represented at alumina OMAR) for both the PMMA region and the air cavity region. The averaged mean and standard deviation values of HU in the air cavity region showed a significant difference (p < 0.0001) in the higher density materials of zirconia and chrome. This indicates that the higher density material increases the number of artefacts and that OMAR can reduce the artefacts effectively. In the case of the alumina and titanium cases, there were some regions (region A in Tables 3 and 4) that after the OMAR correction, the noise increased and the mean value became estranged from the reference value. However, generally the noise decreased and the mean value of HU became close to the reference value.
Table 3.
The averaged mean value of Hounsfield unit in phantom (A = 1, 10, 13), (B = 6, 8, 11, 12) and (C = 5, 7, 9) and in cavity (D = 4, 14, 15, 16, 17, 18, 19), (E = 2, 3) and (F = 20, 21)
| Region | No metal | Al non-OMAR | Al OMAR | Ti non-OMAR | Ti OMAR | Zr non-OMAR | Zr OMAR | Cr non-OMAR | Cr OMAR | |
|---|---|---|---|---|---|---|---|---|---|---|
| In phantom | A | 142.2 | 82.0 | 123.4 | 154.9 | 84.1 | −23.0 | 4.8 | −52.9 | 29.5 |
| B | 141.3 | 131.2 | 133.7 | 150.8 | 138.4 | 162.6 | 96.9 | 218.9 | 163.9 | |
| C | 147.3 | 137.7 | 132.3 | 160.5 | 151.1 | −141.4 | 48.5 | −142.7 | 85.2 | |
|
p-value |
0.013 | 0.112 | 0.019 | 0.021 | 0.085 | 0.454 | 0.188 | 0.281 | ||
| In cavity | D | −987.5 | −969.1 | −979.8 | −946.8 | −970.8 | −598.8 | −875.3 | −454.2 | −823.6 |
| E | −998.9 | −995.1 | −997.4 | −959.4 | −984.8 | −800.6 | −986.1 | −703.6 | −965.6 | |
| F | −997.0 | −949.5 | −994.2 | −989.4 | −998.7 | −705.9 | −863.4 | −534.0 | −882.9 | |
| p-value | 0.027 | 0.125 | 0.008 | 0.130 | <0.0001 | <0.0001 | <0.0001 | <0.0001 | ||
Al, with alumina beads; Cr, with chrome beads; non-OMAR, reconstructed image without using orthopaedic metal artefact reduction (OMAR) function; OMAR, reconstructed image using OMAR function; Ti, with titanium beads; Zr, with zirconia beads.
Significant p-values (<0.05) are italicized for emphasis.
The region of interest numbers refer to Figure 1b.
Table 4.
The averaged standard deviation (noise) value of Hounsfield unit in phantom (A = 1, 10, 13), (B = 6, 8, 11, 12) and (C = 5, 7, 9) and in cavity (D = 4, 14, 15, 16, 17, 18, 19), (E = 2, 3) and (F = 20, 21)
| Region | No metal | Al non-OMAR | Al OMAR | Ti non-OMAR | Ti OMAR | Zr non-OMAR | Zr OMAR | Cr non-OMAR | Cr OMAR | |
|---|---|---|---|---|---|---|---|---|---|---|
| In phantom | A | 11.4 | 21.9 | 27.6 | 6.2 | 8.5 | 585.4 | 59.4 | 717.6 | 95.8 |
| B | 10.8 | 15.7 | 12.7 | 4.2 | 3.7 | 62.5 | 33.7 | 125.0 | 33.2 | |
| C | 12.4 | 16.0 | 16.7 | 5.3 | 4.9 | 48.6 | 38.6 | 56.4 | 38.8 | |
|
p-value |
0.002 | 0.784 | 0.001 | 0.690 | 0.087 | 0.126 | 0.058 | 0.078 | ||
| In cavity | D | 20.5 | 57.0 | 20.2 | 5.8 | 10.5 | 418.5 | 134.7 | 621.1 | 189.1 |
| E | 2.3 | 12.4 | 5.1 | 8.3 | 3.7 | 347.4 | 35.5 | 527.0 | 88.6 | |
| F | 9.8 | 12.4 | 5.1 | 18.4 | 3.7 | 347.4 | 90.2 | 469.2 | 88.6 | |
| p-value | 0.105 | 0.154 | 0.377 | 0.821 | <0.0001 | <0.0001 | <0.0001 | <0.0001 | ||
Al, with alumina beads; Cr, with chrome beads; non-OMAR, reconstructed image without using orthopaedic metal artefact reduction (OMAR) function; OMAR, reconstructed image using OMAR function; Ti, with titanium beads; Zr, with zirconia beads.
Significant p-values (<0.05) are italicized for emphasis.
The region of interest numbers refer to Figure 1b.
Dosimetric comparisons and film measurements of phantom case
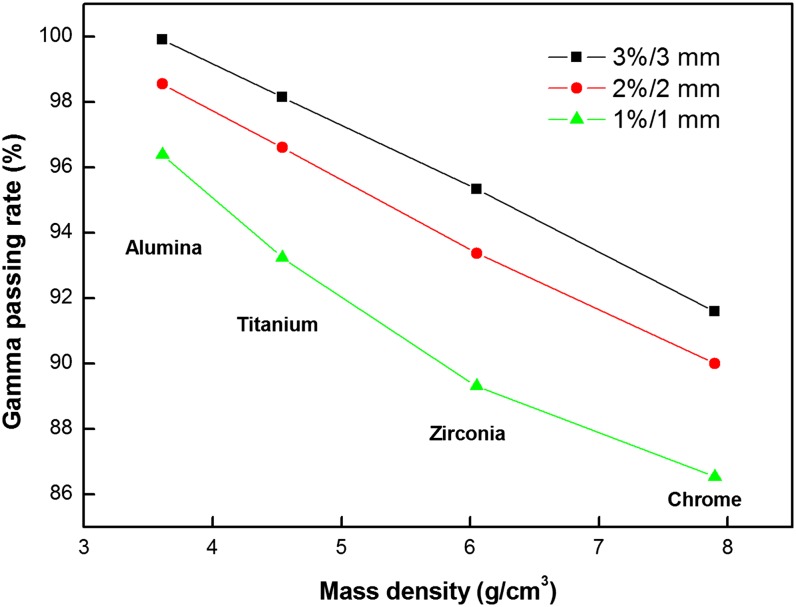
For each metal bead case, the dose distribution of the non-OMAR image and that of the OMAR image was compared by applying the one selected clinical VMAT plan as shown in Figure 6. The dose discrepancy was significant in artefact regions and increased with the higher density metal balls. Figure 7 shows the tendency of the change of gamma pass rate by mass density of the metal bead. For the phantom with titanium beads, the discrepancy in calculated doses between the non-OMAR and OMAR images was 95.3% with 3%/3 mm criteria in terms of gamma passing rate. With the film measurement, the gamma passing rate was improved from 83.60% to 86.68% for the non-OMAR image and OMAR image with the criteria of 3%/3 mm.
Figure 7.
The tendency of the change of gamma pass rate by density of metal bead in different gamma criteria. Black line with squares is for 3%/3 mm, red line with circles is for 2%/2 mm and green line with triangles is for 1%/1 mm.
For the phantom with chrome beads, the discrepancy in calculated doses between the non-OMAR and OMAR images was 91.6% with 3%/3 mm criteria in terms of gamma passing rate. With the film measurement, the gamma passing rate was improved from 79.7% to 86.3% for the non-OMAR image and OMAR image with the criteria of 3%/3 mm.
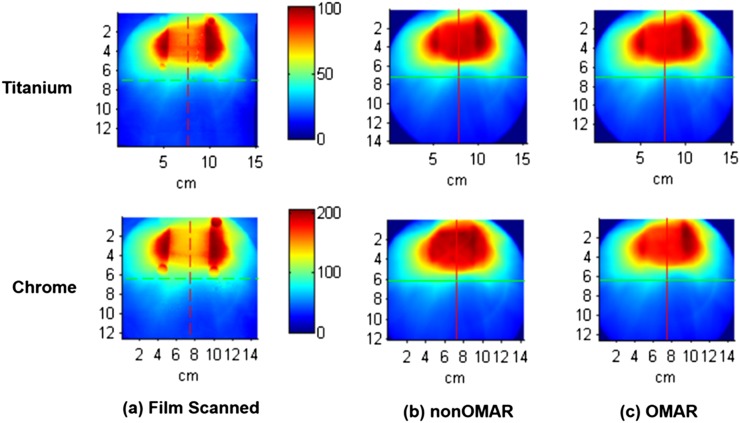
Figure 8 shows the dose distribution of measured and calculated doses. This film result shows the underdose tendency in the centre of the air cavity and the overdose tendency around the mucosa region especially for the high-density materials.
Figure 8.
The dose distribution of (a) scanned film and (b) calculated dose on non-OMAR image and (c) calculated dose on non-orthopaedic metal artefact reduction (OMAR) image using titanium and chrome beads. The dose distributions of the upper row are for the phantom with titanium beads and those of the lower row are for the phantom with chrome beads.
DISCUSSION
The improvement of CT image quality by the OMAR algorithm can be observed even by the naked eye, as shown in Figure 2. The direction and shape of the metal streak artefacts can be varied by varying the position of the metal implants so that each patient has different distorted regions. Streak artefacts can obscure certain organ structures, such as the parotid gland, which are indistinguishable even in CT images without metal artefacts. In this case, owing to the complex anatomy of the H&N region, delineating structures directly on the CT slice that has been distorted by artefacts is not recommended. Also inappropriate is attempting to interpolate the contours on the distorted slices after contouring structures on all the other slices. However, there was no significant difference in structural volumes contoured by the physician between OMAR and non-OMAR images. This is because most of the delineated structures of the H&N region are far from the air cavity and implants. And generally, the process of delineating structures strongly depends on the knowledge and experience of a physician.24 Because regions that are largely homogeneous should be selected for evaluation of the image, there were limited potential ROIs. The air cavity and soft tissue were selected by the physician, so it can be varied by the choice of the physician. Reference values for soft tissues range from −40 to 61 HU for materials whose density is in the range of 0.98 to 1.09 g cm–2 in the settings of the CT scanner used in this study. According to this study, after the OMAR correction, noise values were generally reduced and the mean HU became closer to the reference values. These results mean that OMAR can correct the metal artefact and change the image to more closely conform to the real image. Although we can verify from patient image analysis that OMAR correction can improve the image quality of CT images, it is necessary to check whether the application of the OMAR algorithm distorts the geometry of structures and whether the CT HU value becomes closer to the reference value. To this end, a phantom study was needed. Figure 6, as that of Figure 2, shows how the improvement of image quality of the phantom images can be observed with the naked eye.
According to the definition of HU, each tissue should have the same HU across different scanners, as long as the setup is held constant. Therefore, in this study, we can use the value of the phantom image without the bead as the reference value. PMMA is taken to represent human soft tissue, and the air cavity represents the human oral or nasal cavity. The CT image of the phantom without bead was the reference CT image to which all the other CT images of the phantom with metal beads were compared. Because the CT scanner used in this study is limited by a maximum HU value, it was impossible to compare the CT HU of metal beads, therefore only the in-phantom region and air cavity region were examined.
There were no changes found in the geometry of the CT image in the phantom images with metal beads from low physical density material (alumina) or high density material (chrome). This can be explained by the fact that OMAR algorithm is a projection interpolation-based algorithm.23 CT HU of each region generally tended closer to the reference value. Although the p-value of the alumina case and the titanium case was over 0.05, and therefore not significant at the 95% confidence level, the CT HU of alumina case and titanium case also became closer to the reference value in direct comparison. Tables 3 and 4 show that the higher the density of the metal bead, the more noise value is detected. This tendency is noticeable in air, and the difference of the mean value of air between the reference and other cases is larger than that of PMMA. Because of the definition of HU, the artefact can only distort the HU in one way, over −1000 HU.
To evaluate dose differences between the two images in a stricter fashion, we implemented the gamma test with 1%/1 mm criteria on the patient cases and 2%/2 mm (or 3%/3 mm) on the phantom cases. The gamma criteria of VMAT quality assurance is generally 3%/3 mm,35 but recent research has shown that 3%/3 mm gamma criteria is not enough to assure the quality of VMAT treatment,36 therefore more strict criteria are necessary.
Through the results of the dosimetric comparison of the calculated doses from OMAR and non-OMAR images, the opened-mouth group can be distinguished from the closed-mouth group. The significant difference between calculated doses on OMAR and non-OMAR images can be explained by two reasons. First, the region of air in the CT image of an opened-mouth patient is larger than that in the CT image of a closed-mouth patient. Larger differences in dose calculation are observed in the situation where the air cavity is exposed to more radiation than other tissues. This is because the air cavity is generally surrounded by dental implants, and the metal streak artefact has much influence on the air HU. The lower limit of CT HU is −1000, which represents air. Therefore, the artefact can distort in only one way, over −1000 HU and not under −1000 HU. This can cause larger differences in the HU value of air than that of the other materials. Second, in the case of the opened-mouth patients, metal streak artefacts caused by dental implants can block the region in front of the oral cavity and make the mouth appear closed. These artefacts in front of the oral cavity function as a dose build-up region during radiation dose calculation and induce a higher dose in the air cavity in the calculated result. Therefore, this phenomenon has more dosimetric influence on the CT image of an opened-mouth patient than that of a closed-mouth patient. These two phenomena corroborate the results of the gamma pass rates of the patient cases. Although the shape difference of the dose distribution can be observed with the naked eye, there were no significant changes (<0.05%) in the dose–volume histogram for any of the 11 patient cases. That is because the dose difference is relatively minor in the selected structure and only significant in and near the air cavity. This tendency can also be observed in the maximum dose difference of the target. This shows that metal artefacts have little effect on the radiation dose of the tumour.
The gamma pass rate between the dose distribution calculated on the original image and that calculated on the OMAR corrected image is inversely proportional to the density of the metal bead as shown in Figure 7. Although the zirconia and chrome bead cases have large areas of dose discrepancy, the gamma fail region is generally limited to areas near the air cavity. Therefore, dose difference in the soft tissue is not as large as that in the air cavity. To check the accuracy of the calculated dose, it is necessary to compare the calculated dose to the measured dose. By analysing the film result, calculated dose and measured dose can be compared. Out of the metal beads studied, only the titanium and chrome beads could be cut in half, and therefore film measurement was carried out for just two cases. Figure 8 shows that the dose difference in the case of high density, that is, the chrome case, is larger than that in the titanium case. Generally, after the OMAR correction, gamma pass rate increases and the calculated dose becomes more similar to the measured dose. This film result in this study shows the underdose tendency in the centre of the air cavity and the overdose tendency around the mucosa region. This is because Varian RTP Eclipse can only count on the range of HU from −1000 to 3000 on the dose calculation.37 Therefore, dose calculation cannot completely reflect the beam hardening effect in the beam path through the metallic materials. Dose distribution around the air cavity can be distorted according to the specific kind of dental implant material. The distorted range covers the mucosa region. The reported mucosa tolerance dose, which induces mucosa reaction, is generally 51 Gy. The difference between planned dose and delivered dose on the mucosa may cause issues with underdosing.38
CONCLUSION
The OMAR algorithm increases the accuracy of CT HU and also reduces noise in the reconstructed image. Thus, the algorithm can contribute positively as an addition to the radiation treatment planning process, especially for contouring and segmentation. For the dosimetric effects of the OMAR algorithm, although there was little significant difference in dose distributions for the CT images of patients with closed mouths, the OMAR algorithm was shown to have an impact on the dose calculation on the CT image of opened-mouth patients. Moreover, if the implanted material causing the metal artefacts has higher physical density, then the image quality will be deteriorated by the streak artefacts such that the result of the calculated dose distribution becomes inaccurate. However, after the OMAR correction, the calculated dose distribution became closer to the delivered, real dose distribution. Therefore, we recommend that OMAR reconstruction should be utilized in the radiation treatment process of H&N patients, especially when using a bite block.
Acknowledgments
ACKNOWLEDGMENTS
The authors thank Philips Healthcare Korea engineering team for technical assistance. The authors also thank Paul Klahr (Philips Healthcare) for his valuable feedback on the manuscript.
Contributor Information
H Kwon, Email: goodhjkwon@gmail.com.
K S Kim, Email: happyend67@gmail.com.
Y M Chun, Email: youngmi.chun@philips.com.
H-G Wu, Email: wuhg@snu.ac.kr.
J N K Carlson, Email: joelcarlsonesl@gmail.com.
J M Park, Email: leodavinci@naver.com.
J-I Kim, Email: madangin@gmail.com.
FUNDING
This research was supported by a grant of the Korea Health Technology R&D Project through the Korea Health Industry Development Institute, funded by the Ministry of Health and Welfare, Republic of Korea (Grant no.: HI14C3459).
REFERENCES
- 1.Barrett JF, Keat N. Artifacts in CT: recognition and avoidance. Radiographics 2004; 24: 1679–91. doi: 10.1148/rg.246045065 [DOI] [PubMed] [Google Scholar]
- 2.Ri-Feng Z, Jue W, Wei-Min C. X-ray beam hardening correction for measuring density in linear accelerator industrial computed tomography. Chin Phys C 2009; 33: 599. doi: 10.1088/1674-1137/33/7/018 [DOI] [Google Scholar]
- 3.Herman G, Knutson J, Redington R, Vosburgh K. Simple correction for beam hardening in computed tomography. Invest Radiol 1976; 11: 361. [Google Scholar]
- 4.Herman GT. Correction for beam hardening in computed tomography. Phys Med Biol 1979; 24: 81. doi: 10.1088/0031-9155/24/1/008 [DOI] [PubMed] [Google Scholar]
- 5.Fleischmann D, Boas FE. Computed tomography—old ideas and new technology. Eur Radiol 2011; 21: 510–17. doi: 10.1007/s00330-011-2056-z [DOI] [PubMed] [Google Scholar]
- 6.Chu JC, Ni B, Kriz R, Amod Saxena V. Applications of simulator computed tomography number for photon dose calculations during radiotherapy treatment planning. Radiother Oncol 2000; 55: 65–73. doi: 10.1016/S0167-8140(00)00159-6 [DOI] [PubMed] [Google Scholar]
- 7.Kilby W, Sage J, Rabett V. Tolerance levels for quality assurance of electron density values generated from CT in radiotherapy treatment planning. Phys Med Biol 2002; 47: 1485. doi: 10.1088/0031-9155/47/9/304 [DOI] [PubMed] [Google Scholar]
- 8.Papanikolaou N, Battista JJ, Boyer AL, Kappas C, Klein E, Mackie TR, et al. Tissue inhomogeneity corrections for megavoltage photon beams. AAPM Task Group 2004; 65: 1–142. [Google Scholar]
- 9.Glover GH, Pelc NJ. An algorithm for the reduction of metal clip artifacts in CT reconstructions. Med Phys 1981; 8: 799–807. doi: 10.1118/1.595032 [DOI] [PubMed] [Google Scholar]
- 10.Kalender WA, Hebel R, Ebersberger J. Reduction of CT artifacts caused by metallic implants. Radiology 1987; 164: 576–7. doi: 10.1148/radiology.164.2.3602406 [DOI] [PubMed] [Google Scholar]
- 11.Wang G, Snyder DL, O'Sullivan J, Vannier M. Iterative deblurring for CT metal artifact reduction. IEEE Trans Med Imaging 1996; 15: 657–64. doi: 10.1109/42.538943 [DOI] [PubMed] [Google Scholar]
- 12.De Man B, Nuyts J, Dupont P, Marchal G, Suetens P. An iterative maximum-likelihood polychromatic algorithm for CT. IEEE Trans Med Imaging 2001; 20: 999–1008. doi: 10.1109/42.959297 [DOI] [PubMed] [Google Scholar]
- 13.Kachelriess M, Watzke O, Kalender WA. Generalized multi-dimensional adaptive filtering for conventional and spiral single-slice, multi-slice, and cone-beam CT. Med Phys 2001; 28: 475–90. doi: 10.1118/1.1358303 [DOI] [PubMed] [Google Scholar]
- 14.Zhao S, Robeltson D, Wang G, Whiting B, Bae KT. X-ray CT metal artifact reduction using wavelets: an application for imaging total hip prostheses. IEEE Trans Med Imaging 2000; 19: 1238–47. doi: 10.1109/42.897816 [DOI] [PubMed] [Google Scholar]
- 15.Mahnken AH, Raupach R, Wildberger JE, Jung B, Heussen N, Flohr TG, et al. A new algorithm for metal artifact reduction in computed tomography: in vitro and in vivo evaluation after total hip replacement. Invest Radiol 2003; 38: 769–75. doi: 10.1097/01.rli.0000086495.96457.54 [DOI] [PubMed] [Google Scholar]
- 16.Wei J, Sandison GA, Hsi WC, Ringor M, Lu X. Dosimetric impact of a CT metal artefact suppression algorithm for proton, electron and photon therapies. Phys Med Biol 2006; 51: 5183–97. doi: 10.1088/0031-9155/51/20/007 [DOI] [PubMed] [Google Scholar]
- 17.Bazalova M, Beaulieu L, Palefsky S, Verhaegen F. Correction of CT artifacts and its influence on Monte Carlo dose calculations. Med Phys 2007; 34: 2119–32. doi: 10.1118/1.2736777 [DOI] [PubMed] [Google Scholar]
- 18.Verburg JM, Seco J. CT metal artifact reduction method correcting for beam hardening and missing projections. Phys Med Biol 2012; 57: 2803–18. doi: 10.1088/0031-9155/57/9/2803 [DOI] [PubMed] [Google Scholar]
- 19.Abdoli M, Dierckx RA, Zaidi H. Metal artifact reduction strategies for improved attenuation correction in hybrid PET/CT imaging. Med Phys 2012; 39: 3343–60. doi: 10.1118/1.4709599 [DOI] [PubMed] [Google Scholar]
- 20.Mehranian A, Ay MR, Rahmim A, Zaidi H. X-ray CT metal artifact reduction using wavelet domain L0 sparse regularization. IEEE Trans Med Imaging 2013; 32: 1707–22. doi: 10.1109/TMI.2013.2265136 [DOI] [PubMed] [Google Scholar]
- 21.Jeon H, Youn H, Nam J, Kim HK. Theoretical investigation of metal artifact reduction based on sinogram normalization in computed tomography. Prog Med Phys 2013; 24: 303–14. doi: 10.14316/pmp.2013.24.4.303 [DOI] [Google Scholar]
- 22.Spadea MF, Verburg JM, Baroni G, Seco J. The impact of low-Z and high-Z metal implants in IMRT: a Monte Carlo study of dose inaccuracies in commercial dose algorithms. Med Phys 2014; 41: 011702. doi: 10.1118/1.4829505 [DOI] [PubMed] [Google Scholar]
- 23.Philips Healthcare System. Metal artifact reduction for orthopedic implants (O-MAR). 2012. Available from: http://clinical.netforum.healthcare.philips.com/us_en/Explore/White-Papers/CT/Metal-Artifact-Reduction-for-Orthopedic-Implants-(O-MAR) [Google Scholar]
- 24.Li H, Noel C, Chen H, Harold Li H, Low D, Moore K, et al. Clinical evaluation of a commercial orthopedic metal artifact reduction tool for CT simulations in radiation therapy. Med Phys 2012; 39: 7507–17. doi: 10.1118/1.4762814 [DOI] [PMC free article] [PubMed] [Google Scholar]
- 25.Hilgers G, Nuver T, Minken A. The CT number accuracy of a novel commercial metal artifact reduction algorithm for large orthopedic implants. J Appl Clin Med Phys 2014; 15: 274–8. doi: 10.1120/jacmp.v15i1.4597 [DOI] [PMC free article] [PubMed] [Google Scholar]
- 26.Huang JY, Kerns JR, Nute JL, Liu X, Balter PA, Stingo FC, et al. An evaluation of three commercially available metal artifact reduction methods for CT imaging. Phys Med Biol 2015; 60: 1047–67. doi: 10.1088/0031-9155/60/3/1047 [DOI] [PMC free article] [PubMed] [Google Scholar]
- 27.Thambi V, Murthy AK, Alder G, Kartha PK. Dose perturbation resulting from gold fillings in patients with head and neck cancers. Int J Radiat Oncol Biol Phys 1979; 5: 581–2. doi: 10.1016/0360-3016(79)90824-1 [DOI] [PubMed] [Google Scholar]
- 28.Sweeney RA, Bale R, Auberger T, Vogele M, Foerster S, Nevinny-Sticekl M, et al. A simple and non-invasive vacuum mouthpiece-based head fixation system for high precision radiotherapy. Strahlenther Onkol 2001; 177: 43–7. doi: 10.1007/PL00002357 [DOI] [PubMed] [Google Scholar]
- 29.Dogan N, Leybovich LB, King S, Sethi A, Emami B. Improvement of treatment plans developed with intensity-modulated radiation therapy for concave-shaped head and neck tumors. Radiology 2002; 223: 57–64. doi: 10.1148/radiol.2231010974 [DOI] [PubMed] [Google Scholar]
- 30.Kong M, Hong SE, Choi J, Kim Y. Comparison of survival rates between patients treated with conventional radiotherapy and helical tomotherapy for head and neck cancer. Radiat Oncol J 2013; 31: 1–11. doi: 10.3857/roj.2013.31.1.1 [DOI] [PMC free article] [PubMed] [Google Scholar]
- 31.Magne P, Gallucci GO, Belser UC. Anatomic crown width/length ratios of unworn and worn maxillary teeth in white subjects. J Prosthet Dent 2003; 89: 453–61. doi: 10.1016/S0022391303001252 [DOI] [PubMed] [Google Scholar]
- 32.Webster TJ, Siegel RW, Bizios R. Osteoblast adhesion on nanophase ceramics. Biomaterials 1999; 20: 1221–27. doi: 10.1016/S0142-9612(99)00020-4 [DOI] [PubMed] [Google Scholar]
- 33.Van Noort R. Titanium: the implant material of today. J Mater Sci 1987; 22: 3801–11. doi: 10.1007/BF01133326 [DOI] [Google Scholar]
- 34.Nakamura K, Kanno T, Milleding P, Ortengren U. Zirconia as a dental implant abutment material: a systematic review. Int J Prosthodont 2010; 23: 299–309. [PubMed] [Google Scholar]
- 35.Boggula R, Birkner M, Lohr F, Steil V, Wenz F, Wertz H. Evaluation of a 2D detector array for patient-specific VMAT QA with different setups. Phys Med Biol 2011; 56: 7163–77. doi: 10.1088/0031-9155/56/22/011 [DOI] [PubMed] [Google Scholar]
- 36.Kim JI, Park SY, Kim HJ, Kim JH, Ye SJ, Park JM. The sensitivity of gamma-index method to the positioning errors of high-definition MLC in patient-specific VMAT QA for SBRT. Radiat Oncol 2014; 9: 167–67. doi: 10.1186/1748-717X-9-167 [DOI] [PMC free article] [PubMed] [Google Scholar]
- 37.Mail N, Albarakati Y, Ahmad Khan M, Saeedi F, Safadi N, Al-Ghamdi S, et al. The impacts of dental filling materials on RapidArc treatment planning and dose delivery: challenges and solution. Med Phys 2013; 40: 081714. doi: 10.1118/1.4816307 [DOI] [PubMed] [Google Scholar]
- 38.Fowler JF, Harari PM, Leborgne F, Leborgne JH. Acute radiation reactions in oral and pharyngeal mucosa: tolerable levels in altered fractionation schedules. Radiother Oncol 2003; 69: 161–8. doi: 10.1016/S0167-8140(03)00231-7 [DOI] [PubMed] [Google Scholar]


