Abstract
The Global Alzheimer’s Association Interactive Network (GAAIN) aims to be a shared network of research data, analysis tools, and computational resources for studying the causes of Alzheimer’s disease. Central to its design are policies that honor data ownership, prevent unauthorized data distribution, and respect the boundaries of contributing institutions. The results of data queries are displayed in graphs and summary tables, which protects data ownership while providing sufficient information to view trends in aggregated data and discover new data sets. In this article we report on our progress in sharing data through the integration of geographically-separated and independently-operated Alzheimer’s disease research studies around the world.
Keywords: GAAIN, data sharing, neuroimaging, data repository, federation
1. Introduction
At present there are many geographically-separated and independent studies of Alzheimer’s disease and aging around the world [1, 2]. A primary focus shared among these groups is to identify quality- and length-of-life predictors that can be used to develop strategies for reducing the burdens of chronic illness due to aging and disease [2]. For example, a better understanding of how social and behavioral factors influence the effectiveness of interventions may lead to improved lives and reduced healthcare costs. Unifying these research efforts has the potential to reveal more insights into the causes of Alzheimer’s disease, improve treatments, and design preventative measures that delay the onset of physical symptoms.
The statistical significance of research findings is dependent upon the amount of data available to study. Therefore aggregating data into larger pools is essential for effective data analysis. This not only increases the precision of measured results but also reveals trends and correlations that are not apparent from the smaller data sets themselves [3]. Additionally, pooled data can be reused in new studies. This reduces the costs of those studies because the data does not need to be recollected and the different naming conventions and terminologies of the smaller data sets have already been harmonized [4].
There is currently a great deal of interest in promoting data sharing in neuroimaging [3, 4]. For our purposes, it is important to distinguish between two tiers of neuroimaging data sharing because the participants that share data in each tier have different needs and concerns. In the first tier is the individual research scientist who collects subject data, studies a particular cohort, and wishes to share the data with other researchers [3, 5]. These scientists commonly lack resources to share data and tend to be focused upon the completeness and correctness of their publications [3]. A ”single bucket” system (all data resides in a single remote location) is often sufficient for them to share their data with other scientists. The system provides storage and retrieval services, user registration and authentication, and user access controls. Well known examples include the LONI IDA [6], PING Data Portal [7] , LORIS [8], COINS [9], XNAT [10], and FITBIR1.
The second tier of sharing neuroimaging data consists of organizations that manage their own data repositories [1, 2] and have computing infrastructure, personnel resources, and software for data distribution and often make their data available to collaborators. These data repositories can include the single bucket systems in the first tier. Sharing data across repositories is complex because data repositories are inherently designed to manage and distribute data, not to interact with other repositories. Also, each data repository may be subject to local policies, ethical considerations, and legal obligations; often an Institutional Review Board places significant limits on the way that data can be shared and even stronger limits on its re-distribution [11]. Federated approaches have been implemented [e.g., BIRN Human Imaging Database (HID) [12], NeuroBase [13], and NeuroLOG [14]] that use a server to distribute queries to each data repository. The queries are accordingly reformulated at each data repository and the query results are returned and combined into a single result set. The National Database for Autism Research (NDAR) [11] is a noteworthy example of a platform that manages data sharing in both tiers. It not only receives and archives data from individual researchers of autism but is also federated with four other private databases.
The primary objective of the Global Alzheimer’s Association Interactive Network2 (GAAIN) is to establish a virtual community for sharing Alzheimer’s-related data stored in independently-operated repositories around the world. Neuroimaging, demographic, genetic, and biologic data are integrated together while respecting the boundaries of existing repositories and protecting the ownership of shared data. In the next sections we describe the architecture and discuss how our implementation choices address the practical concerns of GAAIN’s data partners.
2. Overview
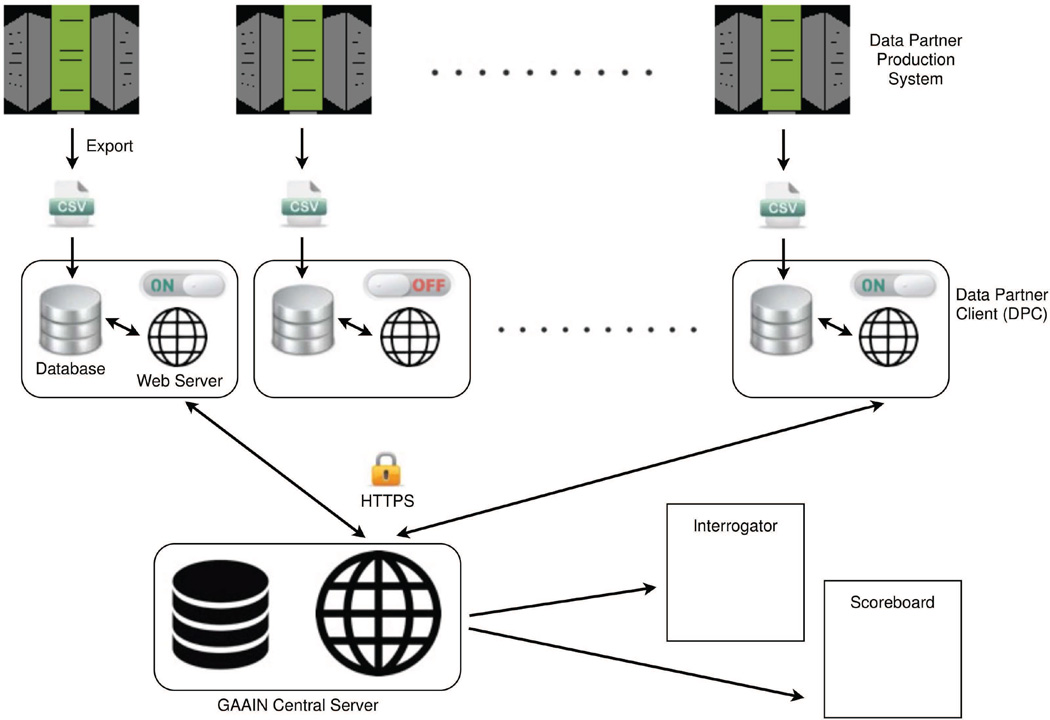
The system architecture of GAAIN contains a central server that communicates with multiple client applications (Data Partner Clients or DPC’s) that are installed at the data partner sites. As shown in Fig. 1, data is locally exported into CSV (comma-separated values) files and loaded into the DPC’s. When GAAIN investigators query the network through its web interfaces, search requests are sent to the central server. The central server in turn sends requests to the DPC’s that are “online” (accepting requests). The database in each online DPC is queried and the results are sent back to the central server where they are aggregated into the response passed on to the web interfaces.
Figure 1.
GAAIN system architecture. Data partners export their data from their production systems into CSV files. Each CSV file is loaded into the Data Partner Client (DPC) installed at each data partner site. The GAAIN central server receives search requests from GAAIN web pages (Interrogator and Scoreboard) and makes requests to the DPC’s that are online. Search results are aggregated at the server and graphed or summarized in the web pages.
The DPC is a Java jar file that contains both a light-weight web server3 and database4. While the jar file is running, the DPC can be configured using its administrative web pages and its online/offline status can be changed. It uses a single directory for file storage and two user-configurable ports for administration and secure communications to the GAAIN central server. The data stored in the DPC may be updated at the convenience of the data partner, and the only institutional requirement is to change local firewall configurations to allow HTTPS traffic from the central server into the data partner’s network.
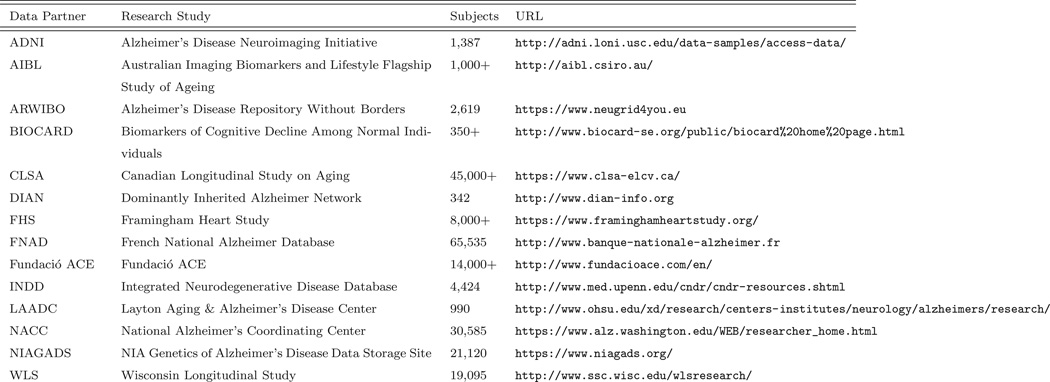
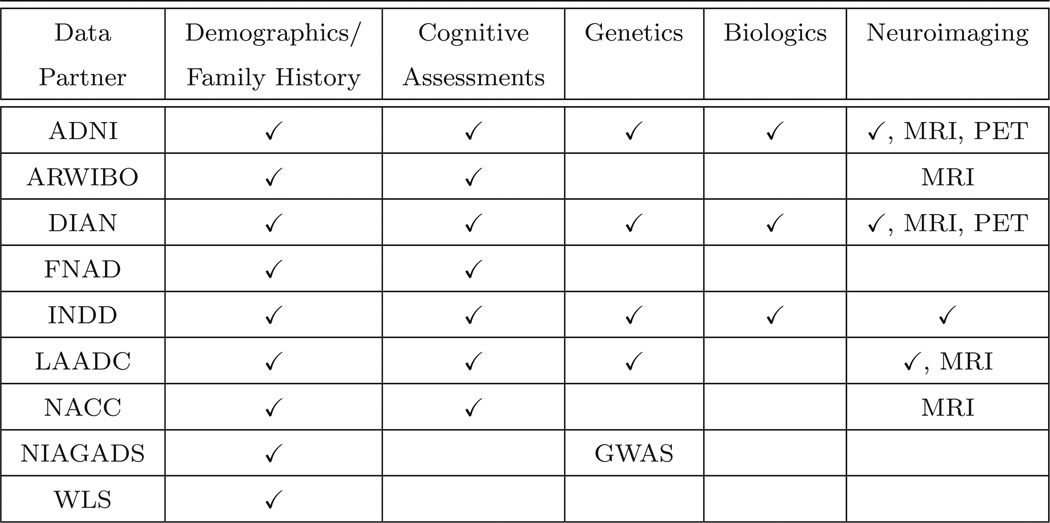
Figure 2 lists some of the data partners currently sharing or in ongoing discussions to share data through GAAIN. Data partner recruitment is in its early stages and is ongoing. Every data partner manages a significant data repository of Alzheimer’s disease data housed in North America or Europe. There is a DPC running at each data partner site, with the exception of LAADC (at their request we manage their DPC). Figure 3 summarizes the data that is available for sharing from each data partner. Searchable attributes include demographic data (e.g., age, gender, race), cognitive measurements [e.g., Mini-Mental State Examination (MMSE) [15] and Global Clinical Dementia Rating (CDR) [16] scores], historical and genetic information [e.g., parent history of Alzheimer’s disease and Apolipoprotein E (APOE) genotype], biological measurements (e.g., CSF level of phosphorylated tau protein and glucose metabolism in the right hippocampus), and data segmented from neuroimaging scans (e.g., volume of the brain and hippocampi). GAAIN provides the resources to map the nomenclature and conventions used by data partners into the global schema used within GAAIN. These mappings are currently constructed in Java code and added to the DPC, but in the future we plan on developing a mapping tool to expedite the creation of new mappings as well as to update existing mappings.
Figure 2.
Representative current and prospective GAAIN data partners.
Figure 3.
Categories and types of data available from representative data partners. A check mark indicates that data in the category has been collected by a data partner and can be searched in GAAIN. Image data files from MRI (Magnetic Resonance Imaging) and PET (Positron-Emission Tomography) neuroimaging acquisitions are also available as well as GWAS (Genome-Wide Association Studies) data files. For example “X, MRI” signifies that a data partner has collected neuroimaging data (such as hippocampus volume) along with MRI image data files.
Prospective data partners can apply to join GAAIN from the GAAIN website5. We ask that each data partner agrees to and signs a Memorandum of Understanding (MOU) that explicitly states that the data shared by the data partner will be de-identified and that the data partner will receive recognition on the GAAIN website and in all GAAIN-related presentations. Investigators can join GAAIN if they have a valid email address and they agree to acknowledge GAAIN and its data partners in all related publications.
3. Philosophy
The prominence of a data sharing network depends upon providing search functionality to those looking for data while addressing the concerns of those sharing data. As such, GAAIN aims to help scientists find Alzheimer’s data for their research while protecting the data ownership rights of each of its data partners. GAAIN search results are displayed using graphs so that scientists can intuitively interact with the results and visualize trends in the data without having direct access to the shared data sets. As an added benefit, GAAIN search interfaces essentially advertise the data shared by each data partner and increase the public visibility of each partner data repository. Participation in GAAIN can also help its partners comply with data sharing requirements of their funding agencies.
GAAIN has specifically designed its architecture to address the practical concerns of its data partners. Design and policy choices that motivate membership are critical because participation in GAAIN is voluntary. Most Alzheimer’s disease researchers have invested considerable time and resources in building their data repositories and therefore will be receptive to joining a data sharing network only if it requires little investment of their resources and only if their data repositories continue to manage their data. GAAIN recognizes and addresses these concerns:
Control
GAAIN data partners retain complete control over their data. GAAIN investigators are directed to the data use application pages of its data partners where they follow existing application processes. GAAIN does not grant access to partner data nor has access to the user authentication methods and access controls of its data partners. Every DPC has an ”on/off switch” which provides the freedom to immediately disconnect data from the network (”go offline”) at any time for any reason.
Light footprint
The GAAIN DPC at each data partner site does not interfere with or consume resources of the local production system. The DPC is typically installed on a computer system separate from the production system. This is possible because data is imported into the DPC from a CSV file that is created by exporting data from the production database. Since it does not have direct access to the production database, the DPC cannot disrupt the normal operations of the production system.
No copy policy
At no time will GAAIN store data from any data partner on any GAAIN central server computer disk, unless requested by the data partner. GAAIN will manage a DPC on its computers if a data partner does not wish to do so. GAAIN central servers do not save and manage copies of the data. However, data fulfilling investigator searches may be cached in server memory to optimize search performance but are never copied or written to disk. Whenever a partner goes offline, all data cached from the partner is erased.
Security
All communications between the DPC’s and the GAAIN central server are performed securely using HTTPS. During the client registration process, privately-signed security certificates are exchanged and used to establish secure identities. When data partners are required to conduct security reviews of externally-developed software, GAAIN makes the DPC source code available for inspection.
Not all architectures that have been used for sharing neuroimaging data have taken these concerns into consideration. The BIRN HID [12] framework was developed to transfer data between HID applications in order to optimize queries and distribute data. Data made available at one HID application can be read by other federated HID applications. HID installation requires considerable effort since it runs as a 3 tier J2EE (Java 2 Platform Enterprise Edition) application. Approaches such as NeuroBase [13] and NeuroLOG [14] use mediation layers to translate investigator queries into source-dependent queries that directly execute in the databases of its data providers. These data sharing systems also display query results in tabular form, which assumes that investigators have been granted access to that data. Among all neuroimaging data sharing systems, NDAR’s [11] federation approach is perhaps the most similar to that of GAAIN’s. NDAR issues queries and receives result data only from federated repositories that have approved an investigator’s data access. Permission for data access may only come from the institution hosting each repository. Investigators who are not approved may still browse the data available in each database to see if requesting data access is worthwhile.
4. Search Interfaces
The search interfaces in GAAIN are designed to meet the different needs of GAAIN investigators. The GAAIN Scoreboard helps investigators quickly determine if data exists in sufficient numbers to meet study objectives, and the GAAIN Interrogator allows investigators to view data trends and relationships before being shown where to obtain the actual data.
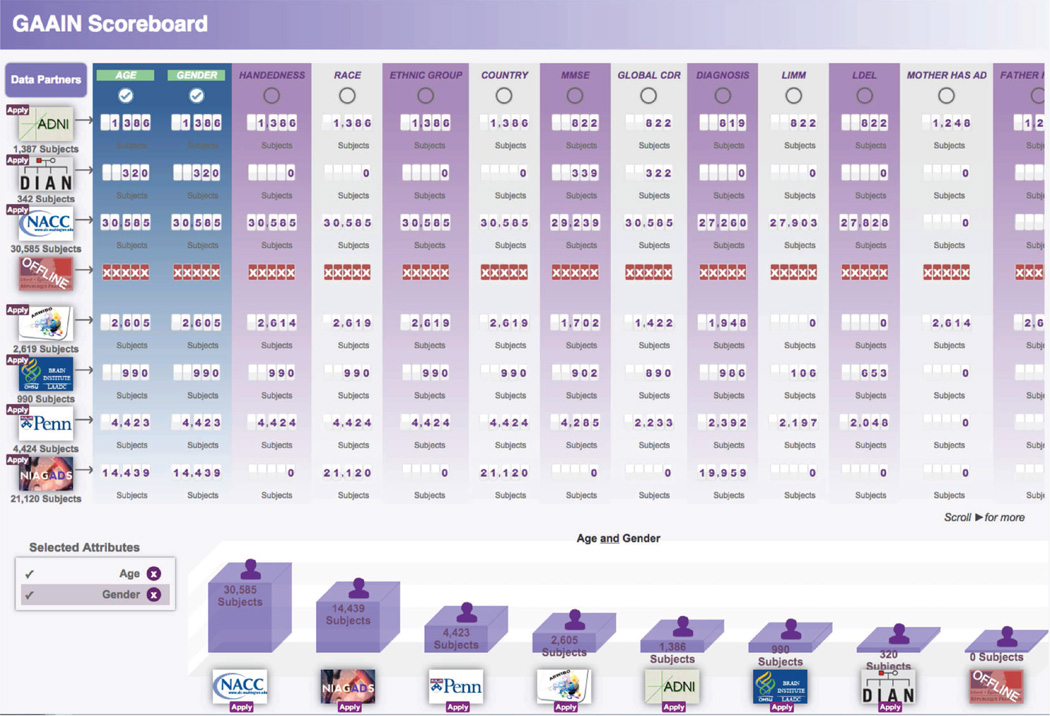
The GAAIN Scoreboard provides subject counts across research studies in the network and is publicly accessible. Since all subjects in a research study do not necessarily have the same amount of data collected on them, investigators can determine beforehand the actual numbers of subjects useful to their work instead of downloading and inspecting the data themselves. For each subject attribute defined in the GAAIN schema (e.g., gender or MMSE total score), the total number of subjects with data collected for that attribute is displayed for each data partner. This gives investigators a summary view of the searchable data in the network and a general picture of the type of data collected by each data partner. In addition to reporting the total number of subjects per attribute, the Scoreboard also allows investigators to select combinations of attributes. In this case a subject is counted only if there is data collected for that subject for all the selected attributes (e.g., gender and MMSE total score). These subject counts are graphed as bars in a bar chart and are ordered from highest to lowest counts. Periodically, the GAAIN central server will check the online status of each DPC and will record when it is offline. Whenever a DPC is offline, the Scoreboard displays red ”X”’s instead of subject counts for the data partner, gives its logo an offline status, and reports the last date when the DPC was online. In this way, data partners are encouraged to keep their DPC’s online and maintain their links to the network.
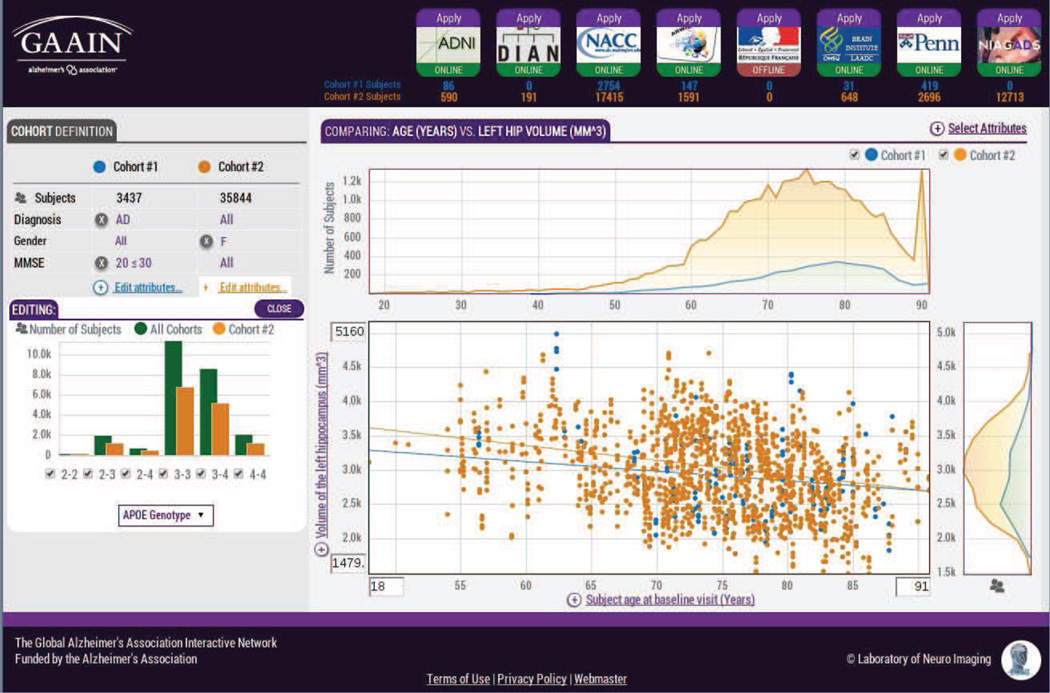
The GAAIN Interrogator allows investigators to inspect and interact with data in the network through the definition of cohorts. The first cohort is typically defined as a reference group of subjects and is compared to the second cohort. The cohorts are plotted together in the data graphs and this provides a context in which to view the differences between them. As investigators incrementally adjust the definition of the second cohort, they receive instantaneous feedback when the graphs automatically update. Investigators utilize this feedback to make further adjustments and so they effectively ”interrogate” the data.
Investigators view different aspects of the cohorts by changing the two subject attributes that are graphed. The types of graphs that are shown depend upon the data types of the attributes. When both attributes are limited to finite value sets (e.g., gender values of “male” or “female”), all value combinations of the attributes are plotted in a bar chart. When both attributes have unrestricted integral or floating-point values, the attribute values are plotted in a scatter plot. If the attributes are of mixed data types, either averaged values or histograms are plotted depending upon whether the attribute values vary in time or not. Located around the main graph of the two attributes of interest are secondary graphs that provide summary information about each attribute. Each secondary graph is used to change the display of the values plotted in the main graph.
The controls for defining the cohorts and changing the display of the main graph are combined with bar charts and line graphs to make selections visually intuitive. It is easier to choose a search range (e.g., a range of ages) from a graph (e.g., an age histogram) because the characteristics of the search field (e.g., shape of the histogram) influence one’s selection. For example, if an age histogram shows no subjects with ages greater than 90 years old, it is unlikely the investigator will change the selection minimum to an age greater than 90. This differs from non-graphical interfaces [12, 14] which typically use a text box or pull down menu to adjust a search range. In those interfaces an investigator learns about search field characteristics via trial-and-error (e.g., try setting the minimum age to 90, submit the query, and receive zero results).
The logo of each data partner in the network is displayed in the top right corner of the Interrogator. Each data partner is shown either in an online state (ready for a search), offline state (no searching), or retrieving state (sending search results). Underneath each logo are the numbers of subjects in each cohort from that data partner. As the cohorts change, these numbers are updated to reflect the results of the new search. After investigators have completed searching, they determine which data partners have the subject data they need by inspecting the cohort numbers. Next to each data partner logo is a link that forwards the investigator to the data partner’s application page where the investigator can apply for the data.
5. Future Directions
Our goal is to establish a virtual community for sharing Alzheimer’s data which, in the future, can serve as the foundation for other unifying initiatives for studying Alzheimer’s disease. Although GAAIN currently supports the sharing of measurements and derived data from neuroimaging scans, our next focus is to incorporate analysis tools and computational resources into the GAAIN framework with the objective of extracting information from the neuroimaging and genetic data files of our data partners. This derived data will be stored back in the network and made available to investigators who will be able to integrate the data with their search results.
It is an additional goal of ours to offer a data homogenization service to our data partners. This is readily achievable because partner data in GAAIN is already mapped to a single schema. If an investigator has been approved by multiple data partners and each data partner gives their consent, then the investigator will be able to download all the data in the standardized GAAIN format. This will eliminate the need for each investigator to understand the different terminologies and definitions used by each data partner and therefore reduce the amount of effort needed to use the data.
One of the central challenges encountered when harmonizing data across data repositories is how to manage different measurements of similar attributes. For example, we found that CSF biomarker levels were measured using different assays in ADNI [17] and INDD [18] and the protocol for hippocampal volume estimation in ADNI [19] was different than the protocol used by LAADC [20]. In many cases only partial correlations can be found between measurements, as when attempting to combine the MMSE and CDR cognitive assessments [21]. We will be extending our search interfaces by developing components that visually group together similar attributes, and this will provide search functionality without the need to combine them.
Figure 4.
GAAIN Scoreboard. The logo of each data partner is displayed in the leftmost table column along with a link to the data partner’s web site or application page and the total number of searchable subjects. To the right of each logo are the number of subjects with data collected for each shared data attribute. The bar chart below the table illustrates the number of subjects with data collected for all the selected attributes and updates whenever the selection changes.
Figure 5.
GAAIN Interrogator. On the left side queries are constructed by defining cohorts and on the right side the query results are graphed. When the cohort definitions are refined, the graphs automatically update. This allows an investigator to visually interact with and ”interrogate” the data in the network. The logo of each data partner is displayed in the upper right corner along with the number of subjects that meet the criteria for each cohort from that data partner.
Highlights.
A shared data network is presented for studying the causes of Alzheimer’s disease.
Geographically-separate/independently-operated data repositories are linked together.
Search interfaces allow investigators to view data trends without access to data.
Ownership of data is protected by displaying the results of queries as graphs.
Data is never copied to the central server disks nor distributed to investigators.
Acknowledgments
This work was supported by the Global Alzheimer’s Association Interactive Network (GAAIN) initiative of the Alzheimer’s Association and by National Institutes of Health grants 5P41 EB015922-16 and 1U54EB020406-01.
Footnotes
Publisher's Disclaimer: This is a PDF file of an unedited manuscript that has been accepted for publication. As a service to our customers we are providing this early version of the manuscript. The manuscript will undergo copyediting, typesetting, and review of the resulting proof before it is published in its final citable form. Please note that during the production process errors may be discovered which could affect the content, and all legal disclaimers that apply to the journal pertain.
http://www.eclipse.org/jetty/
References
- 1.Erten-Lyons D, Sherbakov LO, Piccinin AM, Hofer SM, Dodge HH, Quinn JF, Woltjer RL, Kramer PL, Kaye JA. Review of selected databases of longitudinal aging studies. Alzheimer’s & Dementia. 2012;8(6):584–589. doi: 10.1016/j.jalz.2011.09.232. [DOI] [PMC free article] [PubMed] [Google Scholar]
- 2.Stanziano DC, Whitehurst M, Graham P, Roos BA. A review of selected longitudinal studies on aging: past findings and future directions. Journal of the American Geriatrics Society. 2010;58(s2):S292–S297. doi: 10.1111/j.1532-5415.2010.02936.x. [DOI] [PMC free article] [PubMed] [Google Scholar]
- 3.Ferguson AR, Nielson JL, Cragin MH, Bandrowski AE, Martone ME. Big data from small data: data-sharing in the’long tail’of neuroscience. Nature neuroscience. 2014;17(11):1442–1447. doi: 10.1038/nn.3838. [DOI] [PMC free article] [PubMed] [Google Scholar]
- 4.Poldrack RA, Gorgolewski KJ. Making big data open: data sharing in neuroimaging. Nature neuroscience. 2014;17(11):1510–1517. doi: 10.1038/nn.3818. [DOI] [PubMed] [Google Scholar]
- 5.Poline J-B, Breeze JL, Ghosh S, Gorgolewski K, Halchenko YO, Hanke M, Haselgrove C, Helmer KG, Keator DB, Marcus DS, et al. Data sharing in neuroimaging research. Frontiers in neuroinformatics. 6 doi: 10.3389/fninf.2012.00009. [DOI] [PMC free article] [PubMed] [Google Scholar]
- 6.Neu SC, Crawford KL, Toga AW. Practical management of heterogeneous neuroimaging metadata by global neuroimaging data repositories. Frontiers in neuroinformatics. 6 doi: 10.3389/fninf.2012.00008. [DOI] [PMC free article] [PubMed] [Google Scholar]
- 7.Bartsch H, Thompson WK, Jernigan TL, Dale AM. A web-portal for interactive data exploration, visualization, and hypothesis testing. Frontiers in neuroinformatics. 8 doi: 10.3389/fninf.2014.00025. [DOI] [PMC free article] [PubMed] [Google Scholar]
- 8.Das S, Zijdenbos AP, Harlap J, Vins D, Evans AC. Loris: a web-based data management system for multi-center studies. Frontiers in neuroinformatics. 5 doi: 10.3389/fninf.2011.00037. [DOI] [PMC free article] [PubMed] [Google Scholar]
- 9.Scott A, Courtney W, Wood D, De la Garza R, Lane S, King M, Wang R, Roberts J, Turner JA, Calhoun VD. Coins: an innovative informatics and neuroimaging tool suite built for large heterogeneous datasets. Frontiers in neuroinformatics. 5 doi: 10.3389/fninf.2011.00033. [DOI] [PMC free article] [PubMed] [Google Scholar]
- 10.Marcus DS, Olsen TR, Ramaratnam M, Buckner RL. The extensible neuroimaging archive toolkit. Neuroinformatics. 2007;5(1):11–33. doi: 10.1385/ni:5:1:11. [DOI] [PubMed] [Google Scholar]
- 11.Hall D, Huerta MF, McAuliffe MJ, Farber GK. Sharing heterogeneous data: the national database for autism research. Neuroinformatics. 2012;10(4):331–339. doi: 10.1007/s12021-012-9151-4. [DOI] [PMC free article] [PubMed] [Google Scholar]
- 12.Ozyurt IB, Keator DB, Wei D, Fennema-Notestine C, Pease KR, Bockholt J, Grethe JS. Federated web-accessible clinical data management within an extensible neuroimaging database. Neuroinformatics. 2010;8(4):231–249. doi: 10.1007/s12021-010-9078-6. [DOI] [PMC free article] [PubMed] [Google Scholar]
- 13.Barillot C, Benali H, Dojat M, Gaignard A, Gibaud B, Kinkingnéhun S, Matsumoto J, Pélégrini-Issac M, Simon E, Temal L, et al. Federating distributed and heterogeneous information sources in neuroimaging: the neurobase project. Studies in health technology and informatics. 2006;120:3. [PubMed] [Google Scholar]
- 14.Gibaud B, Kassel G, Dojat M, Batrancourt B, Michel F, Gaignard A, Montagnat J. Neurolog: sharing neuroimaging data using an ontology-based federated approach. AMIA Annual Symposium Proceedings, Vol. 2011, American Medical Informatics Association. 2011:472. [PMC free article] [PubMed] [Google Scholar]
- 15.Folstein MF, Folstein SE, McHugh PR. ?mini-mental state?: a practical method for grading the cognitive state of patients for the clinician. Journal of psychiatric research. 1975;12(3):189–198. doi: 10.1016/0022-3956(75)90026-6. [DOI] [PubMed] [Google Scholar]
- 16.Hughes CP, Berg L, Danziger WL, Coben LA, Martin RL. A new clinical scale for the staging of dementia. The British journal of psychiatry. 1982;140(6):566–572. doi: 10.1192/bjp.140.6.566. [DOI] [PubMed] [Google Scholar]
- 17.Shaw LM, Vanderstichele H, Knapik-Czajka M, Clark CM, Aisen PS, Petersen RC, Blennow K, Soares H, Simon A, Lewczuk P, et al. Cerebrospinal fluid biomarker signature in alzheimer’s disease neuroimaging initiative subjects. Annals of neurology. 2009;65(4):403–413. doi: 10.1002/ana.21610. [DOI] [PMC free article] [PubMed] [Google Scholar]
- 18.Toledo JB, Brettschneider J, Grossman M, Arnold SE, Hu WT, Xie SX, Lee VM-Y, Shaw LM, Trojanowski JQ. Csf biomarkers cutoffs: the importance of coincident neuropathological diseases. Acta neuropathologica. 2012;124(1):23–35. doi: 10.1007/s00401-012-0983-7. [DOI] [PMC free article] [PubMed] [Google Scholar]
- 19.Schuff N, Woerner N, Boreta L, Kornfield T, Shaw L, Trojanowski J, Thompson P, Jack C, Weiner M, et al. Mri of hippocampal volume loss in early alzheimer’s disease in relation to apoe genotype and biomarkers. Brain. 2009;132(4):1067–1077. doi: 10.1093/brain/awp007. [DOI] [PMC free article] [PubMed] [Google Scholar]
- 20.Kaye JA, Swihart T, Howieson D, Dame A, Moore M, Karnos T, Camicioli R, Ball M, Oken B, Sexton G. Volume loss of the hippocampus and temporal lobe in healthy elderly persons destined to develop dementia. Neurology. 1997;48(5):1297–1304. doi: 10.1212/wnl.48.5.1297. [DOI] [PubMed] [Google Scholar]
- 21.Perneczky R, Wagenpfeil S, Komossa K, Grimmer T, Diehl J, Kurz A. Mapping scores onto stages: mini-mental state examination and clinical dementia rating. The American journal of geriatric psychiatry. 2006;14(2):139–144. doi: 10.1097/01.JGP.0000192478.82189.a8. [DOI] [PubMed] [Google Scholar]


