Abstract
Purpose
To develop an ultrafast T1 mapping method for high-resolution, volumetric T1 measurements in the abdomen.
Methods
The Look-Locker method was combined with a stack-of-spirals acquisition accelerated using 3D through-time spiral GRAPPA reconstruction for fast data acquisition. A segmented k-space acquisition scheme was proposed and the time delay between segments for the recovery of longitudinal magnetization was optimized using Bloch equation simulations. The accuracy of this method was validated in a phantom experiment and in vivo T1 measurements were performed with 35 asymptomatic subjects on both 1.5 T and 3 T MRI systems.
Results
Phantom experiments yielded close agreement between the proposed method and gold standard measurements for a large range of T1 values (200 to 1600 ms). The in vivo results further demonstrate that high-resolution T1 maps (2×2×4 mm3) for 32 slices can be achieved in a single clinically feasible breath-hold of approximately 20 s. The T1 values for multiple organs and tissues in the abdomen are in agreement with the published literature.
Conclusion
A high-resolution 3D abdominal T1 mapping technique was developed, which allows fast and accurate T1 mapping of multiple abdominal organs and tissues in a single breath-hold.
Keywords: T1 mapping, parallel imaging, Look-Locker method, non-Cartesian sampling, spiral trajectory
INTRODUCTION
Quantitative knowledge of T1 relaxation times provides valuable information in a variety of pathological conditions in the abdomen. In the liver, for example, T1 mapping has been used to differentiate cirrhotic from normal livers (1). In the kidney, T1 relaxation time has also shown potential to be an imaging marker for declining function (2). A recent study suggests that with oxygen administration, parametric T1 maps can be used as a biomarker to investigate oxygen delivery in splenic, renal, and hepatic parenchyma (3). Moreover, quantitative measurement of T1 relaxation times is also needed for accurate perfusion quantification with dynamic contrast enhanced methods (4).
In practice, accurate and high-resolution T1 quantification requires long imaging times and can be challenging to accomplish when covering large volumes (5). Abdominal T1 quantification is even more challenging due to respiratory motion. Recently, a number of techniques for fast, volumetric T1 mapping of the human brain have been reported (6–9). However, most of these techniques require several minutes for a volumetric T1 map, which would be problematic in the abdomen due to the deleterious effects of respiratory motion. Previous studies have also used a variable flip angle approach to acquire full volume abdominal T1 maps in multiple breath-holds (10). While this method can acquire volumetric T1 maps within a much shorter time window, it is sensitive to B1 field inhomogeneity and motion between breath-holds still remains a problem (11). The Look-Locker technique is a commonly used method for rapid T1 mapping (12). Compared to the variable flip angle approach, this method is more tolerant of B1 field inhomogeneities (7, 8, 13). However, when combined with a Cartesian readout, the Look-Locker method still cannot provide high resolution volumetric T1 maps of the abdomen within a breath-hold (5).
In this study, we combined the Look-Locker method with a non-Cartesian stack-of-spirals acquisition technique for rapid volumetric T1 mapping in the abdomen. The acquisition time was further shortened to a single breath-hold by undersampling the stack-of-spirals data and using the 3D through-time spiral GRAPPA reconstruction (14–16). The technique was tested for accuracy on phantoms and was applied to asymptomatic volunteers on both 1.5 T and 3 T scanners.
METHODS
Data Acquisition for T1 Mapping
For fast 3D T1 mapping, the inversion-recovery Look-Locker method was combined with a stack-of-spirals trajectory and through-time spiral GRAPPA to accelerate data acquisition (15). In the present study, a total of 48 variable-density spiral interleaves were required in-plane to meet the Nyquist criterion. This spiral trajectory was customized for four different field-of-views (FOVs) from 36 to 48 cm with a maximum gradient amplitude of 21 mT/m and a maximum slew rate of 162 mT/m/ms. The readout duration for each spiral interleaf ranged from 2.86 to 3.15 ms. All the trajectories were measured using the method proposed by Duyn et al. with a water phantom (17). To accelerate the data acquisition, a reduction factor of R was used in-plane and the number of spiral interleaves actually acquired in each slice was 48/R. In the through-slice direction, the data were linearly encoded and 6/8 partial Fourier was applied to further accelerate data sampling.
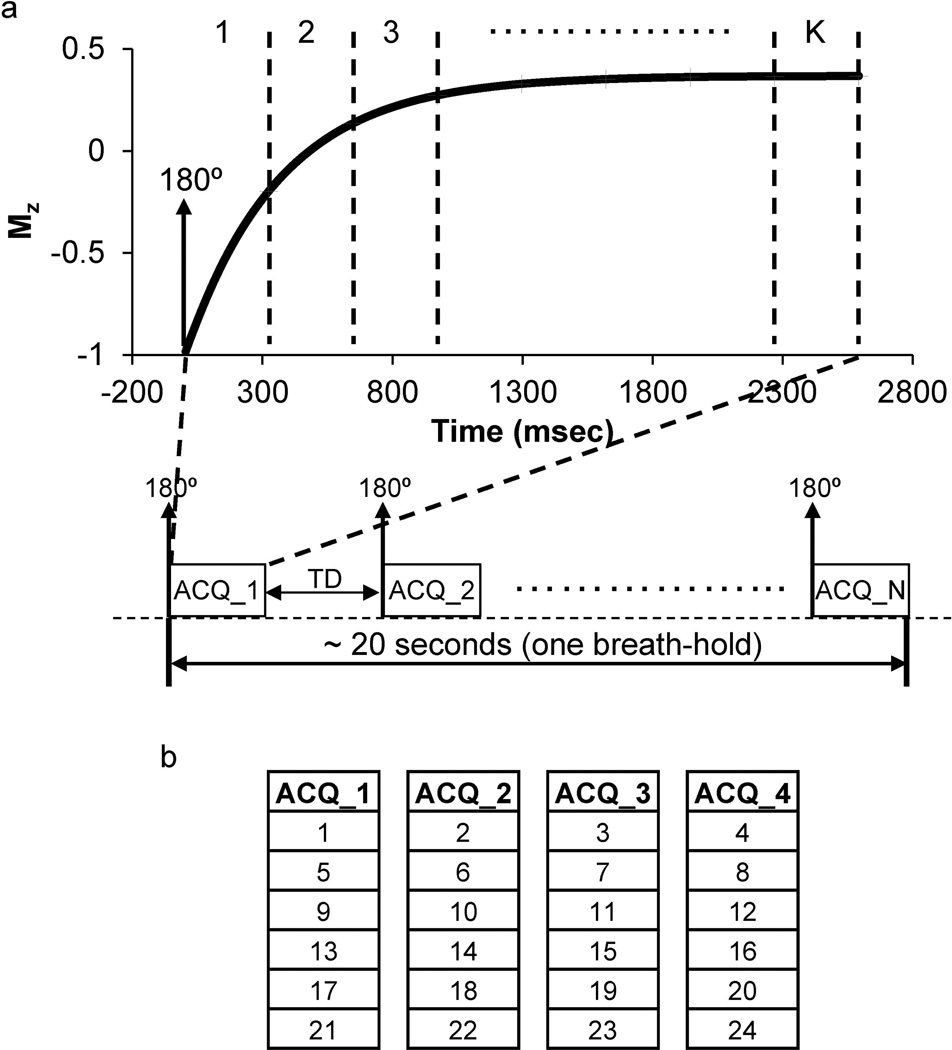
The acquisition scheme for the inversion-recovery Look-Locker method is similar to the 2D snapshot FLASH version introduced previously (18). For efficient 3D coverage, the previous 2D Cartesian readout was replaced by a fast stack-of-spirals readout and the whole acquisition was divided into N segments (Table 1). In each segment, a non-selective adiabatic inversion pulse was applied first and 1/N of the desired k-space encodings were acquired afterwards. A time delay (TD) was applied between segments to allow for recovery of longitudinal magnetization (Figure 1a). To achieve reliable T1 mapping, several 3D volumes (noted as K; minimum 8 volumes in this study) with different effective inversion times (TIs) were acquired during the longitudinal relaxation. In each volume, all the spiral encodings within a given slice were acquired consecutively in the same segment, while the slices were acquired in an interleaved manner between segments to minimize data discontinuity (Figure 1b). In this study, typically 32 slices were acquired to cover a 3D volume. The effective TI of a given volume was defined as the time of acquisition of the central slice.
Table 1.
Imaging parameters for the segmented data acquisition.
| R | Field strength (T) |
# of 3D volumes (K) |
# of segments (N) |
TI range (ms) |
Time delay (TD; s) |
Acquisition time (s) |
|---|---|---|---|---|---|---|
| 4 | 1.5 | 8 | 4 | 240 ~ 2600 | 3.5 | 21 |
| 4 | 3 | 8 | 4 | 240 ~ 2600 | 4 | 23 |
| 6 | 3 | 10 | 3 | 230 ~ 2900 | 4 | 17 |
Figure 1.
(a) A diagram of the segmented Look-Locker method for rapid 3D T1 mapping. The whole acquisition was divided into N segments (ACQ_1 to ACQ_N) with a certain time delay (TD) in between for the recovery of longitudinal magnetization. Overall, K under-sampled 3D volumes were acquired in a single breath-hold (~20 s) for T1 quantification. (b) An example of the interleaved slice acquisition with four segments (N = 4). For a total of 32 slices, 24 slices were actually acquired with 6/8 partial Fourier applied in the through-slice direction. Each number in the figure represents continuously sampling of all the spiral interleaves needed within a given slice. In each segment, this interleaved slice encoding repeated K times along the time as introduced in (a).
In order to achieve suitable coverage for reliable T1 estimation, the number of 3D volumes on the inversion recovery curve (K) acquired and the number of segments (N) needed vary with the reduction factor. With an in-plane reduction factor of 4 (R = 4), eight 3D volumes (K = 8) with effective TI ranging from ~240 to ~2600 ms were acquired in four segments (N = 4). Since the physiological T1 values for organs in abdomen fall into the range of 500–1300 ms (19, 20), this acquisition time provides enough coverage of signal recovery curves for an accurate T1 estimation (21). Alternatively, for a higher in-plane reduction factor of 6 (R = 6), fewer spiral encodings were needed and hence only three segments (N = 3) were used for the whole scan with ten 3D volumes (K = 10). In this case, the effective TI ranged from ~230 to ~2900 ms.
Optimization of Time Delay
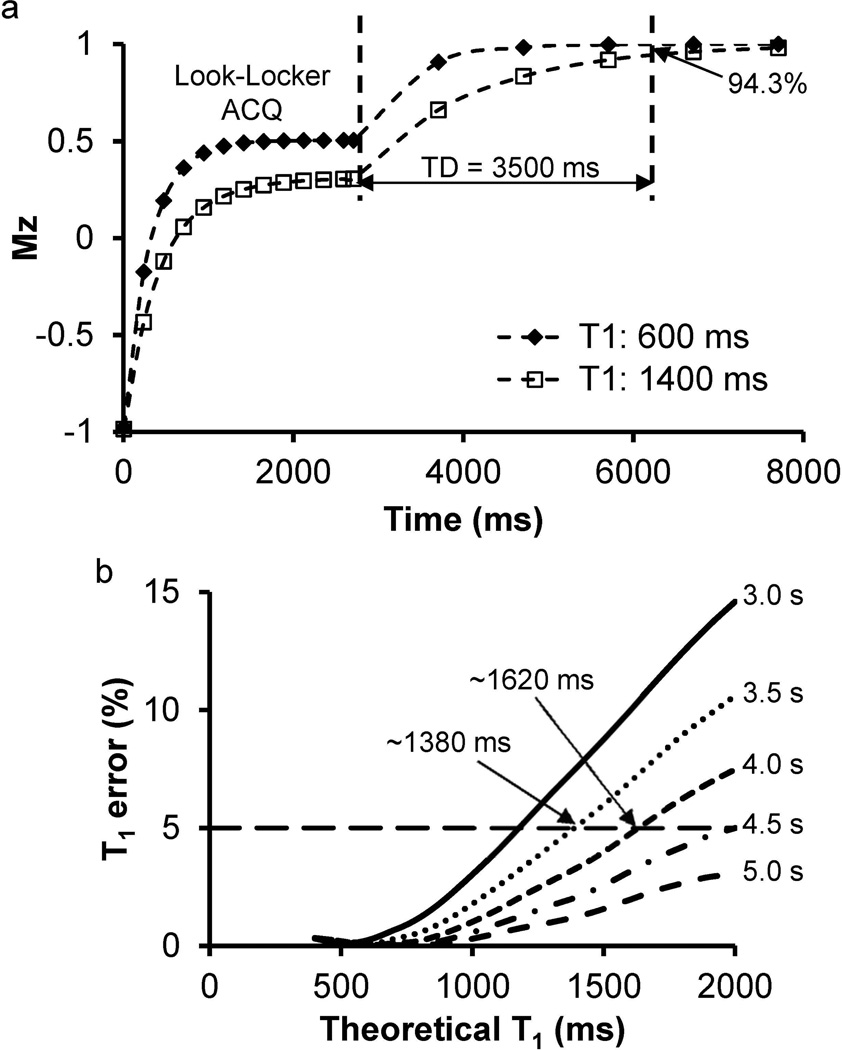
To optimize the time delay between segments for fast imaging while preserving an accurate T1 estimation, Bloch equation simulations were performed in MATLAB (The Mathworks, Natick, MA) to simulate the signal evolution during data acquisition and relaxation. Tissues with different T1 values from 400 ms to 2000 ms were investigated. After inversion of the MR signal, signal recovery curves were calculated with a 2.7-s Look-Locker acquisition window followed by different lengths of time delay up to 5 s. T1 values were calculated from the simulated recovery curves and then compared to the theoretical T1 values. The shortest time delay resulting in less than 5% error for most physiological T1 values in abdomen was chosen.
Phantom Studies
The accuracy of T1 measurement with the proposed method was validated using a phantom containing several vials with varying concentrations of GdCl3 and agarose. The experiments were performed on both a Siemens 3 T Skyra scanner and a Siemens 1.5 T Espree scanner with reduction factors of 6 and 4, respectively. T1 values measured with a 2D inversion-recovery single-echo spin-echo sequence (TR: 6 s; six inversion times from 50 ms to 3800 ms) were used as the gold standard reference. For the spiral Look-Locker method, a long time delay of 5 s was used to accommodate a vial with a long T1 of ~1600 ms. Other parameters were: FOV= 36×36 cm; matrix size 192×192 for an effective in-plane resolution of 1.9 mm; TR 4.5 ms; TE 0.6 ms; flip angle 7°; slice thickness 4 mm.
In Vivo Studies
After phantom validation, quantitative 3D T1 maps of the abdomen were acquired from 35 healthy volunteers. The study is IRB approved and HIPAA compliant. Informed written consent was obtained from all volunteers. Of the 35 subjects, nine (mean age, 23.3 years; seven male, two female) underwent imaging with a Siemens 1.5 T Espree scanner with 12 receive channels (a six-channel body array coil and six channels from the spine array), while the remaining 26 (mean age, 29.0 years; fifteen male, eleven female) were imaged with a Siemens 3 T Skyra scanner using 20 ~ 34 receive channels (a 18-channel body array coil and a 32-channel spine array). For T1 mapping performed at 1.5 T, a reduction factor of 4 was used and a time delay of 3.5 s was applied between segments. To fit the T1 values, a total of eight 3D volumes were acquired. The total scan time for the spiral Look-Locker acquisition was 21 s and the whole scan was acquired within a single breath-hold.
For the experiments performed on the 3 T scanner, a similar setting with the same reduction factor (R = 4) was first applied on two volunteers. A longer time delay of 4 s was applied for the consideration of longer T1 relaxation times at the higher field and therefore the total scan time was ~23 s. Additionally, with more receive channels available on this scanner, a higher reduction factor of 6 was also tested for 26 subjects. A total of ten 3D volumes were acquired for quantitative T1 measurement. Since only three segments were needed for the R = 6 image, the total scan time was 17 s.
Other imaging parameters that were kept the same for the experiments on both 1.5 T and 3 T scanners included: FOV 36–48 cm; matrix 192×192 – 240×240 (effective in-plane resolution 1.9–2.0 mm); TR/TE 4.5–4.9/0.6 ms; flip angle 7°; 32 slices; slice thickness 4 mm; partial Fourier in slice direction 6/8. The in-plane FOV and matrix size were varied based on patient size to maintain approximately constant spatial resolution across subjects. After the spiral Look-Locker acquisition, a separate calibration scan of six fully sampled 3D volumes with 32 slices was performed using a spoiled gradient echo sequence and the stack-of-spirals trajectory for calibrating the GRAPPA weights. No inversion pulse was applied and the whole scan was acquired during completely free breathing (~40 s).
Image Reconstruction and Processing
After the experiments, raw data were transferred to a standalone workstation and images were reconstructed offline using MATLAB. The missing spiral interleaves were first reconstructed using the 3D through-time spiral GRAPPA. The through-time non-Cartesian GRAPPA technique was originally introduced for 2D real-time cardiac imaging (15) and this technique has been recently extended for 3D applications using both radial and spiral trajectories (14, 22, 23). Briefly, a GRAPPA kernel of size 2 × 3 was used in the spiral arm × readout direction as suggested in (15). For each kernel with a specific geometry, GRAPPA weights were estimated from the fully-sampled calibration scan acquired separately. For 2D cases, the GRAPPA weights can be calculated from 1) nearby segments with similar geometry in the same fully-sampled frame and 2) segments with similar geometry from other fully-sampled frames acquired through time. For the 3D cases, the segments with similar geometry appear not only in different frames, but also in different slices as well, all of which were combined together to calculate the GRAPPA weights for this specific kernel (23). For image reconstruction with different FOVs, the GRAPPA kernels were automatically determined by the measured spiral trajectory. No manual adjustment was needed from the operator. In this study, an 8 × 1 segment size (readout × spiral arms) was used as suggested in the literature (15). After the missing interleaves were reconstructed, a non-uniform Fast Fourier Transform was performed using the image reconstruction toolbox (24). All image reconstruction was performed on a desktop computer (Intel Xeon E3-1270 quad-core CPUs at 3.4 GHz and 16GB of RAM) and the average reconstruction time for one volume was approximately 4 min.
When all the images were reconstructed, voxel-by-voxel fitting was performed with a three-parameter model expressed as (8):
and T1 was calculated as:
The accuracy of T1 measurement using through-time spiral GRAPPA at high undersampling rates is dependent on the signal-to-noise ratio (SNR). To evaluate the influence of noise on T1 accuracy, a bootstrapped Monte Carlo simulation (25) was performed using the data acquired from one volunteer at 3 T (R = 6). In addition to the normal undersampled T1 measurement, a noise measurement was also performed with the same acquisition parameters but no excitation or inversion pulses. Fifty spiral GRAPPA reconstructions followed by T1 mapping were performed on the undersampled data added with randomly reordered noise. Mean T1 values and standard deviations were then quantified from the 50 data sets for multiple abdominal tissues.
A study was also performed to investigate the amount of calibration data needed in GRAPPA weight estimation for accurate T1 quantification. For an in vivo measurement performed on the 3 T scanner (R = 6), the same undersampled dataset was reconstructed using the GRAPPA weights determined from the full calibration dataset (six volumes) as well as subsets from one to five volumes, respectively. The segment size (8×1 in readout × spiral arm direction) was held the same for all reconstructions. The corresponding T1 values were calculated from the reconstructed images and their accuracy was evaluated using the normalized Root Mean Square Error (NRMSE) calculated from all the tissues in the map. The T1 maps obtained with the full calibration dataset (six volumes) were used as the reference.
RESULTS
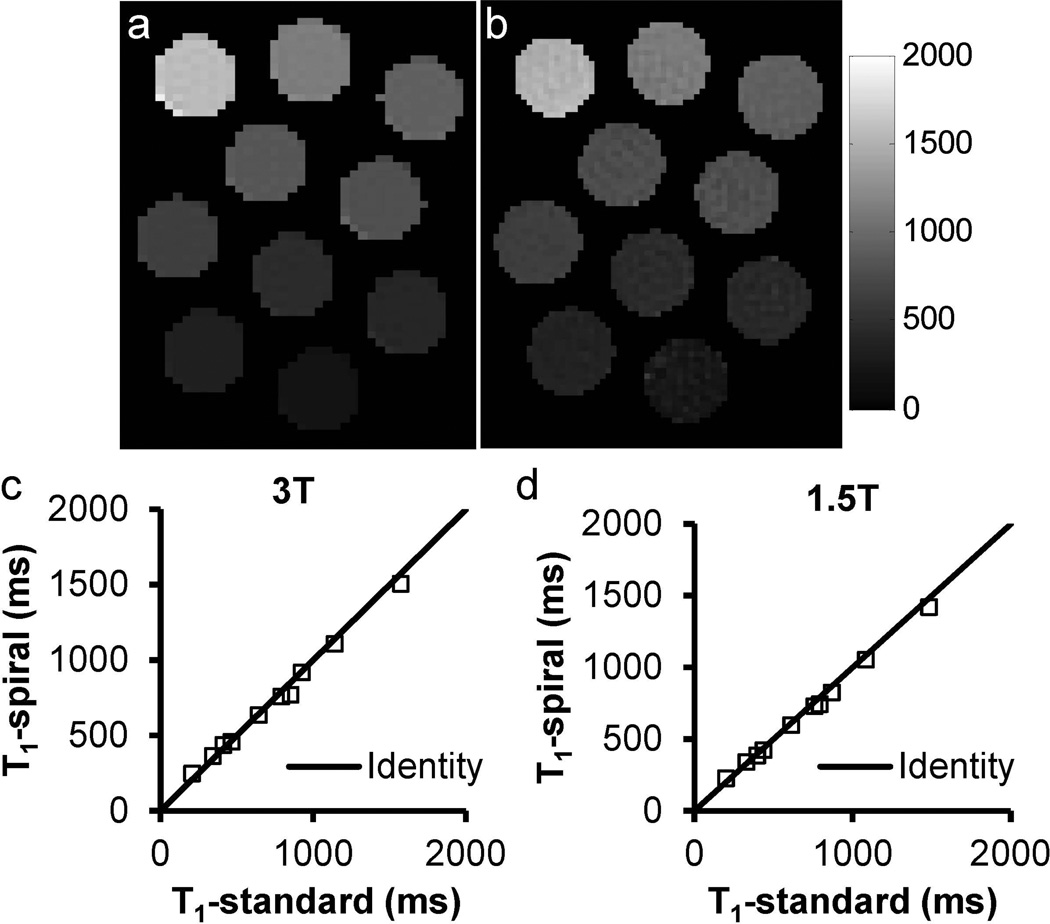
The accuracy of the proposed T1 mapping method was first validated using a phantom on both 1.5 T and 3 T scanners against a standard T1 measurement method. As shown in Figure 2a–c, a close agreement between the proposed spiral Look-Locker method (R = 6) and the standard method was demonstrated on a 3 T scanner for a large range of T1 values from 200 to 1600 ms (mean percentage difference: 5.6%). Similar results were also obtained from phantom experiments performed on a 1.5 T system with R = 4 (Figure 2d; mean percentage difference: 4.6%).
Figure 2.
T1 maps of multi-compartment phantoms acquired using (a) inversion-recovery single-echo spin echo (TR: 6s) and (b) inversion-recovery stack-of-spirals method at 3 T. Comparison of T1 values from the two methods acquired at 3 T (c) and 1.5 T (d).
Figure 3 shows the results of the Bloch equation simulation to optimize the time delay between different segments. Two representative signal evolution curves simulated for two tissues with T1 values of 600 and 1400 ms are shown in Figure 3a. For both cases, the magnetization along the z axis reaches nearly full recovery by the end of the 5-s time delay (~100% for T1 of 600 ms and 98% for T1 of 1400 ms). With a shorter time delay of 3.5 s, the longitudinal magnetization for the T1 of 600 ms is fully recovered (~99.9%). Even for the long T1 of 1400 ms which is close to that of blood at 1.5 T, approximately 94.3% of the magnetization is recovered in 3.5 s. Figure 3b shows the effect of this incomplete recovery time on the accuracy of T1 estimation. The results indicate that for T1 less than 1380 ms, the error of T1 quantification induced by the reduced time delay of 3.5 s is less than 5%, which is acceptable for most physiological T1 values in abdomen at 1.5 T. For the T1 measurement at 3 T, this time delay was increased to 4 s to ensure a maximum error of 5% for any tissue with T1 up to 1620 ms (Figure 3b).
Figure 3.
Optimization of the length of time delay using Bloch equation simulation. (a) Signal evolution curves for two types of tissues with different T1 relaxation times of 600 and 1400 ms. Even for the tissue with a long T1 value of 1400 ms, 94.3% of the signal has recovered back at the end of 3.5-s time delay. (b) Percentage error of simulated T1 values as compared to the theoretical T1 values for different time delays from 3.0 s to 5.0 s. Delays of 3.5 s and 4.0 s induce a maximum error of 5% with T1 up to 1380 ms and 1620 ms, respectively.
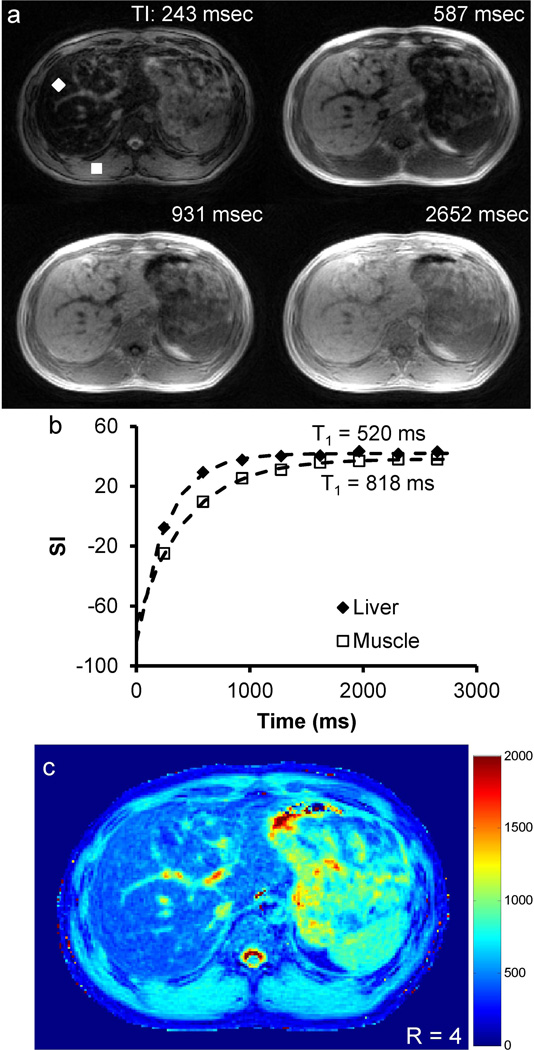
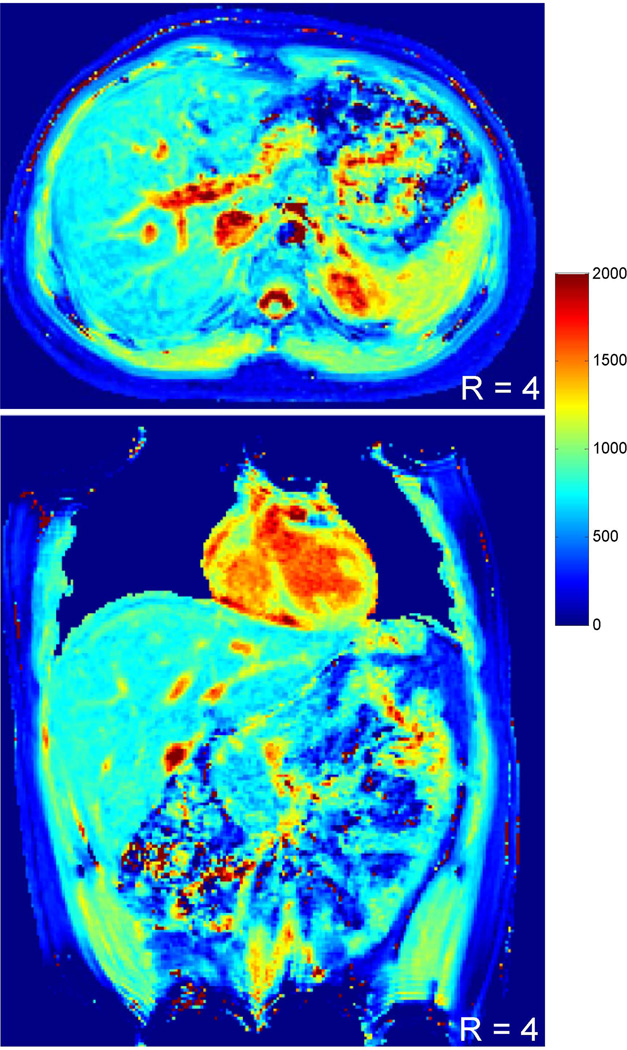
Representative in vivo T1 maps acquired from a 1.5 T scanner with R = 4 and time delay of 3.5 s are shown in Figure 4. Four of the eight T1-weighted images acquired along the inversion recovery curve from the same slice are displayed (Figure 4a). Figure 4b shows the time courses of signal intensity from single voxels of both liver tissue and skeletal muscle. The data fit well to the three-parameter model (R2 = 0.997 and 0.999 for liver and skeletal muscle, respectively) and the T1 values are also in good agreement with the literature values (19, 20). The corresponding T1 map for this slice is shown in Figure 4c, which demonstrates that high-resolution T1 maps from the abdomen can be obtained using the proposed fast imaging method.
Figure 4.
Representative axial T1 map obtained at 1.5 T. (a) T1-weighted images of one slice at four different inversion times (243, 587, 931 and 2652 ms). (b) Single-voxel measured and fitted data for both liver tissue (diamond) and muscle (square) as indicated in (a). (c) Corresponding T1 map for this slice.
Quantitative 3D T1 maps were further measured on a 3 T scanner using a similar protocol (R = 4) with an increased time delay of 4 s. Figure 5 shows representative T1 maps in both axial and coronal views acquired from the same subject. A close match in T1 values from multiple organs (liver, 755±31 ms vs. 766±19 ms; spleen, 1119±73 ms vs. 1125±64 ms; kidney-medulla, 1733±95 ms vs. 1706±158 ms; kidney-cortex, 1208±73 ms vs. 1194±82 ms) were observed from the two maps (axial vs. coronal), which demonstrates the applicability of the proposed method in both orientations.
Figure 5.
Representative T1 maps in both axial and coronal views acquired from the same subject at 3 T with the reduction factor of 4.
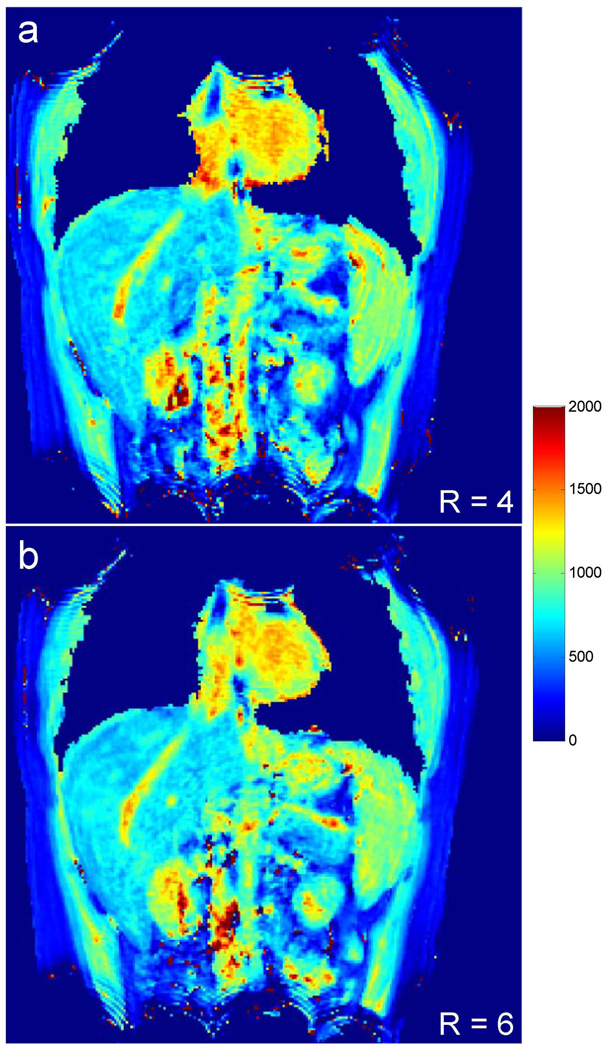
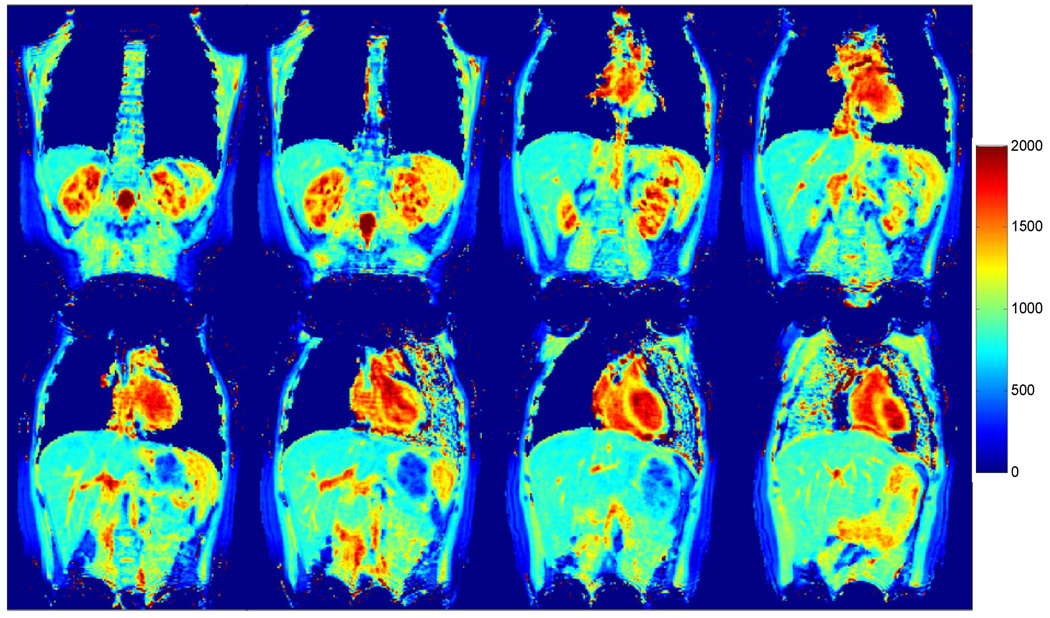
To take advantage of the larger number of receive channels on the 3 T system, a higher reduction factor of 6 was tested to accelerate the T1 mapping method. Figure 6 a, b show the results acquired from the same location of a subject with reduction factors of 4 and 6, respectively. The acquisition time for the same 32 slices was reduced from 23 s to only 17 s with the higher reduction factor and a close match in T1 values was observed between the two different reduction factors (liver, 775±53 ms vs. 808±71 ms; spleen, 1033±41 ms vs. 1073±47 ms; kidney-medulla, 1526±140 ms vs. 1515±88 ms; kidney-cortex, 1150±52 ms vs. 1162±107 ms for R = 4 vs. R = 6). A set of eight out of 32 coronal slices of a T1 map obtained from a single scan at 3 T (R = 6) are shown in Figure 7. Average T1 values of multiple organs and tissues from the 35 subjects measured at both 1.5 T and 3 T systems are summarized in Table 2. The effect of noise on T1 accuracy was performed using a bootstrapped Monte Carlo simulation. The standard deviation of T1 estimation was 5.1 ms for liver, 3.5 ms for spleen, 3.8 ms for renal medulla and 3.9 ms for renal cortex. The measurement error due to noise is 12–27 times smaller compared to the physiological variations seen in these tissues (Table 2).
Figure 6.
Comparison of T1 maps acquired with different reduction factors of 4 (a) and 6 (b) from the same subject at 3 T. High-quality T1 maps were observed for both cases, while the acquisition time was reduced from 23 s to only 17 s with the higher reduction factor.
Figure 7.
Representative T1 maps from eight out of 32 slices of the same subject acquired at 3 T (R = 6).
Table 2.
Average T1 relaxation times of multiple abdominal tissues at both 1.5 T and 3 T.
| Tissue | 1.5 T |
3 T |
||
|---|---|---|---|---|
| This study | Literature* | This study | Literature* | |
| Liver | 544 ± 56 | 490 ~ 580 | 824 ± 61 | ~ 810 |
| Kidney – Medulla | 1381 ± 95 | 1320 ~ 1412 | 1610 ± 55 | ~ 1545 |
| Kidney – Cortex | 827 ± 50 | 690 ~ 1057 | 1194 ± 88 | ~ 1142 |
| Spleen | 993 ± 74 | 1026 ~ 1057 | 1251 ± 95 | ~ 1328 |
| Skeletal muscle | 810 ± 39 | 856 ~ 1008 | 1017 ± 78 | 898 ~ 1412 |
| Fat | 273 ± 34 | 260 ~ 343 | 307 ± 37 | ~ 382 |
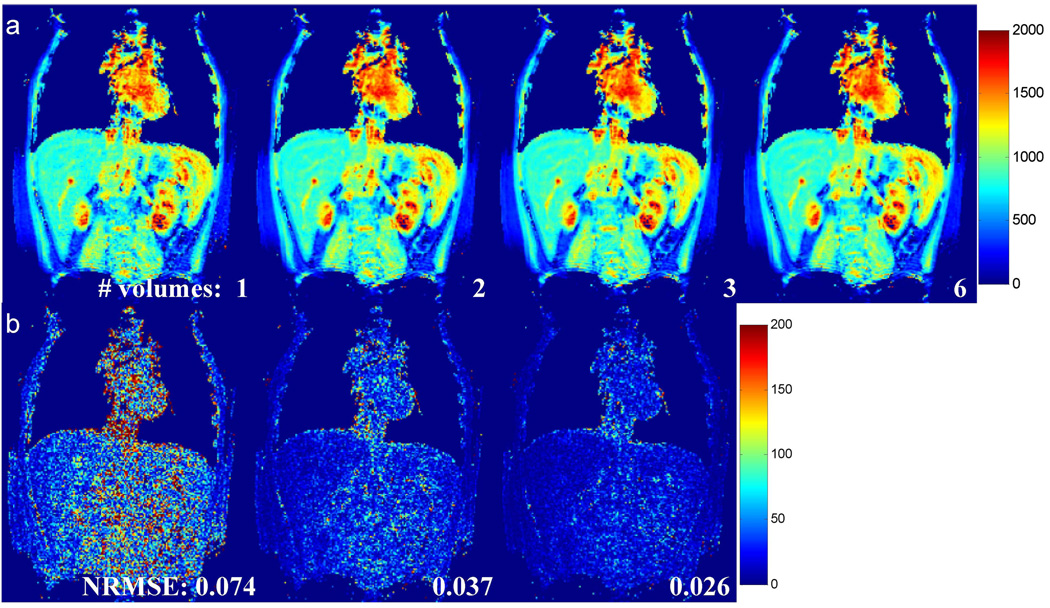
The effect of the size of calibration data on T1 accuracy was evaluated using an in vivo dataset acquired at 3 T with R = 6. Figure 8(a) shows the T1 maps obtained from the same undersampled dataset reconstructed using different amount of calibration data. The T1 map obtained using all six volumes in the calibration is shown on the right column as a reference. Difference maps as compared to this reference are presented in Figure 8(b). The results demonstrate that increasing the amount of calibration data from one fully sampled 3D volume to five volumes improved the image quality and decreased the NRMSE monotonically from 7.4% to 1.4%. In particular, when employing two 3D volumes as the calibration data (second column in Figure 8), the NRMSE is already below 4% and the visual appearance of the T1 map is extremely similar to the reference map.
Figure 8.
Effect of the size of calibration data on T1 accuracy. (a) From left to right, T1 maps obtained using GRAPPA weights calculated from 1, 2, 3, and 6 fully sampled 3D volumes. The T1 map obtained using all 6 volumes was used as a reference. (b) Difference maps as compared to the reference. The NRMSE with respect to the reference map is given at the bottom of each map.
DISCUSSION
A technique for single breath-hold 3D abdominal T1 mapping was developed by combining the Look-Locker method with non-Cartesian parallel imaging. The accuracy of T1 measurement was first verified in a phantom on both 1.5 T and 3 T scanners. The technique was then applied to 35 volunteers and the in vivo results demonstrated that high-resolution 3D T1 maps (2×2×4 mm3) for 32 slices can be achieved in a single clinically feasible breath-hold of ~20 s. All measurements from both 1.5 T and 3 T systems are in agreement with the literature (2, 19, 20, 26, 27).
The Look-Locker method has been widely applied for quantification of T1 relaxation times due to its high efficiency and accuracy. Besides the traditional 2D Look-Locker method, Henderson and the co-authors have also proposed a segmented 3D Look-Locker method (6) and several variants have been developed for better efficiency and accuracy (9, 28, 29). Even though the Look-Locker method is considered a fast T1 mapping technique as compared to the inversion-recovery spin-echo method, when combined with 3D Cartesian encoding, it still requires several minutes for volumetric T1 measurements of 20~30 slices. Therefore, these 3D techniques have only been applied to T1 mapping of stationary tissues. This work demonstrated that higher scan efficiency can be achieved with the Look-Locker method when combined with a spiral trajectory and non-Cartesian parallel imaging techniques. While the focus of this study is abdominal imaging, the proposed technique could potentially be applied to volumetric T1 mapping of other moving organs, such as the heart.
Over the past decade, non-Cartesian parallel imaging has shown great potential in improving image acquisition speed and thus many different techniques have been proposed (30–32). Compared to the conventional Cartesian parallel imaging methods, these non-Cartesian techniques not only offer the opportunity to sample k-space more efficiently, but also are more tolerant to aliasing artifacts at high undersampling rates. In this study, the through-time non-Cartesian GRAPPA acceleration technique was utilized to accelerate the data acquisition (16, 23). This technique was first introduced for fast cardiac imaging with both radial and spiral trajectories (15, 31). Compared to the method with a radial trajectory, through-time spiral GRAPPA can provide higher scan efficiency and thus was chosen for this study (15). Besides application in breath-held abdominal T1 mapping, the technique has also been applied to free-breathing liver perfusion imaging and whole-heart cardiac imaging (14, 33).
As mentioned above, high reduction factors can be achieved with non-Cartesian parallel imaging as compared to Cartesian encoding. In this study, a high reduction factor of R = 6 was successfully applied on the 3 T system using up to 34 receive channels. Experiments with higher reduction factors were also tested on the same scanner (R = 8 & 12) but resulted in residual aliasing in the reconstructed images (data not shown). A previous study has demonstrated a successful acceleration with R = 12 for 2D cardiac imaging using the through-time spiral GRAPPA technique (15). The difference in the maximal achievable reduction factor between these studies is likely due to the inherent high SNR with cardiac imaging as compared to abdominal imaging. The balanced steady-state free precession (bSSFP) sequence used for cardiac imaging is also known to provide higher SNR as compared to the spoiled gradient echo sequence utilized in this study. However, the bSSFP sequence is extremely sensitive to magnetic field inhomogeneities and thus not optimal for high-field abdominal imaging.
To reconstruct undersampled data using the through-time spiral GRAPPA technique, a calibration scan was performed to calculate GRAPPA weights. As in the traditional Cartesian GRAPPA technique, the GRAPPA weights are determined by coil sensitivities and do not vary with the types of pulse sequences used to generate the calibration data. Thus a standard spoiled gradient echo sequence was used in the calibration scan to calculate GRAPPA weights. Even though this separate scan added additional scan time for the subjects (~40 s), the calibration scan was acquired with the subject completely free breathing. It is important to note that the use of six fully sampled 3D volumes acquired for the calibration scan in the current study was conservative. This number was chosen to ensure a reliable T1 mapping with accurate GRAPPA weight calibration. Our initial optimization results shown in Figure 8 suggest that even with only two fully sampled volumes for GRAPPA weight calibration, the NRMSE for T1 map was less than 5% relative to the case with six fully sampled volumes and no visual difference was observed in the map. This indicates that the time for the calibration scan can be reduced to ~13 s without a deleterious effect on T1 map quality. While fully sampled 3D volumes were utilized to optimize the calibration scan as a first step, a previous study has suggested that a partially sampled dataset with only central k-space slices acquired may provide a better option with improved accuracy and efficiency (23). While a rigorous evaluation is out of the scope of this study, further works will be performed in the future to explore different combinations of encoding slices and repetitions in the calibration scan for through-time spiral GRAPPA reconstruction.
To achieve volumetric coverage with 32 slices, a segmented k-space acquisition was used in this study and a time delay was applied between segments for a full longitudinal relaxation. To minimize this time delay without sacrificing the accuracy of T1 measurement, Bloch equation simulations were performed and a time delay was chosen to limit the quantification error to less than 5% for tissues with T1 up to 1380 ms at 1.5 T and up to 1620 ms at 3 T. According to the literature reported values and our results from in vivo measurements (Table 2), this covers encountered T1 values in the abdomen. With the exception of renal medulla, most tissues in the abdomen actually have significantly shorter T1 (<1000 ms at 1.5 T and <1250 ms at 3 T) (Table 2), and the error induced by the selected delay is less than 2.5% (Figure 3b).
One limitation of this study is the lack of patient data. More experiments are required to validate the performance of the proposed method in the clinical setting, with various pathologies. Additionally, 32 slices with 4-mm slice thickness were acquired in this study, which was sufficient to measure T1 relaxation times from most organs in the abdomen. Further acceleration in the through-plane direction can be explored using Cartesian GRAPPA to achieve higher spatial resolution or better coverage with more slices. With the proposed 3D T1 mapping technique, the total breath-hold time is approximately 20 s, which is feasible for most patients, but is still too long for a subset of patients who may not be able to tolerate a 20 s respiration free period. A straight-forward solution to this problem would be shortening the breath-hold farther by applying Cartesian GRAPPA acceleration in the through-plane direction. This approach could readily yield a further two-fold acceleration and has been applied for cardiac imaging (34). Another strategy that could be utilized is that the 32-slice acquisition could be separated into two 16 slice acquisitions (or 20 with overlap). Finally, a limitation of any non-Cartesian imaging is long reconstruction time. The reconstruction times reported here (approximately 4 min/volume using Matlab and CPUs) are long for routine clinical practice. However, it has been shown that the computation times for the clinical setting for non-Cartesian through-time GRAPPA reconstructions can be significantly shorted using C++ and GPUs, to the order of ~30 s per volume (35). This approach can be readily utilized for clinical imaging.
In conclusion, a high resolution 3D abdominal T1 mapping technique was developed using the Look-Locker method, an undersampled stack-of-spirals trajectory and through-time spiral GRAPPA reconstruction. This technique allows fast and accurate T1 mapping of multiple abdominal organs and tissues in a single breath-hold of ~20 s.
Acknowledgments
Grant Support: Siemens Healthcare and NIH grants 1R01DK098503, 5R01HL094557, R00EB011527, and 2KL2TR000440.
REFERENCES
- 1.Kim KA, Park M-S, Kim I-S, Kiefer B, Chung W-S, Kim M-J, Kim KW. Quantitative evaluation of liver cirrhosis using T1 relaxation time with 3 tesla MRI before and after oxygen inhalation. J Magn Reson Imaging. 2012;36:405–410. doi: 10.1002/jmri.23620. [DOI] [PubMed] [Google Scholar]
- 2.Huang Y, Sadowski EA, Artz NS, Seo S, Djamali A, Grist TM, Fain SB. Measurement and comparison of T1 relaxation times in native and transplanted kidney cortex and medulla. J Magn Reson Imaging. 2011;33:1241–1247. doi: 10.1002/jmri.22543. [DOI] [PMC free article] [PubMed] [Google Scholar]
- 3.O’Connor JPB, Jackson A, Buonaccorsi GA, et al. Organ-specific effects of oxygen and carbogen gas inhalation on tissue longitudinal relaxation times. Magn Reson Med. 2007;58:490–496. doi: 10.1002/mrm.21357. [DOI] [PubMed] [Google Scholar]
- 4.Sourbron S. Technical aspects of MR perfusion. Eur J Radiol. 2010;76:304–313. doi: 10.1016/j.ejrad.2010.02.017. [DOI] [PubMed] [Google Scholar]
- 5.Kimelman T, Vu A, Storey P, McKenzie C, Burstein D, Prasad P. Three-dimensional T1 mapping for dGEMRIC at 3.0 T using the Look Locker method. Invest Radiol. 2006;41:198–203. doi: 10.1097/01.rli.0000195842.49255.ea. [DOI] [PubMed] [Google Scholar]
- 6.Henderson E, McKinnon G, Lee TY, Rutt BK. A fast 3D look-locker method for volumetric T1 mapping. Magn Reson Imaging. 1999;17:1163–1171. doi: 10.1016/s0730-725x(99)00025-9. [DOI] [PubMed] [Google Scholar]
- 7.Steinhoff S, Zaitsev M, Zilles K, Shah NJ. Fast T1 mapping with volume coverage. Magn Reson Med. 2001;46:131–140. doi: 10.1002/mrm.1168. [DOI] [PubMed] [Google Scholar]
- 8.Deichmann R. Fast high-resolution T1 mapping of the human brain. Magn Reson Med. 2005;54:20–27. doi: 10.1002/mrm.20552. [DOI] [PubMed] [Google Scholar]
- 9.Shin W, Gu H, Yang Y. Fast high-resolution T1 mapping using inversion-recovery Look-Locker echo-planar imaging at steady state: optimization for accuracy and reliability. Magn Reson Med. 2009;61:899–906. doi: 10.1002/mrm.21836. [DOI] [PMC free article] [PubMed] [Google Scholar]
- 10.Koh TS, Thng CH, Lee PS, Hartono S, Rumpel H, Goh BC, Bisdas S. Hepatic metastases: in vivo assessment of perfusion parameters at dynamic contrast-enhanced MR imaging with dual-input two-compartment tracer kinetics model. Radiology. 2008;249:307–320. doi: 10.1148/radiol.2483071958. [DOI] [PubMed] [Google Scholar]
- 11.Treier R, Steingoetter A, Fried M, Schwizer W, Boesiger P. Optimized and combined T1 and B1 mapping technique for fast and accurate T1 quantification in contrast-enhanced abdominal MRI. Magn Reson Med. 2007;57:568–576. doi: 10.1002/mrm.21177. [DOI] [PubMed] [Google Scholar]
- 12.Look DC, Locker D. Time saving in measurement of NMR and EPR relaxation times. Rev Sci Instrum. 1970;41:250. [Google Scholar]
- 13.Li W, Griswold M, Yu X. Rapid T1 mapping of mouse myocardium with saturation recovery Look-Locker method. Magn Reson Med. 2010;64:1296–1303. doi: 10.1002/mrm.22544. [DOI] [PMC free article] [PubMed] [Google Scholar]
- 14.Chen Y, Lee GR, Wright KL, Griswold MA, Seiberlich N, Gulani V. 3D high spatiotemporal resolution quantitative liver perfusion imaging using a stack-of-spirals acquisition and through-time non-Cartesian GRAPPA acceleration; Proc 21th Annu Meet Int Soc Magn Reson Med; 2013. p. 601. [Google Scholar]
- 15.Seiberlich N, Lee G, Ehses P, Duerk JL, Gilkeson R, Griswold M. Improved temporal resolution in cardiac imaging using through-time spiral GRAPPA. Magn Reson Med. 2011;66:1682–1688. doi: 10.1002/mrm.22952. [DOI] [PMC free article] [PubMed] [Google Scholar]
- 16.Wright KL, Hamilton JI, Griswold MA, Gulani V, Seiberlich N. Non-Cartesian parallel imaging reconstruction. J Magn Reson Imaging. 2014;40:1022–1040. doi: 10.1002/jmri.24521. [DOI] [PMC free article] [PubMed] [Google Scholar]
- 17.Duyn JH, Yang Y, Frank JA, van der Veen JW. Simple correction method for k-space trajectory deviations in MRI. J Magn Reson. 1998;132:150–153. doi: 10.1006/jmre.1998.1396. [DOI] [PubMed] [Google Scholar]
- 18.Jakob PM, Hillenbrand CM, Wang T, Schultz G, Hahn D, Haase A. Rapid quantitative lung 1H T1 mapping. J Magn Reson Imaging. 2001;14:795–799. doi: 10.1002/jmri.10024. [DOI] [PubMed] [Google Scholar]
- 19.De Bazelaire CMJ, Duhamel GD, Rofsky NM, Alsop DC. MR imaging relaxation times of abdominal and pelvic tissues measured in vivo at 3.0 T: preliminary results. Radiology. 2004;230:652–659. doi: 10.1148/radiol.2303021331. [DOI] [PubMed] [Google Scholar]
- 20.Stanisz GJ, Odrobina EE, Pun J, Escaravage M, Graham SJ, Bronskill MJ, Henkelman RM. T1, T2 relaxation and magnetization transfer in tissue at 3T. Magn Reson Med. 2005;54:507–512. doi: 10.1002/mrm.20605. [DOI] [PubMed] [Google Scholar]
- 21.Karlsson M, Nordell B. Phantom and in vivo study of the Look-Locher T1 mapping method. Magn Reson Imaging. 1999;17:1481–1488. doi: 10.1016/s0730-725x(99)00078-8. [DOI] [PubMed] [Google Scholar]
- 22.Wright KL, Chen Y, Saybasili H, Griswold MA, Seiberlich N, Gulani V. Quantitative high-resolution renal perfusion imaging using 3-dimensional through-time radial generalized autocalibrating partially parallel acquisition. Invest Radiol. 2014;49:666–674. doi: 10.1097/RLI.0000000000000070. [DOI] [PMC free article] [PubMed] [Google Scholar]
- 23.Wright K, Lee G, Ehses P, Griswold M, Gulani V, Seiberlich N. Three-dimensional through-time radial GRAPPA for renal MR angiography. J Magn Reson Imaging. 2014;40:864–874. doi: 10.1002/jmri.24439. [DOI] [PMC free article] [PubMed] [Google Scholar]
- 24.Fessler JA. On NUFFT-based gridding for non-Cartesian MRI. J Magn Reson. 2007;188:191–195. doi: 10.1016/j.jmr.2007.06.012. [DOI] [PMC free article] [PubMed] [Google Scholar]
- 25.Riffe M, Blaimer M, Barkauskas KJ, Duerk JL, Griswold MA. SNR estimation in fast dynamic imaging using bootstrapped statistics; Proc 15th Annu Meet Int Soc Magn Reson Med; 2007. p. 1879. [Google Scholar]
- 26.Bernstein MA, King KE, Zhou XJ. Handbook of MRI Pulse Sequences. Elsevier Academic Press; 2004. [Google Scholar]
- 27.Blüml S, Schad LR, Stepanow B, Lorenz WJ. Spin-lattice relaxation time measurement by means of a TurboFLASH technique. Magn Reson Med. 1993;30:289–295. doi: 10.1002/mrm.1910300304. [DOI] [PubMed] [Google Scholar]
- 28.Gai ND, Butman JA. Modulated repetition time look-locker (MORTLL): A method for rapid high resolution three-dimensional T1 mapping. J Magn Reson Imaging. 2009;30:640–648. doi: 10.1002/jmri.21842. [DOI] [PMC free article] [PubMed] [Google Scholar]
- 29.Hui C, Esparza-Coss E, Narayana PA. Improved three-dimensional Look-Locker acquisition scheme and angle map filtering procedure for T1 estimation. NMR Biomed. 2013;26:1420–1430. doi: 10.1002/nbm.2969. [DOI] [PMC free article] [PubMed] [Google Scholar]
- 30.Lustig M, Pauly JM. SPIRiT: Iterative self-consistent parallel imaging reconstruction from arbitrary k-space. Magn Reson Med. 2010;64:457–471. doi: 10.1002/mrm.22428. [DOI] [PMC free article] [PubMed] [Google Scholar]
- 31.Seiberlich N, Ehses P, Duerk J, Gilkeson R, Griswold M. Improved radial GRAPPA calibration for real-time free-breathing cardiac imaging. Magn Reson Med. 2011;65:492–505. doi: 10.1002/mrm.22618. [DOI] [PMC free article] [PubMed] [Google Scholar]
- 32.Pruessmann KP, Weiger M, Börnert P, Boesiger P. Advances in sensitivity encoding with arbitrary k-space trajectories. Magn Reson Med. 2001;46:638–651. doi: 10.1002/mrm.1241. [DOI] [PubMed] [Google Scholar]
- 33.Barkauskas KJ, Rajiah P, Ashwath R, Hamilton JI, Chen Y, Ma D, Wright KL, Gulani V, Griswold MA, Seiberlich N. Quantification of left ventricular functional parameter values using 3D spiral bSSFP and through-time Non-Cartesian GRAPPA. J Cardiovasc Magn Reson. 2014;16:65. doi: 10.1186/s12968-014-0065-1. [DOI] [PMC free article] [PubMed] [Google Scholar]
- 34.Barkauskas KJ, Hamilton JI, Chen Y, Ma D, Wright KL, Lo W, Rajiah P, Gulani V, Griswold MA, Seiberlich N. Isotropic cardiac MR functional imaging with 3D variable density spiral and non-Cartesian through-time GRAPPA; Proc 22th Annu Meet Int Soc Magn Reson Med; 2014. p. 427. [Google Scholar]
- 35.Saybasili H, Herzka DA, Seiberlich N, Griswold MA. Real-time imaging with radial GRAPPA: Implementation on a heterogeneous architecture for low-latency reconstructions. Magn Reson Imaging. 2014;32:747–758. doi: 10.1016/j.mri.2014.02.022. [DOI] [PMC free article] [PubMed] [Google Scholar]


