Abstract
AIM
To correlate corneal variables (determined using the Pentacam) with optic nerve head (ONH) variables determined using the Heidelberg retina tomograph (HRT) in healthy subjects and patients diagnosed with primary open angle glaucoma (POAG).
METHODS
Measurements were made in 75 healthy eyes and 73 eyes with POAG and correlations examined through Pearson correlation coefficients between the two sets of variables in the two subject groups. The corneal variables determined were corneal volume (CVol), central corneal thickness (CCT), overall corneal thickness (OvCT), the mean thickness of a circular zone centered at the corneal apex of 1 mm radius (zone I) and the mean thickness of several concentric rings, also centered at the apex until the limbus, each of 1 mm width (zones II to VI respectively). The ONH variables were determined using the HRT.
RESULTS
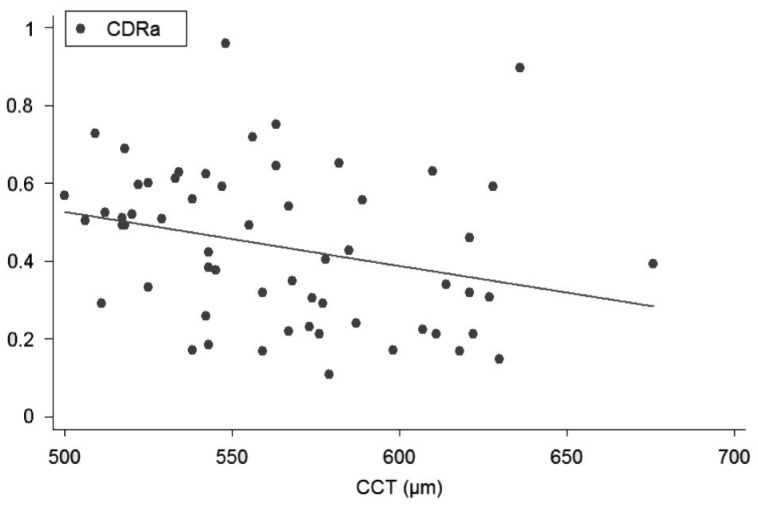
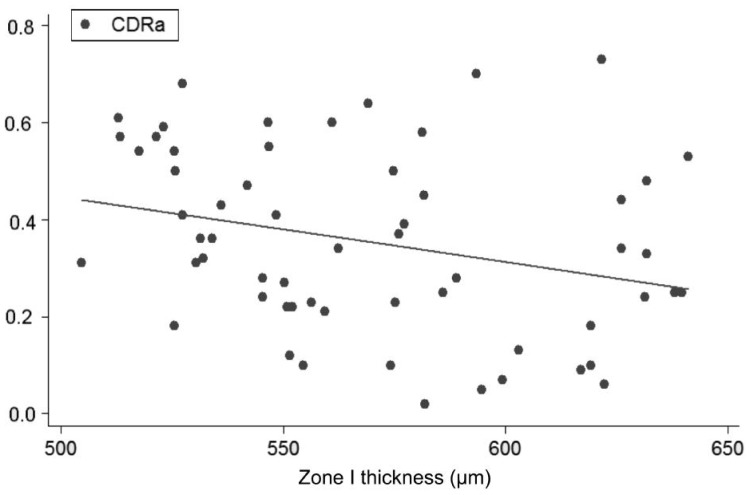
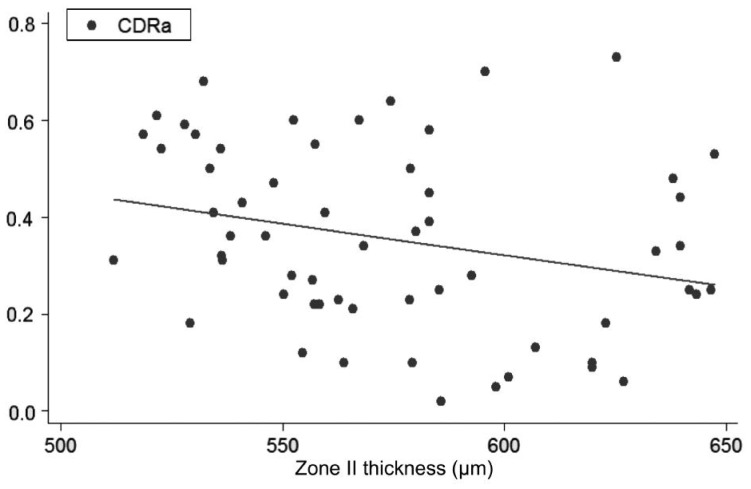
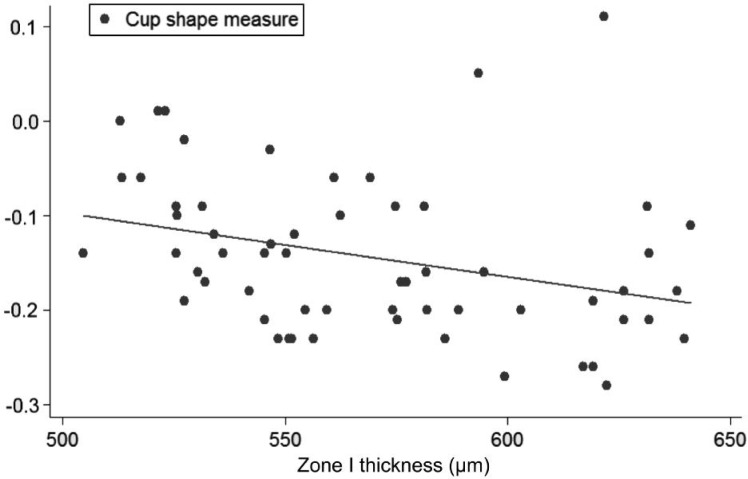
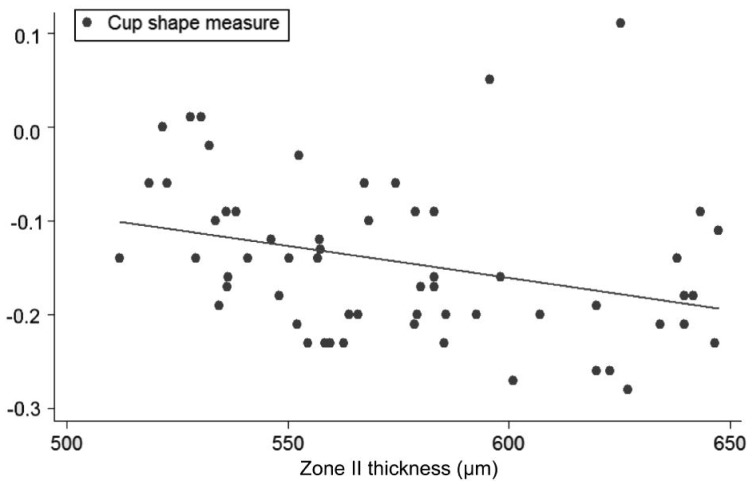
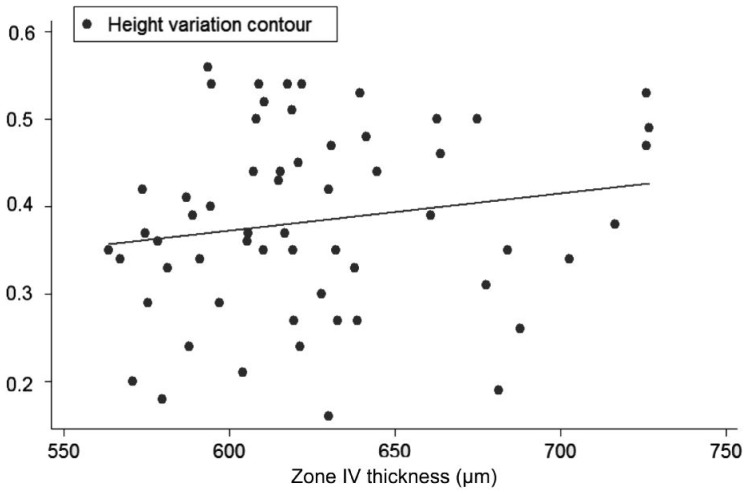
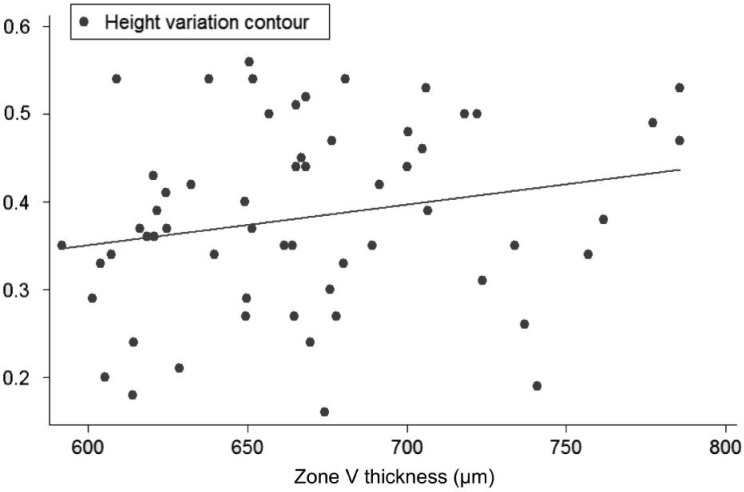
The following pairs of variables were correlated in the control group: CCT-disc area (DAr) (-0.48; P<0.0001), Zone I-DAr (-0.503; P<0.0001) and Zone II-DAr (-0.443; P<0.0001); and in the POAG group: CCT-cup-to-disc area ratio (CDRa) (-0.402; P<0.0001), Zone I-CDRa (-0.418; P<0.0001), Zone II-CDRa (-0.405; P=0.006), Zone I-cup shape measure (CSM) (-0.415; P=0.002), Zone II-CSM (-0.405; P=0.001), Zone IV-height variation contour (HVC) (0.378; P=0.002); Zone V-HVC (0.388, P<0.0001).
CONCLUSIONS
In the healthy subjects, significant negative correlation was detected between central and paracentral corneal thickness and optic disc area. In contrast, the POAG patients showed significant negative correlation between central and paracentral corneal thickness and the cup-disc ratio and CSM, and positive correlation between peripheral corneal thickness and HVC.
Keywords: glaucoma, optic nerve head, corneal thickness
INTRODUCTION
Primary open angle glaucoma (POAG) is defined as an optic neuropathy of multifactorial origin whose main characteristic feature is optic nerve head (ONH) damage due to a loss of ganglion cells[1]. Although the main known risk factor for disease onset and progression is elevated intraocular pressure (IOP)[2]–[6], reports exist of a link between corneal properties, such as corneal thickness, and susceptibility to glaucoma[7]–[16]. In effect, reduced central corneal thickness (CCT) is regarded as a risk factor for the development and progression of POAG[8],[9]. Many studies have reported that thinner corneas may lead to underestimated IOP, and for thicker corneas, IOP may be overestimated[11]–[13]. However, the effect of CCT on IOP readings alone seems insufficient to explain the increased susceptibility to glaucoma detected in individuals with thinner corneas[7]. In the Ocular Hypertension Treatment Study, a low CCT value was identified as a risk factor for conversion of patients with ocular hypertension to POAG, after statistical correction for IOP and other risk factors[7],[14].
Based on the important role of corneal thickness in glaucoma, in prior work we reported that a model based on corneal thickness measurements that partitioned the corneal surface into 1 mm-diameter concentric rings centered at the apex showed some capacity to discriminate between healthy eyes and eyes with POAG[17]. Moreover, we observed that some zones of this model had an impact on IOP measurements determined both by Goldmann applanation tonometer (GAT) and dynamic contour tonometry (DCT) in a group of healthy subjects[18].
This study was designed to examine correlations between CCT and the mean thicknesses of the zones defined in our corneal partitioning model[17],[18], and morphometric ONH variables determined using the Heidelberg retina tomograph (HRT).
SUBJECTS AND METHODS
We performed a cross-sectional study in healthy volunteers and patients with POAG. The patients were recruited from the Glaucoma Unit of the Hospital Clinico San Carlos, Madrid (Spain) and control subjects among hospital staff and patients' companions though no patient consanguineous relatives were included. The study protocol was approved by our Institution's Review Board and complied with the guidelines of the Declaration of Helsinki. Informed consent was obtained from each participant before inclusion in the study. All the study participants were Caucasian. Eyes were considered to be glaucomatous if they had shown abnormal results in at least two consecutive visual field exams (Octopus TOP-G1X) and if there was evidence of glaucomatous damage, as determined by the appearance of the ONH. The glaucoma patients were required to show gonioscopic evidence of an open angle. Subjects with non-POAG (e.g. pseudoexfoliation, pigment dispersion, neovascularization) were excluded. It was checked that control subjects had an IOP <21 mm Hg, a normal visual field and a non-glaucomatous appearing optic disc, so glaucoma suspects were discharged.
General exclusion criteria were: a spherical equivalent greater than 5 diopters, or 3 or more diopters of astigmatism, a best corrected visual acuity worse than 20/25, opacities in the cornea or lens impairing ONH visualization and alterations in ONH morphology, such as oblique discs or peripapillary atrophy. We also excluded subjects who had undergone prior eye surgery and those whose visual field defects were of causes other than glaucoma (e.g. demyelinating disease, non-glaucomatous neuropathy or a central nervous system disorder). If both eyes of a patient or subject fulfilled all the inclusion and exclusion criteria, the eye to be studied was selected through an automatic randomisation procedure (www.randomization.com).
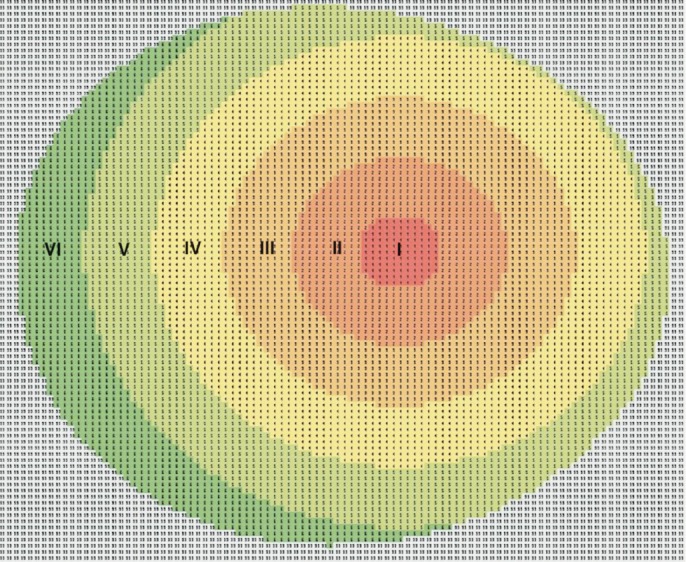
All the study participants underwent a Pentacam (Pentacam, Oculus USA) examination and the ONH was examined using the HRT (Heidelberg, Germany). Using the pachymetric maps generated by the Pentacam (this instrument makes thickness measurements across the entire cornea perpendicular to its surface separated by a distance of 1 μm), we divided the cornea into a central circular zone of radius 1 mm (designated zone I) centered at the corneal apex (this is the point of maximum curvature or height, typically temporal to the centre of the pupil) and several concentric rings of 1 mm width each with the same centre (5 rings until the corneal limbus denoted zones II, III, IV, V and VI respectively moving outward from the centre) (Figure 1). Apart from the mean thicknesses of zones I to VI, corneal volume (CVol), overall corneal thickness (OvCT) and CCT were also recorded for each eye. The ONH variables determined using the HRT were disc area (DAr), cup area (CAr), rim area (RAr), cup to disc area ratio (CDRa), cup volume (CuVol), rim volume (RVol), mean cup depth (MCD), maximum cup depth (MaCD), height variation contour (HVC), cup shape measure (CSM), mean retinal nerve fibre layer (RNFL) thickness (MRNFL), RNFL cross sectional area (RNFLAr), maximum contour elevation (MCEle) and minimum contour depression (MCDep).
Figure 1. Corneal partitioning model (example of a left eye).
Pearson correlations (ρ) between the set of corneal variables and the set of ONH variables were determined in the healthy and glaucomatous eyes. According to the number of comparisons to be made a Bonferroni correction to the level of statistical signification was applied, though, the level required was fixed at P<0.0004.
Sample size was calculated (for both healthy and glaucomatous eyes) to detect a Pearson correlation coefficient (ρ) of 0.35 or higher assuming a β risk of 20% and α risk of 5%.
Combining both samples, several univariate linear regression models were constructed to determine the influence of each corneal variable (as predictors) on each ONH variable (as dependant variables), adjusting this influence by DAr. The power of each univariate linear regression model was established a posteriori (assuming an α risk of 5%).
RESULTS
Assuming a β risk of 20% and α risk of 5% to detect a ρ of 0.35, we calculated the need for a sample size of 62 eyes per group. This requirement was thus fulfilled by the 75 healthy eyes (power: 87.3%) and 73 glaucomatous eyes (power: 86.4%) included in the study.
The means and standard deviations of the variables determined are provided in Table 1.
Table 1. Means and standard deviations of the variables analyzed.
| Variables | Healthy eyes |
POAG eyes |
||
| Mean | St. Dev | Mean | St. Dev | |
| Disc area (mm2) | 10.99 | 0.49 | 20.19 | 0.51 |
| Cup area (mm2) | 0.67 | 0.49 | 1101 | 0.51 |
| Rim area (mm2) | 1.45 | 0.37 | 1.14 | 0.29 |
| Cup-to-disc ratio | 0.34 | 0.17 | 0.5 | 0.18 |
| Cup volume (mm3) | 0.15 | 0.16 | 0.24 | 0.26 |
| Rim volume (mm3) | 0.38 | 0.17 | 0.25 | 0.14 |
| Mean cup depth (mm) | 0.23 | 0.08 | 0.3 | 0.13 |
| Maximum cup dephth (mm) | 0.63 | 0.18 | 0.73 | 0.25 |
| Height variation contour (mm) | 0.41 | 0.11 | 0.36 | 0.1 |
| Cup shape measure | -0.17 | 0.07 | -79 | 0.09 |
| Mean RNFL thickness (mm) | 0.22 | 0.1 | 0.18 | 0.09 |
| RNFL cross sectional area | 10.08 | 0.49 | 0.9 | 0.47 |
| Maximum contour elevation | 0.1 | 0.1 | -0.024 | 0.14 |
| Minimum contour depression | 0.31 | 0.12 | 0.33 | 0.15 |
| Corneal volume (mm3) | 32.84 | 18 | 61.1 | 5.73 |
| CCT (µm) | 551 | 310.1 | 539 | 490.2 |
| Overall corneal thickness (µm) | 665 | 310.1 | 629 | 61 |
| Zone I thickness (µm) | 566 | 310.7 | 550 | 460.5 |
| Zone II thickness (µm) | 572 | 300.3 | 557 | 460.8 |
| Zone III thickness (µm) | 590 | 270.6 | 586 | 490.1 |
| Zone IV thickness (µm) | 634 | 260.2 | 619 | 540.9 |
| Zone V thickness (µm) | 671 | 310.9 | 649 | 630.9 |
| Zone VI thickness (µm) | 736 | 430.7 | 708 | 730.3 |
Significant correlations detected were: CCT-DAr (-0.48; P<0.0001), Zone I-DAr (-0.503; P<0.0001), Zone II-DAr (-0.443; P<0.0001) and Zone I-MCD (-0.359; P<0.0001) in the control group and CCT-CDRa (-0.402; P<0.0001), Zone I-CDRa (-0.418; P<0.0001), and Zone V-HVC (0.388, P<0.0001) in the POAG group.
Univariate regression models, constructed to determine the influence of each corneal on each ONH variable, showed the following slopes (B): CCT-CDRa (B=-0.002; P<0.001; no significant effect of DAr; power 95.8%; Figure 2), Zone I-CDRa (B=-0.003; P<0.003; no significant effect of DAr; power 97.2%; Figure 3), Zone II-CDRa (B=-0.002; P=0.004; no significant effect of DAr; power 96.1%; Figure 4), Zone I-CSM (B=-0.01; P=0.028; no significant effect of DAr; power 96.9%; Figure 5), Zone II-CSM (B=-0.05; P=0.009; no significant effect of DAr; power 96.1%; Figure 6), Zone IV-HVC (B=0.001; P=0.02; no significant effect of DAr; power 93%; Figure 7), and Zone V-HVC (B=0.008, P=0.002; no significant effect of DAr; power 94.3%; Figure 8).
Figure 2. Linear regression (predictive variable: CCT; depending variable: CDRa).
Figure 3. Linear regression (predictive variable: Zone I thickness; depending variable: CDRa).
Figure 4. Linear regression (predictive variable: Zone II thickness; depending variable: CDRa).
Figure 5. Linear regression (predictive variable: Zone I thickness; depending variable: CSM).
Figure 6. Linear regression (predictive variable: Zone II thickness; depending variable: CSM).
Figure 7. Linear regression (predictive variable: Zone IV thickness; depending variable: HVC).
Figure 8. Linear regression (predictive variable: Zone V thickness; depending variable: HVC).
DISCUSSION
Although the main known risk factor for glaucoma onset and progression is elevated IOP[2]–[6], reports exist of a link between corneal properties, such as corneal thickness, and susceptibility to glaucoma[7]–[16]. Among the ideas proposed to explain the effect of CCT on the risk of glaucoma development and progression, the hypothesis has been put forward that, irrespective of its effect on IOP, CCT and other corneal variables could determine the structural susceptibility to damage of the optic disc given the anatomical continuity among the cornea, sclera and lamina cribrosa[7],[19]–[24]. Accordingly, several studies have tried to establish a link between corneal thickness and the morphometric characteristics of the ONH though results so far have been contradictory[19]–[24].
Several reports exist of correlations between CCT and optic disc area[20],[21] or nasal rim volume[22] as measured using the HRT in glaucoma patients. Abe et al[23] observed that these correlations did not emerge in health subjects yet these subjects did show significant correlation between CCT and cup volume. In the Bridlington Eye Assessment Project, no significant relationship between CCT and any retinal tomography variable was detected among healthy volunteers[24].
Our approach to this topic differs in that we examined the relationship between optic disc variables and, besides CCT, the mean thicknesses of several ring-shaped zones of the cornea of preestablished size centered at the corneal apex. As far as we are aware, no study has tried to link optic disc variables with the thickness of different corneal zones other than the central zone.
The corneal partitioning model proposed has served to identify factors with some glaucoma risk predictive capacity[17] and the effects of corneal thickness on Goldmann applanation and dynamic contour tonometry[18]. In the present work, besides identifying correlations between corneal factors and ONH measures of known diagnostic capacity for POAG, we also constructed univariate linear regression models to determine the influence of the set of corneal variables on such measures correcting for disc size (DAr). Of course, when DAr itself was correlated with a corneal variable, no such correction was made; as far as we are aware, there is no any hierarchical preeminence from corneal variables over DAr or vice versa; in other words, we cannot suppose that corneal variables could play any predictive role over DAr.
Our observation that central and paracentral corneal thickness measurements were inversely correlated with optic disc area only in our healthy Caucasian subjects is inconsistent with the findings of the Bridlington Eye Assessment Project in which no correlations between CCT and ONH variables were detected in subjects of this same ethnic group[24]. The same was reported in the Singapore Malay Eye Study[7]. Only in the Tajimi Study[23] was weak correlation observed between CCT and cup volume in healthy Japanese volunteers.
Several studies conducted in patients with POAG have shown a link between CCT and DAr[20],[21] and between CCT and rim volume[22] while others have detected negative correlation between CCT and the cup-to-disc ratio and positive correlation between CCT and rim area[7]. Our findings are consistent with the latter but are not limited to CCT in that we were able to negatively correlate the mean thicknesses of corneal Zones I and II with the cup-to-disc ratio and also with CSM. Given that both these ONH variables have been linked to a risk of glaucoma onset and progression[25]–[28], their inverse relationship with both central and paracentral corneal thickness is in agreement with a prior study in which we were able to correlate some of the variables of our corneal partitioning model with an increased risk of POAG[17]. Moreover, we detected significant correlations for the corneal/ONH pairs of variables mentioned above, and noted that, contrary to other reports[7],[20]–[24],[26]–[30] disc size had no impact on these correlations.
No correlation was detected here between our mid-peripheral and peripheral corneal thickness measurements (Zones III-VI) and the ONH variables apart from HVC. In fact, significant positive correlation emerged between peripheral corneal thickness (mean thicknesses of zones IV and V) and this ONH variable. Moreover, our univariate regression models indicated the significant predictive capacity of both these thicknesses for HVC, again with no influence of DAr. HVC is defined as the difference in height between the most elevated and most depressed points of the RNFL along the contour line. This variable tends to decrease when nerve fibre loss is diffuse but increases with the development of a focal nerve fibre defect. Reports in the literature addressing the importance of this stereometric variable in the field of glaucoma have also been contradictory. Larrosa et al[29] found no significant difference in HVC between glaucomatous and healthy eyes yet Uysal et al[28] observed that HVC along with CSM, RVol and CVol, were best able to distinguish between healthy and glaucomatous eyes although this ability was not observed when the sample was stratified by disc size[30].
In conclusion, the results of this study reveal that the relationship between corneal thickness and ONH morphology goes beyond CCT to also include the rest of the cornea. To the best of our knowledge, no such an analysis has been performed before so further studies should be required to confirm our findings and, what is more, to what extent they could be of any clinical interest. Moreover, our study was limited to Caucasian subjects and presents a concrete corneal thickness partitioning method; is still to be established whether other partitioning patterns different to this one could provide better results and whether our findings could be extrapolated to other ethnical groups. To sum up, our results provide direction for future studies designed to examine the effects of CCT and not-CCT on ONH variables.
Acknowledgments
This study has been partially reported on the on 11th European Glaucoma Society Congress (June 2014).
Foundation: Supported in part by Carlos III Health Institute, “Research Cooperative Network. Project RD07/0062: Ocular ageing pathology, visual quality of life”.
This foundation is a public non-profit cooperative organization among many public hospitals in Spain whose aim is to promote research on ocular pathology and its impact on life quality. It belongs to the Spanish Ministry of Economy and Competence (“Ministerio de Economía y Competencia”).
Conflicts of Interest: Saenz-Frances F, None; Jañez L, None; Borrego-Sanz L, None; Berrozpe-Villabona C, None; Martinez-de-la-Casa JM, None; Morales-Fernandez L, None; Garcia-Sanchez J, None; Santos-Bueso E, None; Garcia-Feijoo J, None.
REFERENCE
- 1.Quigley HA. Neuronal death in glaucoma. Prog Retin Eye Res. 1999;18(1):39–57. doi: 10.1016/s1350-9462(98)00014-7. [DOI] [PubMed] [Google Scholar]
- 2.Whitacre MM, Stein R. Sources of error with use of Goldmann-type tonometers. Surv Ophthalmol. 1993;38(1):1–30. doi: 10.1016/0039-6257(93)90053-a. [DOI] [PubMed] [Google Scholar]
- 3.Whitacre MM, Stein RA, Hassanein K. The effect of corneal thickness on applanation tonometry. Am J Ophthalmol. 1993;115(5):592–596. doi: 10.1016/s0002-9394(14)71455-2. [DOI] [PubMed] [Google Scholar]
- 4.Doughty MJ, Zaman ML. Human corneal thickness and its impact on intraocular pressure measures: a review and metaanalysis approach. Surv Ophthalmol. 2000;44(5):367–408. doi: 10.1016/s0039-6257(00)00110-7. [DOI] [PubMed] [Google Scholar]
- 5.Orssengo GJ, Pye DC. Determination of the true intraocular pressure and modulus of elasticity of the human cornea in vivo. Bull Math Biol. 1999;61(3):551–572. doi: 10.1006/bulm.1999.0102. [DOI] [PubMed] [Google Scholar]
- 6.Gunvant P, O'Leary DJ, Baskaran M, Broadway DC, Watkins RJ, Vijaya L. Evaluation of tonometric correction factors. J Glaucoma. 2005;14(5):337–343. doi: 10.1097/01.ijg.0000176940.81799.33. [DOI] [PubMed] [Google Scholar]
- 7.Wu RY, Zheng YF, Wong TY, Cheung CY, Loon SC, Chauhan BC, Aung T. Relationship of central corneal thickness with optic disc parameters: the Singapore Malay Eye Study. Invest Ophthalmol Vis Sci. 2011;52(3):1320–1324. doi: 10.1167/iovs.10-6038. [DOI] [PubMed] [Google Scholar]
- 8.Medeiros FA, Sample PA, Weinreb RN. Corneal thickness measurements and frequency doubling technology perimetry abnormalities in ocular hypertensive eyes. Ophthalmology. 2003;110(10):1903–1908. doi: 10.1016/S0161-6420(03)00734-6. [DOI] [PubMed] [Google Scholar]
- 9.Herdon LW, Weizer JS, Stinnett SS. Central corneal thickness as a risk factor for advanced glaucoma damage. Arch Ophthalmol. 2004;122(1):17–21. doi: 10.1001/archopht.122.1.17. [DOI] [PubMed] [Google Scholar]
- 10.Medeiros FA, Sample PA, Zangwill LM, Bowd C, Aihara M, Weinreb RN. Corneal thickness as a risk factor for visual field loss in patients with preperimetric glaucomatous optic neuropathy. Am J Ophthalmol. 2003;136(5):805–813. doi: 10.1016/s0002-9394(03)00484-7. [DOI] [PubMed] [Google Scholar]
- 11.Kohlhaas M, Boehm AG, Spoerl E, Pürsten A, Grein HJ, Pillunat LE. Effect of central corneal thickness, corneal curvature, and axial length on applanation tonometry. Arch Ophthalmol. 2006;124(4):471–476. doi: 10.1001/archopht.124.4.471. [DOI] [PubMed] [Google Scholar]
- 12.Doughty MJ, Zaman ML. Human corneal thickness and its impact on intraocular pressure measures: a review and meta-analysis approach. Surv Ophthalmol. 2000;44(5):367–408. doi: 10.1016/s0039-6257(00)00110-7. [DOI] [PubMed] [Google Scholar]
- 13.Nomura H, Ando F, Niino N, Shimokata H, Miyake Y. The relationship between age and intraocular pressure in a Japanese population: the influence of central corneal thickness. Curr Eye Res. 2002;24(2):81–85. doi: 10.1076/ceyr.24.2.81.8161. [DOI] [PubMed] [Google Scholar]
- 14.Gordon MO, Beiser JA, Brandt JD, Heuer DK, Higginbotham EJ, Johnson CA, Keltner JL, Miller JP, Parrish RK, 2nd, Wilson MR, Kass MA. The Ocular Hypertension Treatment Study: baseline factors that predict the onset of primary open-angle glaucoma. Arch Ophthalmol. 2002;120(6):714–720;discussion 829–830. doi: 10.1001/archopht.120.6.714. [DOI] [PubMed] [Google Scholar]
- 15.Wells AP, Garway-Heath DF, Poostchi A, Wong T, Chan KC, Sachdev N. Corneal hysteresis but not corneal thickness correlates with optic nerve surface compliance in glaucoma patients. Invest Ophthalmol Vis Sci. 2008;49(8):3262–3268. doi: 10.1167/iovs.07-1556. [DOI] [PubMed] [Google Scholar]
- 16.Bochmann F, Ang GS, Azuara-Blanco A. Lower corneal hysteresis in glaucoma patients with acquired pit of the optic nerve (APON) Graefes Arch Clin Exp Ophthalmol. 2008;246(5):735–738. doi: 10.1007/s00417-007-0756-5. [DOI] [PubMed] [Google Scholar]
- 17.Saenz-Frances F, Garcia-Feijó J, Jañez L, Borrego-Sanz L, Martinez de la Casa JM, Fernandez-Vidal A, Mendez-Hernández C, Santos-Bueso E, Reche-Frutos J, Garcia-Sánchez J. Comparing corneal variables in healthy subjects and patients with primary open-angle glaucoma. Invest Ophthalmol Vis Sci. 2011;52(6):3683–3688. doi: 10.1167/iovs.10-6660. [DOI] [PubMed] [Google Scholar]
- 18.Saenz-Frances F, Jañez L, Borrego-Sanz L, Martinez-de-la-Casa JM, Jerez-Fidalgo M, Garcia-Sánchez J, Garcia-Feijoo J. Effect of corneal morphometry on dynamic contour and Goldmann applanation tonometry. J Glaucoma. 2013;22(5):380–383. doi: 10.1097/IJG.0b013e318255bb17. [DOI] [PubMed] [Google Scholar]
- 19.Mohamed-Noor J, Bochmann F, Siddiqui MA, Atta HR, Leslie T, Maharajan P, Wong YM, Azuara-Blanco A. Correlation between corneal and scleral thickness in glaucoma. J Glaucoma. 2009;18(1):32–36. doi: 10.1097/IJG.0b013e31816b2fd1. [DOI] [PubMed] [Google Scholar]
- 20.Pakravan M, Parsa A, Sanagou M, Parsa CF. Central corneal thickness and correlation to optic disc size: a potential link for suscep- tibility to glaucoma. Br J Ophthalmol. 2007;91(1):26–28. doi: 10.1136/bjo.2006.106039. [DOI] [PMC free article] [PubMed] [Google Scholar]
- 21.Terai N, Spoerl E, Pillunat LE, Kuhlisch E, Schmidt E, Boehm AG. The relationship between central corneal thickness and optic disc size in patients with primary open-angle glaucoma in a hospital-based population. Acta Ophthalmol. 2011;89(6):556–559. doi: 10.1111/j.1755-3768.2009.01746.x. [DOI] [PubMed] [Google Scholar]
- 22.Kourkoutas D, Georgopoulos G, Maragos A, Apostolakis I, Tsekouras G, Karanasiou IS, Papaconstantinou D, Iliakis E, Moschos M. New nonlinear multivariable model shows the relationship between central corneal thickness and HRTII topographic parameters in glaucoma patients. Clin Ophthalmol. 2009;3:313–323. doi: 10.2147/opth.s5032. [DOI] [PMC free article] [PubMed] [Google Scholar]
- 23.Abe H, Shirakashi M, Tsutsumi T, Araie M, Tomidokoro A, Iwase A, Tomita G, Yamamoto T, Tajimi Study Group Laser scanning tomography of optic discs of the normal Japanese population in a population based setting. Ophthalmology. 2009;116(2):223–230. doi: 10.1016/j.ophtha.2008.09.013. [DOI] [PubMed] [Google Scholar]
- 24.Hawker MJ, Edmunds MR, Vernon SA, Hillman JG, MacNab HK. The relationship between central corneal thickness and the optic disc in an elderly population: the Bridlington Eye Assessment Project. Eye(Lond) 2009;23(1):56–62. doi: 10.1038/sj.eye.6703001. [DOI] [PubMed] [Google Scholar]
- 25.Saarela V, Airaksinen PJ. Heidelberg retina tomograph parameters of the optic disc in eyes with progressive retinal nerve fibre layer defects. Acta Ophthalmol. 2008;86(6):603–608. doi: 10.1111/j.1600-0420.2007.01119.x. [DOI] [PubMed] [Google Scholar]
- 26.Oddone F, Centofanti M, Rossetti L, Iester M, Fogagnolo P, Capris E, Manni G. Exploring the Heidelberg Retinal Tomograph 3 diagnostic accuracy across disc sizes and glaucoma stages: a multicenter study. Ophthalmology. 2008;115(8):1358–1365. doi: 10.1016/j.ophtha.2008.01.007. [DOI] [PubMed] [Google Scholar]
- 27.Ferreras A, Pablo LE, Larrosa JM, Polo V, Pajarín AB, Honrubia FM. Discriminating between normal and glaucoma-damaged eyes with the Heidelberg Retina Tomograph 3. Ophthalmology. 2008;115(5):775–781.e2. doi: 10.1016/j.ophtha.2007.06.032. [DOI] [PubMed] [Google Scholar]
- 28.Uysal Y, Bayer A, Erdurman C, Kiliç S. Sensitivity and specificity of Heidelberg Retinal Tomography II parameters in detecting early and moderate glaucomatous damage: effect of disc size. Clin Experiment Ophthalmol. 2007;35(2):113–118. doi: 10.1111/j.1442-9071.2006.01393.x. [DOI] [PubMed] [Google Scholar]
- 29.Larrosa JM, Polo V, Pérez-Iñigo A, Ferreras A, García-Feijoó J, Antón A, Honrubia FM. Optic nerve head parameters as measured by confocal scanning laser (Heidelberg Retina Tomograph II) in normal, ocular hypertensive and glaucomatous subjects. Arch Soc Esp Oftalmol. 2008;83(7):407–415. doi: 10.4321/s0365-66912008000700004. [DOI] [PubMed] [Google Scholar]
- 30.Garudadri CS, Rao HL, Parikh RS, Jonnadula GB, Selvaraj P, Nutheti R, Thomas R. Effect of optic disc size and disease severity on the diagnostic capability of glaucoma imaging technologies in an Indian population. J Glaucoma. 2012;21(7):475–480. doi: 10.1097/IJG.0b013e31821829f1. [DOI] [PubMed] [Google Scholar]


