Abstract
AIM
To measure the macular pigment optical density (MPOD) in healthy Chinese people and patients with early age-related macular degeneration (AMD).
METHODS
Cross-sectional population based study. Demographic and lifestyle characteristics were ascertained by questionnaire. A food frequency questionnaire was completed for all participants. Participants underwent general physical and ophthalmic examinations and MPOD was measured by heterochromatic flicker photometry. Foveal architecture was measured by optical coherence tomography.
RESULTS
MPOD of 225 participants (122 healthy and 103 early AMD) was 0.48±0.18. Patients with early AMD (0.52±0.19) tended to have higher MPOD levels than healthy people (0.47±0.17), but the difference was not statistically significant (P=0.06). Participants with carrot or corn oil intake every week tended to have higher levels of MPOD (P=0.002 and 0.008 respectively) while those with corn intake had relatively lower level of MPOD (P=0.01). MPOD increased with the center foveal thickness (P=0.01).
CONCLUSION
Our findings show that there is no statistically significant association between MPOD and early AMD in the studied population. MPOD is related to center foveal thickness and diets would influence MPOD levels.
Keywords: age-related macular degeneration, diets, foveal architecture, macular pigment optical density
INTRODUCTION
Age-related macular degeneration (AMD) is the leading cause of irreversible blindness in elderly of western countries[1],[2] and poses a burden to the society[3]. Though the prevalence of AMD is relatively lower in China[4], the overall incidence is expected to increase with the increasing life expectancy of the Chinese population. The current treatment paradigms of late stage AMD are not cost effective[5], therefore prevention is important. Although the pathogenesis of AMD remains unclear, it is plausible that cumulative blue light damage and/or oxidative stress play a role[6]. The macular pigment is comprised of two carotenoids, lutein and zeaxanthin, both entirely of dietary origin[7]. Macular pigment is purported to have a protective role from the development of AMD due to its ability to absorb harmful blue light and for its powerful antioxidant properties[8].
A growing body of evidences indicates that low levels of macular pigment are associated with AMD or its risk factors. A study of a Japanese population showed that macular pigment optical density (MPOD) of early and late AMD patients were lower than that of normal subjects[9]. Similarly, eyes with AMD showed less macular pigment density than controls[10]. In a northern European population, healthy eyes predisposed to AMD had significantly lower MPOD levels as compared to the healthy eyes at no such risk[11]. In addition, MPOD levels were affected by multiple factors, including genetic[12], age[13]–[15], gender[16],[17], smoking status[18]–[20], dietary habits[21],[22] and body mass index (BMI)[23],[24]. However, the conclusions were conflicting. Studies have also shown that the foveal architecture plays a role in the deposition of macular pigment in the retina[25],[26]. We have previously reported that MPOD levels might be relatively higher in the healthy Chinese population as compared to other populations[20]. In this current study, we compare MPOD levels in patients with or without early AMD. We also study the foveal architecture with optical coherence tomography (OCT) and its correlation with MPOD.
SUBJECTS AND METHODS
Residents over 45y from Desheng community of urban Beijing were recruited between July and September 2012. People with severe media opacity or any retinopathy other than early AMD or shallow anterior chamber precluding mydriasis were excluded. The study protocol was authorized by the Ethics Committee of Beijing Tongren Hospital and was conducted in compliance with the Declaration of Helsinki. Informed consent was obtained from all participants before their enrollment.
Demographic, lifestyle and medical characteristics were ascertained by questionnaire with particular attention toward risk factors for AMD, which included age, sex, education level, smoking status (current smoker, ex-smoker and never smoker), sunlight exposure, family history of AMD, history of hypertension and hyperlipidemia.
At enrollment, subjects completed a 14-item food frequency questionnaire with a list of foods rich in quantity of lutein and zeaxanthin[27] according to the local dietary habit. The food list contained corn, egg yolk, Chinese wolfberry, carrot, spinach, tea, bean curd, fish, shrimp, yellow vegetable, red vegetable, black vegetable, milk and oil. Any supplements, such as xanthophyll, carotene, fish oil, vitamin A, vitamin C, vitamin E, compound vitamin B and docosahexaenoic acid (DHA) were also recorded. Subjects were asked to indicate the duration of consumption and the average frequency.
Participants underwent general physical and ophthalmic examinations including the measurement of BMI (defined as kilograms body weight/per square meter of height), blood pressure, computerized optometry, best-corrected visual acuity, slit-lamp biomicroscopy, and ophthalmoscopy. Stereoscopic fundus photographs of the macula were taken using a digital fundus camera (Zeiss Visucam Pro, Oberkochen, Germany) through standardized procedures. One trained ophthalmologist (Yang XF) graded all the images at the Fundus Photographic Reading Center of Wisconsin University, according to the protocol of Wisconsin age-related maculopathy grading system[28].
MPOD was measured psychophysically with MPS1000 (Hartest Precision Instruments, Surrey, UK), a computerized device utilizes the principle of heterochromatic flicker photometry (HFP)[29]. The MPS1000 uses specific wavelengths blue light (470 nm, maximum macular pigment absorption is at 460 nm) and green light (540 nm, not absorbed by macular pigment) to gauge a patient's response. The equal luminance points are obtained by presenting the two lights at a series of different intensity ratios of the blue and green lights. The flicker frequency starts at a high rate where flicker cannot be detected and blue-green intensity ratio is slowly reduced until the observer sees the flicker at which point they press the response button. This process is repeated for the central 0.5° parafovea eccentricity where the concentration of macular pigment peaks and peripheral 8° parafovea eccentricity where macular pigment is considered to be absent. Two graphs of frequency versus blue/green ratio are obtained. Each curve will have a minimum, which corresponds to the equal luminance point for the blue/green target. The software built-in calculates the difference between these minima to obtain the optical density of the macular pigment.
Macular Cube Scan (512 A-scans×128 B-scans) for both eyes of all subjects was captured after pupillary dilation using a spectral domain OCT Cirrus HD-OCT 400 (Carl Zeiss Meditec, Dublin, USA). The foveal architecture values, including the average center foveal thickness (CFT, central circle within 1 mm diameter), cube average thickness (CAT, 6×6-mm2) and cube volume (CV, 6×6-mm2) were assessed automatically by the built-in topographic mapping software version 6.0. The retinal thickness is calculated as the distance between the internal limiting membrane (ILM) and the retinal pigment epithelium (RPE). A good quality scan with signal strength of at least 5 was accepted.
Overnight fasting blood samples were drawn for measurement of fasting blood glucose (FBG), c-reactive protein (CRP), total cholesterol (TC), triglycerides (TG), high-density lipoprotein cholesterol (HDL), and low-density lipoprotein cholesterol (LDL).
All data were double entered and validated with EpiData program, version 3.1 (The Epi Data Association, Odense, Denmark). Statistical analysis was performed using R statistical software package, version 2.11.0. (http://www.r-project.org/). Mean and standard deviation (SD) were calculated for continuous variables with normal distribution. The correlation analyses of MPOD with the candidate influence factors were assessed using the t-test or univariate linear regression as appropriate. Variables with P value ≤0.3 in the univariate analysis were further controlled in a multivariate linear regression model. The level of significance was set at P <0.05.
RESULTS
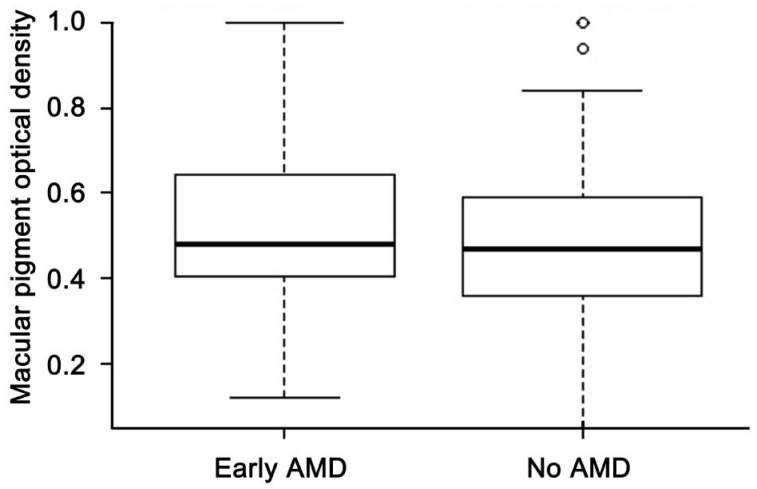
A total of 238 subjects participated in the study and 13 were excluded from the analyses because the MPOD measurements could not be performed. Of the remaining 225, there were 80 male (35.6%) and 145 female (64.4%), with age ranged from 48 to 82 (67.56±7.69)y. Among them, 103 (45.8%) had early AMD and 122 (54.2%) had no AMD. MPOD of 438 eyes (222 right eyes and 216 left eyes) were available with the mean of 0.48±0.18. Measurement of MPOD between right eyes (0.49±0.18) and left eyes (0.48±0.18) showed no statistically significant difference (P=0.08). MPOD data in the right eye were therefore used to represent each individual for further analysis. Three individuals had no data in the right eyes and data in their left eyes were used for further analysis. In univariate analysis with respect to demographic, lifestyle and physical characteristics, participants aged 65y or over had higher MPOD than those younger than 65y (P=0.04). People with hypertension had lower MPOD than those without (P=0.04) (Table 1). Patients with early AMD (0.52±0.19) tended to have higher MPOD levels than healthy people (0.47±0.17), but the difference was not statistically significant (P=0.06, Figure 1).
Table 1. The demographic, lifestyle and physical characteristics with MPOD in the studied population.
| Characteristic | n (%) | MPOD | P |
| Age (a) | |||
| <65 | 88 (39.1) | 0.46±0.15 | 0.04 |
| ≥65 | 137 (60.9) | 0.51±0.19 | |
| Sex | |||
| M | 80 (35.6) | 0.51±0.18 | 0.19 |
| F | 145 (64.4) | 0.48±0.18 | |
| Ethic | |||
| Han | 208 (92.4) | 0.49±0.18 | 0.55 |
| Minority | 17 (7.6) | 0.51±0.15 | |
| Education | |||
| High school or above | 146 (64.9) | 0.51±0.18 | 0.05 |
| Middle school or lower | 79 (35.1) | 0.46±0.18 | |
| Hypertension | |||
| Yes | 80 (42.8) | 0.46±0.18 | 0.04 |
| No | 107 (57.2) | 0.51±0.18 | |
| Hyperlipidemia | |||
| Yes | 67 (36.0) | 0.48±0.18 | 0.41 |
| No | 119 (64.0) | 0.48±0.18 | |
| Smoking | |||
| Current or ex-smoker | 28 (13.0) | 0.48±0.17 | 0.22 |
| Never smoke | 188 (87.0) | 0.49±0.18 | |
| Sunlight expose | |||
| Yes | 72 (33.2) | 0.48±0.18 | 0.76 |
| No | 145 (66.8) | 0.49±0.18 | |
| BMI | |||
| <27 | 160 (71.1) | 0.49±0.17 | 0.74 |
| ≥27 | 65 (28.9) | 0.49±0.19 | |
| Refractive error | |||
| Yes | 119 (52.9) | 0.48±0.17 | 0.54 |
| No | 106 (47.1) | 0.50±0.18 | |
| AMD | |||
| Healthy | 122 (54.2) | 0.47±0.17 | 0.06 |
| Early AMD | 103 (45.8) | 0.52±0.19 |
BMI: Body mass index.
x±s
Figure 1. Distribution of MPOD by AMD stage.
The association of MPOD with serum biochemical indexes was summarized in Table 2. The values of MPOD decreased significantly with FBG in the univariate linear regression (P=0.04).
Table 2. Correlation of MPOD with serum biochemical indexes.
| Index | x±s | Coefficient | P |
| FBG (mmol/L) | 5.06±1.03 | -0.0235 | 0.04 |
| TG (mmol/L) | 1.65±1.00 | -0.0203 | 0.09 |
| TC (mmol/L) | 5.38±1.01 | -0.0195 | 0.10 |
| HDL (mmol/L) | 1.35±0.32 | -0.0163 | 0.67 |
| LDL (mmol/L) | 3.24±0.80 | -0.0138 | 0.36 |
| CRP (mg/dL) | 0.21±0.33 | 0.0102 | 0.78 |
FBG: Fasting blood glucose; TG: Triglycerides; TC: Total cholesterol; HDL: High-density lipoprotein cholesterol; LDL: Low-density lipoprotein cholesterol; CRP: C-reactive protein.
n=225
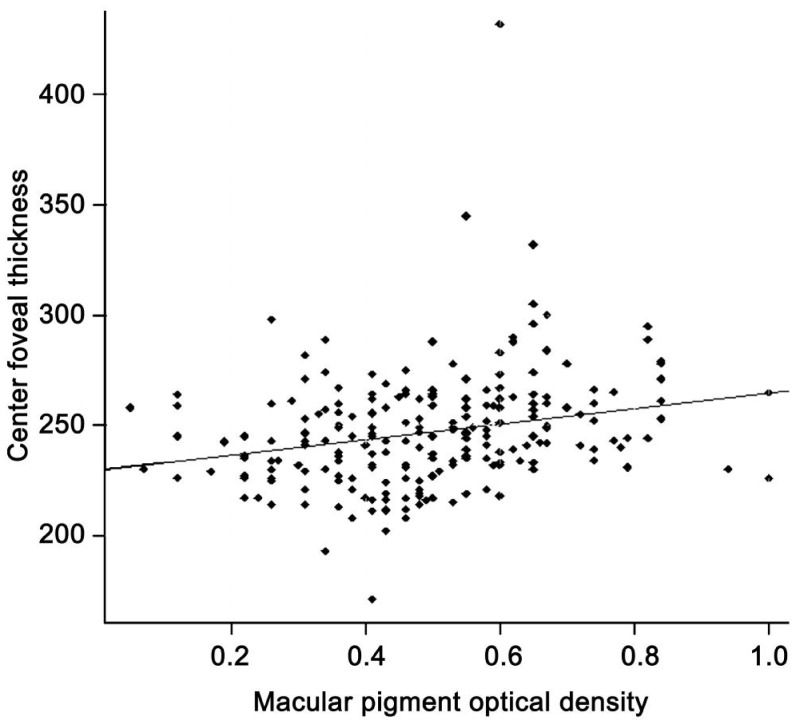
With respect to the foveal architecture, there is a positive and significant relation between MPOD and the CFT (P<0.001), but not with CAT (P=0.99) or CV (P=0.92) (Table 3).
Table 3. Correlation of MPOD with foveal architecture indexes.
| Index | x±s (µm) | Coefficient | P |
| CFT | 246.83±26.21 | 0.0017 | <0.001 |
| CAT | 274.77±15.03 | -0.00001 | 0.99 |
| CV | 9.81±0.54 | -0.0021 | 0.92 |
CFT: Center foveal thickness, central circle with 1 mm diameter; CAT: Cube average thickness, 6×6-mm2; CV: Cube volume, 6×6-mm2.
n=225
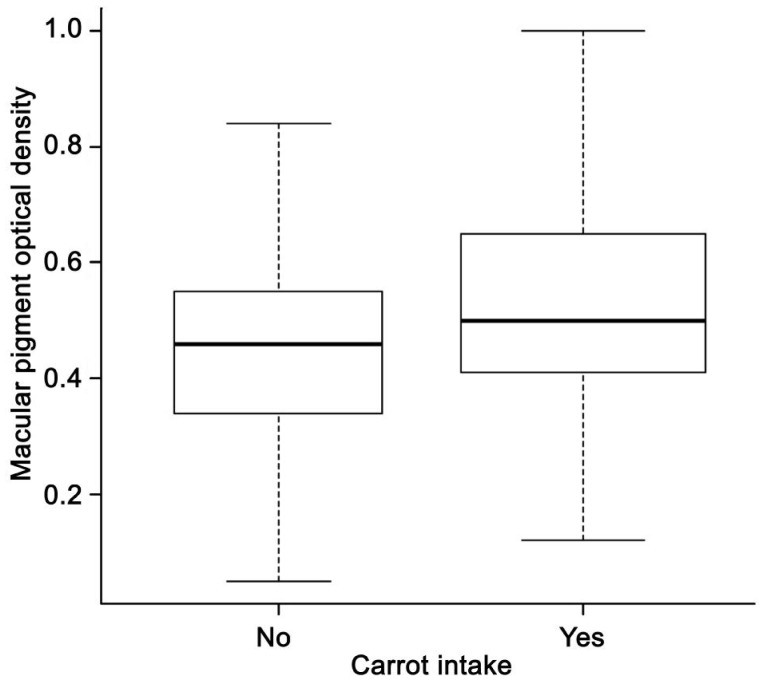
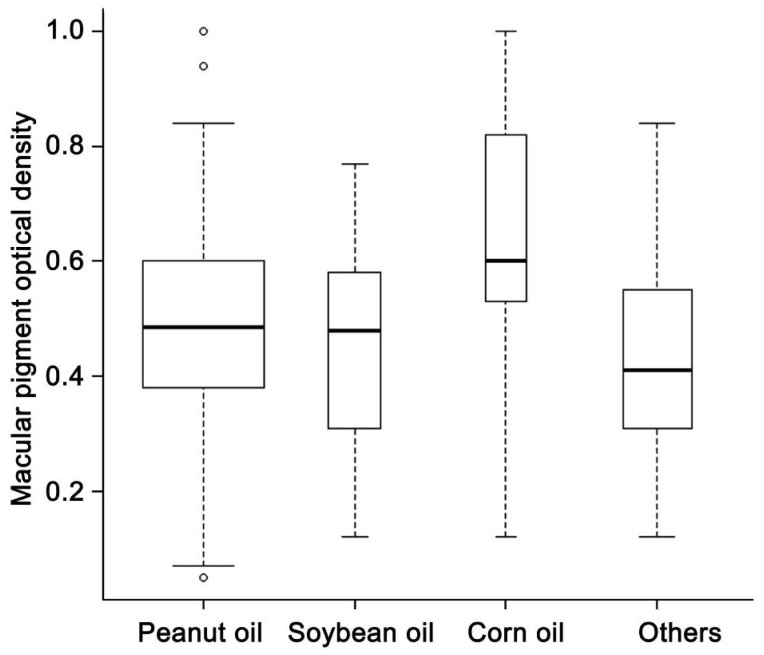
Five subjects took vitamin A regularly and had significantly lower MPOD levels than those who didn't take vitamin A (P=0.03). Participants who ate carrot every week had significantly higher MPOD levels than those who did not (P<0.001). Participants using corn oil as the main edible oil had significantly higher MPOD levels than those mainly using peanut oil (P<0.05) (Table 4).
Table 4. Correlation of MPOD with diet and supplement.
| Food type | Intaker1 | n (%) | MPOD | P |
| Tea | Yes | 102 (45.5) | 0.51±0.18 | 0.21 |
| No | 122 (54.5) | 0.48±0.18 | ||
| Bean curd | Yes | 153 (69.5) | 0.49±0.18 | 0.71 |
| No | 67 (30.5) | 0.50±0.17 | ||
| Corn | Yes | 145 (64.7) | 0.48±0.18 | 0.09 |
| No | 79 (35.3) | 0.52±0.17 | ||
| Egg yolk | Yes | 179 (79.9) | 0.50±0.19 | 0.25 |
| No | 45 (20.1) | 0.47±0.14 | ||
| Chinese wolfberry | Yes | 64 (28.4) | 0.50±0.19 | 0.62 |
| No | 161 (71.6) | 0.49±0.18 | ||
| Milk | Yes | 153 (68.3) | 0.49±0.19 | 0.52 |
| No | 71 (31.7) | 0.50±0.15 | ||
| Red vegetable | Yes | 189 (85.9) | 0.49±0.18 | 0.89 |
| No | 31 (14.1) | 0.49±0.17 | ||
| Yellow vegetable | Yes | 137 (62.3) | 0.51±0.19 | 0.11 |
| No | 83 (37.7) | 0.47±0.15 | ||
| Black vegetable | Yes | 185 (84.1) | 0.49±0.18 | 0.47 |
| No | 35 (15.9) | 0.51±0.18 | ||
| Carrot | Yes | 127 (58.0) | 0.53±0.18 | <0.001 |
| No | 92 (42.0) | 0.45±0.16 | ||
| Spinach | Yes | 69 (30.8) | 0.52±0.18 | 0.10 |
| No | 155 (69.2) | 0.48±0.18 | ||
| Fish | Yes | 120 (53.6) | 0.50±0.18 | 0.47 |
| No | 104 (46.4) | 0.48±0.18 | ||
| Shrimp | Yes | 48 (21.4) | 0.51±0.17 | 0.53 |
| No | 176 (78.6) | 0.49±0.18 | ||
| Oil type | ||||
| Peanut oil | Yes | 114 (61.6) | 0.50±0.17 | |
| Soybean oil | Yes | 21 (11.4) | 0.46±0.19 | 0.27 |
| Corn oil | Yes | 13 (7.0) | 0.61±0.24 | <0.05 |
| Others | Yes | 37 (20.0) | 0.44±0.17 | 0.07 |
| Vitamin A | Yes | 5 (2.7) | 0.31±0.12 | 0.03 |
| No | 179 (97.3) | 0.50±0.18 | ||
| Compound vitamin B | Yes | 6 (3.3) | 0.50±0.21 | 0.94 |
| No | 174 (96.7) | 0.49±0.18 | ||
| Vitamin C | Yes | 12 (6.5) | 0.55±0.25 | 0.42 |
| No | 172 (93.5) | 0.49±0.18 | ||
| Vitamin E | Yes | 10 (5.4) | 0.44±0.26 | 0.52 |
| No | 174 (94.6) | 0.49±0.18 | ||
| Fish oil | Yes | 17 (9.2) | 0.45±0.20 | 0.37 |
| No | 167 (90.8) | 0.50±0.18 | ||
| DHA | Yes | 8 (4.3) | 0.43±0.20 | 0.40 |
| No | 176 (95.7) | 0.49±0.18 |
1Intake at least one time every week within the latest month.
x±s
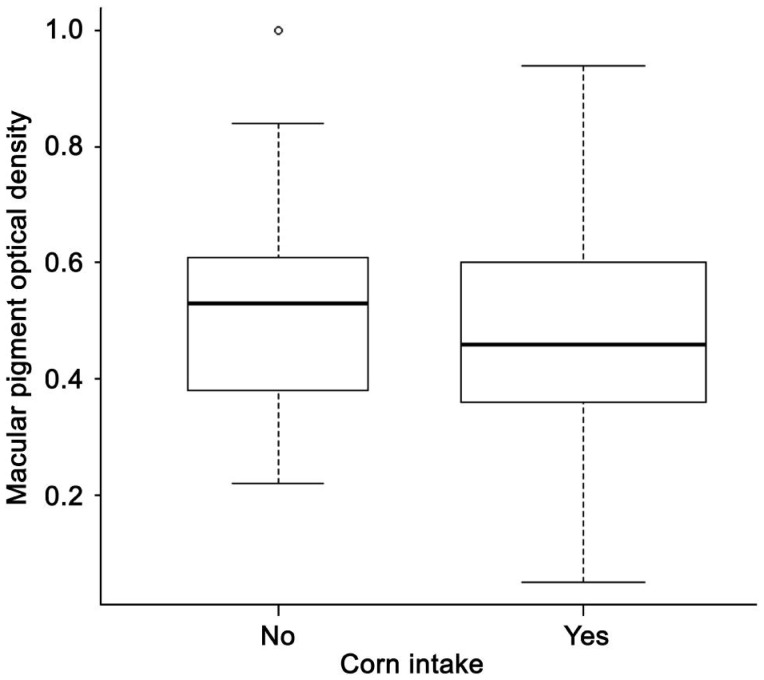
All factors with a P-value less than 0.3 in univariate analysis were included in a multivariate linear regression, including age, sex, education, smoking, history of hypertension, AMD stage, CFT, diet and supplement intake (tea, corn, egg yolk, carrot, spinach, yellow vegetable and vitamin A). With a stepwise method, 7 variables were kept in the final model (Table 5). The final model showed that people with carrot or corn oil intake every week had higher MPOD levels (P=0.002 and 0.008, Figures 2, 3, respectively) while those with corn intake had lower MPOD (P=0.01, Figure 4). Values of MPOD increased with the CFT (P=0.01, Figure 5).
Table 5. Factors related to MPOD with multivariate linear regression.
| Factors | Coefficient | P |
| Age (a) | 0.003 | 0.07 |
| Hypertention (yes vs no) | -0.044 | 0.09 |
| TC (mmol/L) | -0.019 | 0.12 |
| CFT (µm) | 0.001 | 0.01 |
| Corn (no eater vs intaker) | 0.066 | 0.01 |
| Carrot (no eater vs intaker) | -0.085 | 0.002 |
| Oil type | ||
| Peanut oil (reference) | ||
| Soybean oil | -0.033 | 0.45 |
| Corn oil | 0.134 | 0.008 |
| Others | -0.050 | 0.11 |
TC: Total cholesterol; CFT: Center foveal thickness, central circle with 1 mm diameter.
Figure 2. Distribution of MPOD by carrot intake.
Figure 3. Distribution of MPOD by oil intake.
Figure 4. Distribution of MPOD by corn intake.
Figure 5. Relationship between MPOD with center foveal thickness (µm).
DISCUSSION
The present study measured MPOD levels and detected significant effect of CFT, carrot intake, corn intake and corn oil intake on MPOD levels in healthy Chinese people or patients with early AMD. However, no significant correlation of MPOD with early AMD was detected.
Our data on the association between MPOD and early AMD are in agreement with previous study that also found no significant differences in MPOD between eyes with and without AMD[30]. Conversely, one study in Japanese population found that both early and late AMD patients had lower macular carotenoid levels than healthy people[9]. The reasons for the discrepancies may be due to sampling bias such as differences in age or dietary habits in different studies. For example, subjects with regularly lutein supplements were excluded and diet was not concerned in the Japanese study[9].
In the current study, we found that participants consumed carrot or corn oil as the main edible oil had significantly higher MPOD levels whereas those with corn intake had lower MPOD. These results may be explained by the absorption and transportation of the macular pigments. Humans cannot synthesize macular pigment but have to consume lutein and zeaxanthin from diet[27]. As fat-soluble antioxidant, macular pigments are absorbed by duodenal mucosal cells with fat and transported exclusively by lipoproteins[31]. In the presence of cholesterol, lutein segregates out from saturated lipid regions on cell membranes and accumulates into unsaturated phospholipids in order to form carotenoid-rich domains[32]. Study confirmed that zeaxanthin and lutein concentrations were associated strongly with plasma lipids[33]. Other aspects of the diet, such as duration and amount of supplementation, the vehicle (food or pill), may influence the uptake of these carotenoids by the intestine and the eye[22].
We also found that MPOD levels increased with the retinal thickness over the central 1 mm fovea in this study, which is in support with a previous study that reported positive association between MPOD and CFT at an eccentricity of 0.5 degree as measured by OCT in a group of healthy subjects. However, this association between MPOD and CFT only exist in the central fovea and disappeared at an eccentricity of 1 or 2 degrees[34]. Sandberg et al[25] also reported that MPOD levels increased with increasing CFT in patients with retinitis pigmentosa without cystoid macular edema. Moreover, Zheng et al[26] found that MPOD positively correlated with CFT in Chinese children aged from 6 to 12 years old. Contrastively, Nolan et al[35] found that MPOD was not related to CFT but positively and significantly related to foveal width and they stated that other personal characteristics might modulate the MPOD-retinal thickness relationship. In the current study, however, we failed to show the association between MPOD and CAT or CV.
The mean MPOD levels in this current study (0.48±0.18) are comparable to the data from our previous study in healthy Chinese population (0.49±0.18)[20], a study in young healthy Hong Kong Chinese (0.48±0.23)[16] and a study in healthy South Indian population (0.50±0.21)[13], but are relatively higher than those reported in midsouth USA (0.34±0.21)[15], north USA (0.26±0.19)[14] and northern European (0.29±0.16)[11] populations. There are studies showing the ethnic differences in MPOD levels[15],[36] and this could explain the distinction of MPOD levels among different populations.
In summary, the present study measured MPOD levels and detected significant effect of CFT, carrot intake, and corn oil intake on MPOD levels in healthy Chinese people or patients with early AMD, suggesting that CFT and dietary habits would influence MPOD levels. However, we showed no significant correlation between MPOD levels and early AMD. Further studies to confirm these observations would be warranted.
Acknowledgments
Foundations: Supported by the National Natural Science Foundation of China (No. 81070734); National Key Basic Research Program of China (973 Program, No. 2007CB512201).
Conflicts of interest: Ren XT, None; Gu H, None; Han X, None; Zhang JY, None; Li X, None; Yang XF, None; Xu J, None; Snellingen T, None; Liu XP, None; Wang NL, None; Liu NP, None.
REFERENCES
- 1.Congdon N, O'Colmain B, Klaver CC, Klein R, Munoz B, Friedman DS, Kempen J, Taylor HR, Mitchell P, Eye Diseases Prevalence Research Group Causes and prevalence of visual impairment among adults in the United States. Arch Ophthalmol. 2004;122(4):477–485. doi: 10.1001/archopht.122.4.477. [DOI] [PubMed] [Google Scholar]
- 2.Bunce C, Wormald R. Leading causes of certification for blindness and partial sight in England & Wales. BMC Public Health. 2006;6:58. doi: 10.1186/1471-2458-6-58. [DOI] [PMC free article] [PubMed] [Google Scholar]
- 3.Gupta OP, Brown GC, Brown MM. Age-related macular degeneration: the costs to society and the patient. Curr Opin Ophthalmol. 2007;18(3):201–205. doi: 10.1097/ICU.0b013e32810c8df4. [DOI] [PubMed] [Google Scholar]
- 4.Li Y, Xu L, Jonas JB, Yang H, Ma Y, Li J. Prevalence of age-related maculopathy in the adult population in China: the Beijing eye study. Am J Ophthalmol. 2006;142(5):788–793. doi: 10.1016/j.ajo.2006.06.001. [DOI] [PubMed] [Google Scholar]
- 5.Athanasakis K, Fragoulakis V, Tsiantou V, Masaoutis P, Maniadakis N, Kyriopoulos J. Cost-effectiveness analysis of ranibizumab versus verteporfin photodynamic therapy, pegaptanib sodium, and best supportive care for the treatment of age-related macular degeneration in Greece. Clin Ther. 2012;34(2):446–456. doi: 10.1016/j.clinthera.2012.01.005. [DOI] [PubMed] [Google Scholar]
- 6.de Jong PT. Age-related macular degeneration. N Engl J Med. 2006;355(14):1474–1485. doi: 10.1056/NEJMra062326. [DOI] [PubMed] [Google Scholar]
- 7.O'Connell E, Neelam K, Nolan J, Au Eong KG, Beatty S. Macular carotenoids and age-related maculopathy. Ann Acad Med Singapore. 2006;35(11):821–830. [PubMed] [Google Scholar]
- 8.Koushan K, Rusovici R, Li W, Ferguson LR, Chalam KV. The role of lutein in eye-related disease. Nutrients. 2013;5(5):1823–1839. doi: 10.3390/nu5051823. [DOI] [PMC free article] [PubMed] [Google Scholar]
- 9.Obana A, Hiramitsu T, Gohto Y, Ohira A, Mizuno S, Hirano T, Bernstein PS, Fujii H, Iseki K, Tanito M, Hotta Y. Macular carotenoid levels of normal subjects and age-related maculopathy patients in a Japanese population. Ophthalmology. 2008;115(1):147–157. doi: 10.1016/j.ophtha.2007.02.028. [DOI] [PubMed] [Google Scholar]
- 10.Bone RA, Landrum JT, Mayne ST, Gomez CM, Tibor SE, Twaroska EE. Macular pigment in donor eyes with and without AMD: a case-control study. Invest Ophthalmol Vis Sci. 2001;42(1):235–240. [PubMed] [Google Scholar]
- 11.Beatty S, Murray IJ, Henson DB, Carden D, Koh H, Boulton ME. Macular pigment and risk for age-related macular degeneration in subjects from a Northern European population. Invest Ophthalmol Vis Sci. 2001;42(2):439–446. [PubMed] [Google Scholar]
- 12.Hammond CJ, Liew SH, Van Kuijk FJ, Beatty S, Nolan JM, Spector TD, Gilbert CE. The heritability of macular response to supplemental lutein and zeaxanthin: a classic twin study. Invest Ophthalmol Vis Sci. 2012;53(8):4963–4968. doi: 10.1167/iovs.12-9618. [DOI] [PMC free article] [PubMed] [Google Scholar]
- 13.Raman R, Rajan R, Biswas S, Vaitheeswaran K, Sharma T. Macular pigment optical density in a South Indian population. Invest Ophthalmol Vis Sci. 2011;52(11):7910–7916. doi: 10.1167/iovs.11-7636. [DOI] [PubMed] [Google Scholar]
- 14.Ciulla TA, Hammond BR., Jr Macular pigment density and aging, assessed in the normal elderly and those with cataracts and age-related macular degeneration. Am J Ophthalmol. 2004;138(4):582–587. doi: 10.1016/j.ajo.2004.05.057. [DOI] [PubMed] [Google Scholar]
- 15.Iannaccone A, Mura M, Gallaher KT, Johnson EJ, Todd WA, Kenyon E, Harris TL, Harris T, Satterfield S, Johnson KC, Kritchevsky SB. Macular pigment optical density in the elderly: findings in a large biracial Midsouth population sample. Invest Ophthalmol Vis Sci. 2007;48(4):1458–1465. doi: 10.1167/iovs.06-0438. [DOI] [PMC free article] [PubMed] [Google Scholar]
- 16.Tang CY, Yip HS, Poon MY, Yau WL, Yap MK. Macular pigment optical density in young Chinese adults. Ophthalmic Physiol Opt. 2004;24(6):586–593. doi: 10.1111/j.1475-1313.2004.00242.x. [DOI] [PubMed] [Google Scholar]
- 17.Lam RF, Rao SK, Fan DS, Lau FT, Lam DS. Macular pigment optical density in a Chinese sample. Curr Eye Res. 2005;30(9):799–805. doi: 10.1080/02713680590968439. [DOI] [PubMed] [Google Scholar]
- 18.Nolan JM, Stack J, O'Donovan O, Loane E, Beatty S. Risk factors for age-related maculopathy are associated with a relative lack of macular pigment. Exp Eye Res. 2007;84(1):61–74. doi: 10.1016/j.exer.2006.08.016. [DOI] [PubMed] [Google Scholar]
- 19.Raman R, Biswas S, Gupta A, Kulothungan V, Sharma T. Association of macular pigment optical density with risk factors for wet age-related macular degeneration in the Indian population. Eye (Lond) 2012;26(7):950–957. doi: 10.1038/eye.2012.69. [DOI] [PMC free article] [PubMed] [Google Scholar]
- 20.Yu J, Johnson EJ, Shang F, Lim A, Zhou H, Cui L, Xu J, Snellingen T, Liu X, Wang N, Liu N. Measurement of macular pigment optical density in a healthy Chinese population sample. Invest Ophthalmol Vis Sci. 2012;53(4):2106–2111. doi: 10.1167/iovs.11-8518. [DOI] [PubMed] [Google Scholar]
- 21.Bone RA, Landrum JT. Dose-dependent response of serum lutein and macular pigment optical density to supplementation with lutein esters. Arch Biochem Biophys. 2010;504(1):50–55. doi: 10.1016/j.abb.2010.06.019. [DOI] [PMC free article] [PubMed] [Google Scholar]
- 22.Moeller SM, Voland R, Sarto GE, Gobel VL, Streicher SL, Mares JA. Women's Health Initiative diet intervention did not increase macular pigment optical density in an ancillary study of a subsample of the Women's Health Initiative. J Nutr. 2009;139(9):1692–1699. doi: 10.3945/jn.109.107748. [DOI] [PMC free article] [PubMed] [Google Scholar]
- 23.Mares JA, LaRowe TL, Snodderly DM, Moeller SM, Gruber MJ, Klein ML, Wooten BR, Johnson EJ, Chappell RJ, CAREDS Macular Pigment Study Group and Investigators Predictors of optical density of lutein and zeaxanthin in retinas of older women in the Carotenoids in Age-Related Eye Disease Study, an ancillary study of the Women's Health Initiative. Am J Clin Nutr. 2006;84(5):1107–1122. doi: 10.1093/ajcn/84.5.1107. [DOI] [PubMed] [Google Scholar]
- 24.Gupta A, Raman R, Biswas S, Rajan R, Kulothungan V, Sharma T. Association between various types of obesity and macular pigment optical density. Eye (Lond) 2012;26(2):259–266. doi: 10.1038/eye.2011.328. [DOI] [PMC free article] [PubMed] [Google Scholar]
- 25.Sandberg MA, Johnson EJ, Berson EL. The relationship of macular pigment optical density to serum lutein in retinitis pigmentosa. Invest Ophthalmol Vis Sci. 2010;51(2):1086–1091. doi: 10.1167/iovs.09-3396. [DOI] [PMC free article] [PubMed] [Google Scholar]
- 26.Zheng W, Zhang Z, Jiang K, Zhu J, He G, Ke B. Macular pigment optical density and its relationship with refractive status and foveal thickness in Chinese school--aged children. Curr Eye Res. 2013;38(1):168–173. doi: 10.3109/02713683.2012.713150. [DOI] [PubMed] [Google Scholar]
- 27.Davies NP, Morland AB. Macular pigments: their characteristics and putative role. Prog Retin Eye Res. 2004;23(5):533–559. doi: 10.1016/j.preteyeres.2004.05.004. [DOI] [PubMed] [Google Scholar]
- 28.Davis MD, Gangnon RE, Lee LY, Hubbard LD, Klein BE, Klein R, Ferris FL, Bressler SB, Milton RC, Age-Related Eye Disease Study Group The Age-Related Eye Disease Study severity scale for age-related macular degeneration: AREDS Report No. 17. Arch Ophthalmol. 2005;123(11):1484–1498. doi: 10.1001/archopht.123.11.1484. [DOI] [PMC free article] [PubMed] [Google Scholar]
- 29.Stringham JM, Hammond BR, Nolan JM, Wooten BR, Mammen A, Smollon W, Snodderly DM. The utility of using customized heterochromatic flicker photometry (cHFP) to measure macular pigment in patients with age-related macular degeneration. Exp Eye Res. 2008;87(5):445–453. doi: 10.1016/j.exer.2008.08.005. [DOI] [PubMed] [Google Scholar]
- 30.LaRowe TL, Mares JA, Snodderly DM, Klein ML, Wooten BR, Chappell R, CAREDS Macular Pigment Study Group Macular pigment density and age-related maculopathy in the Carotenoids in Age-Related Eye Disease Study. An ancillary study of the women's health initiative. Ophthalmology. 2008;115(5):876–883.e1. doi: 10.1016/j.ophtha.2007.06.015. [DOI] [PubMed] [Google Scholar]
- 31.Loane E, Nolan JM, O'Donovan O, Bhosale P, Bernstein PS, Beatty S. Transport and retinal capture of lutein and zeaxanthin with reference to age-related macular degeneration. Surv Ophthalmol. 2008;53(1):68–81. doi: 10.1016/j.survophthal.2007.10.008. [DOI] [PubMed] [Google Scholar]
- 32.Wisniewska A, Draus J, Subczynski WK. Is a fluid-mosaic model of biological membranes fully relevant? Studies on lipid organization in model and biological membranes. Cell Mol Biol Lett. 2003;8(1):147–159. [PubMed] [Google Scholar]
- 33.Renzi LM, Hammond BR, Jr, Dengler M, Roberts R. The relation between serum lipids and lutein and zeaxanthin in the serum and retina: Results from cross-sectional, case-control and case study designs. Lipids Health Dis. 2012;11:33. doi: 10.1186/1476-511X-11-33. [DOI] [PMC free article] [PubMed] [Google Scholar]
- 34.Liew SH, Gilbert CE, Spector TD, Mellerio J, Van Kuijk FJ, Beatty S, Fitzke F, Marshall J, Hammond CJ. Central retinal thickness is positively correlated with macular pigment optical density. Exp Eye Res. 2006;82(5):915–920. doi: 10.1016/j.exer.2005.10.014. [DOI] [PubMed] [Google Scholar]
- 35.Nolan JM, Stringham JM, Beatty S, Snodderly DM. Spatial profile of macular pigment and its relationship to foveal architecture. Invest Ophthalmol Vis Sci. 2008;49(5):2134–2142. doi: 10.1167/iovs.07-0933. [DOI] [PubMed] [Google Scholar]
- 36.Wolf-Schnurrbusch UE, Roosli N, Weyermann E, Heldner MR, Hohne K, Wolf S. Ethnic differences in macular pigment density and distribution. Invest Ophthalmol Vis Sci. 2007;48(8):3783–3787. doi: 10.1167/iovs.06-1218. [DOI] [PubMed] [Google Scholar]


