Abstract
Understanding the ability of cytotoxic oncology drugs, and their carriers and formulation excipients, to induce pro-inflammatory responses is important for establishing safe and efficacious formulations. Literature data about cytokine response induction by the traditional formulation of paclitaxel, Taxol®, is controversial, and no data is available about the pro-inflammatory profile of the nano-albumin formulation of this drug, Abraxane®. Herein, we demonstrate and explain the difference in the cytokine induction profile between Taxol® and Abraxane®, and describe a novel mechanism of cytokine induction by a nanosized excipient, Cremophor EL, which is not unique to Taxol® and is commonly used in the pharmaceutical industry for delivery of a wide variety of small molecular drugs.
Keywords: Cremophor-EL, Taxol®, Paclitaxel, Abraxane®, Interleukin 8, Oxidative stress, Cytokines, Immunotoxicity
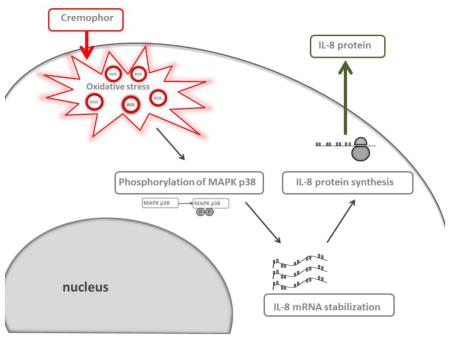
Taxol vehicle Cremophor-EL induces interleukin-8 (IL-8) in human peripheral blood cells through the mechanism bypassing gene expression. Reactive Oxygen Species (ROS) induced by Cremophor-EL activate MAPK p38, which results in stabilization of pre-synthesized IL-8 mRNA and production of the protein from this mRNA.
Background
Nanotechnology is increasingly used in drug delivery because the unique physicochemical properties of nanoparticles (size, surface charge, hydrophilicity, and presence of targeting moieties on the particle surface) help to overcome barriers commonly limiting the efficacy of traditional small and macromolecular drugs. Nanoparticles can improve solubility, pharmacokinetics, and biodistribution of traditional pharmaceuticals. Nanocarrier-formulated drugs have a range of other advantages over their traditionally formulated counterparts. These benefits include, but are not limited to, improved efficacy, reduced dose, the availability of alternative routes of administration, relegated toxicity, and reduced immunogenicity. Cytotoxic oncology drug paclitaxel is a good example of the reduced toxicity offered by drug reformulation using a nanotechnology platform. The traditional formulation of paclitaxel, Taxol®, is based on Cremophor-EL. Cremophor-EL is a polyethoxylated castor oil vehicle commonly used in the pharmaceutical industry to overcome the insolubility of hydrophobic compounds. While addressing the issue of poor drug solubility, Cremophor-EL creates additional problems such as immuno- and neurotoxicities. As such, clinical use of Cremophor-EL-formulated drugs is commonly associated with hypersensitivity reactions, neurotoxicity, nephrotoxicity, cardiotoxicity, and hematotoxicity 1-3. Furthermore, Cremophor-EL forms micelles, which may entrap other drugs co-administered with Cremophor-EL-formulated compounds, thus decreasing their bioavailability. In order to reduce hypersensitivity reactions triggered by Cremophor-EL, Taxol® is administered through a slow infusion and after the premedication with immunosuppressive agents 4. Despite these efforts, 2–3% of patients still develop hypersensitivity reactions to Taxol® 4. The nanotechnology formulation of paclitaxel is based on albumin nanoparticles. This formulation, Abraxane®, provides the same therapeutic benefits as Taxol®, but does not induce hypersensitivity reactions in patients even after single-push injection and without immunosuppressive premedication 4. It has been reported earlier by us 5 and others 3, 6, 7 that some of the hypersensitivity reactions in response to Taxol® are mediated by the complement activation, and that reformulating paclitaxel onto albumin nanoparticles eliminates this toxicity. It has also been reported earlier that Taxol® induces inflammatory cytokines in mouse macrophages 8-12 and that such activation involves toll-like receptor (TLR)-4, the same pattern recognition protein triggering immune activation by endotoxins 8, 9, 13. Induction of cytokines by Abraxane® has not been explored before. Therefore, the goals of our study were to compare the cytokine induction profiles of the traditional and nanoformulation of paclitaxel, Taxol® and Abraxane®, respectively; to identify the difference and to investigate the mechanism of cytokine induction in human cells.
Materials and Methods
Reagents and antibodies
The Abraxane® formulation of paclitaxel from Taxus media (Abraxis BioScience, Bridgewater, NJ), and Taxol® and the generic Cremophor-EL-based formulation of paclitaxel from Taxus species (Bristol-Myers Squibb, Princeton, NJ, and TEVA Pharmaceuticals, Inc., USA, respectively) were obtained through the National Institutes of Health pharmacy. Taxol® and the generic Cremophor-EL-based formulations of paclitaxel have no differences in their physicochemical properties and biological activities relevant to this study; therefore, for simplicity, we will refer to both formulations as Taxol®. Paclitaxel preparation from various natural sources (Taxus brevifolia and Taxus yannanensis) and semisynthetic paclitaxel were obtained from Sigma-Aldrich (St. Louis, MO) catalog numbers T7402, T1912, and T7191, respectively. Paclitaxel used by others in previously published studies 8, 9, 14, 15 was kindly provided by the National Cancer Institute (NCI) Developmental Therapeutics Program (DTP). Cremophor-EL (#C5135) and cycloheximide (CHX) were purchased from Sigma-Aldrich (St. Louis, MO). Mitogen-activated protein kinase (MAPK) inhibitors SP600125, SB203580, and U0126 were from obtained from Cell Signaling (Danvers, MA). Antibodies used for detecting phospho-p38 (pT180/pY182), phospho-Erk1/2 (pT202/pY201), phospho-JNK (pT183/pY185), as well as Perm buffer III were purchased from BD Biosciences (San Jose, CA). Vacutainer tubes were obtained from BD (Franklin Lakes, NJ). Escherichia coli K12 ultrapure lipopolysaccharide (LPS) was purchased from InvivoGen, Inc. (San Diego, CA). Glutamine, fetal calf serum (FCS), and penicillin/streptomycin were obtained from HyClone (ThermoScientific, Logan, UT). RPMI-1640 was obtained from Invitrogen/Life Technologies (Grand Island, NY). Ficoll-Paque Premium was obtained from GE Healthcare (Waukesha, WI).
Physicochemical characterization
A Malvern Zetasizer Nano ZS instrument (Southborough, MA) with a back-scattering detector (173 degrees, 633-nm laser wavelength) was used for measuring the hydrodynamic size (diameter) in batch mode at 25 °C in a low-volume quartz cuvette (pathlength 10 mm). Cremophor-EL and Taxol® samples were diluted 10-fold and 5-fold, respectively, in 10 mM of NaCl. A minimum of twelve measurements per sample were made. Hydrodynamic size is reported as the intensity-weighted average over all size populations (Z-avg).
Zeta potential provides a measurement of the electrostatic potential at the surface of the electrical double layer and the bulk medium, which is related to the nanoparticle surface charge. A Malvern Zetasizer Nano ZS instrument was used to measure zeta potential at 25 °C. Cremophor-EL and Taxol® samples were diluted 10-fold and 5-fold, respectively, in 10 mM of NaCl. An applied voltage of 150 V was used for all measurements. Sample pH was adjusted to 7 before the samples were loaded into a pre-rinsed folded capillary cell. A minimum of three measurements were made per sample. Zeta potential measurements are based on first principles, and, hence, no calibration is required. However, the instrument can be validated by running an appropriate standard (zeta potential transfer standard, DTS0050, and zeta potential value of –68 ± 7 mV at 25 °C, Malvern Instruments). This standard was run for validation before all zeta potential measurements.
Research donor blood
Healthy volunteer blood was collected under NCI at Frederick Protocol OH99-C-N046. Blood was drawn into BD vacutainer tubes containing Li-heparin as the anticoagulant. Blood was used within 1-1.5 h after collection and was kept at room temperature.
Cremophor-EL preparation
Cremophor-EL was mixed 1:1 with ethanol containing 2 mg/mL of citric acid to mimic the concentration of Cremophor-EL, citric acid, and ethanol used in Taxol® and the generic formulation of paclitaxel.
Cytokine induction in human blood
0.8 mL of whole blood diluted 1:4 in complete culture media (RPMI-1640, 10% FCS, 2 mM glutamine, 100 U/mL penicillin, and 100 μg/mL streptomycin sulfate) was added per well onto a 24-well plate; 0.2 mL of culture media containing controls or test materials was added to each well. Blood was incubated for 20 h at 37 °C in the presence of 5% CO2. At the end of the incubation time, the blood was spun down, and collected supernatants were stored at –20 °C before analysis for the presence of cytokines. Human tumor necrosis factor α (TNF-α), interleukin (IL)-1β, and IL-8 were detected in culture supernatants using commercial ELISA kits (R&D Systems, Carlsbad, CA) and according to the manufacturer’s instructions.
Isolation of human peripheral blood mononuclear cells (PBMCs)
PBMCs were isolated from human-heparinized blood using Ficoll-Paque Premium (GE Healthcare) and according to the manufacturer’s protocol. 10 × 6 cells were seeded onto a 24-well plate in 0.8 mL of complete culture media (RPMI-1640, 10% FCS, 2 mM glutamine, 100 U/mL penicillin, and 100 μg/mL streptomycin sulfate), and treated with 0.2 mL of controls and test samples. After incubation with controls and test samples, culture supernatants were collected and analyzed for the presence of cytokines by commercial ELISA kits (R&D Systems, Carlsbad, CA), using the manufacturer’s protocols.
Cytokine induction in Raw 264.7 cells
Raw cells (10 × 5 cells/sample) were seeded onto a 96-well plate in 0.2 mL of complete culture media (Dulbecco’s modified eagle medium, 10% FCS, 2 mM glutamine, 100 U/mL penicillin, and 100 μg/mL streptomycin sulfate). After 12 h of incubation to allow cell adhesion to the plate, 0.1 mL of media containing control or test materials were added to each well. Cells were incubated for 20 h at 37 °C in the presence of 5% CO2. When the incubation time was complete, supernatants were collected and stored at −20°C before the analysis for the presence of cytokine. At tested concentrations Paclitaxel was not toxic to cells. The Cremophor was tested at several concentrations due to decrease in cell viability observed when it was tested at high concentrations. Murine macrophage inflammatory protein 2 (MIP-2) and TNF-α were detected in culture supernatants using commercial ELISA kits (R&D Systems, Carlsbad, CA), according to manufacturer’s instructions.
RT-PCR
The treatment of human blood was performed as described in the section titled “Cytokine induction in human blood.” Blood was incubated with controls or tested materials for 4 h. At the end of the incubation period, RNA from whole blood was isolated using the PureLink total RNA blood purification kit (Invitrogen/Life Technologies, Grand Island, NY), according to the manufacturer’s protocol. Reverse transcription was performed with MultiScribe Reverse Transcriptase (Life Technologies, Austin, TX) in the presence of dNTP (0.2 mM), MgCl2 (5 mM), random hexamers (50 µM), RT buffer, and RNAse inhibitors (20 U/µL) in the concentrations recommended by the manufacturer. The PCR reaction was performed with high-fidelity Platinum Taq DNA polymerase (2 U/µL) (Life Technologies, Austin, TX) in the presence of the PCR buffer, dNTP (0.2 mM), MgCl2 (1.5 mM), and primers. IL-8 primers were custom ordered from IDT (Coralville, IA): forward primer (0.45 µM): 5'-AGAAACCACCGGAAGGAACCATCT-3', Probe (0.2 µM): 5'-AAACATGACTTCCAAGCTGGCCGT-3' (FAM), and reverse primer (0.45 µM): 5'-AGAGCTGCAGAAATCAGGAAGGCT-3'. Primers for 18S were used as the control: forward primer (0.15 µM): 5'-AGG AAT TCC CAG TAA GTG CG - 3', probe (0.2 µM): 5'-TCC CTG CCC TTT GTA CAC ACC GCC - 3' (Texas red), and reverse primer (0.15 µM): 5' - GCC TCA CTA AAC CAT CCA A - 3'. RT-PCR was performed using the IQ5 multicolor real-time PCR detection system (Bio-Rad, Hercules, CA).
Flow cytometry analysis
PBMCs (5 × 10⁶ cells/sample) were treated with different concentrations of Cremophor-EL. The detection of the phosphorylated forms of p38, Erk1/2, and JNK was performed according to manufacturer’s protocol. Briefly, at the end of the incubation period, cells were washed and fixed with warm 4% paraformaldehyde for 10 min at 37 °C in a water bath. Cells were permeabilized with chilled Perm buffer III on ice for 30 min, washed, and incubated with antibodies on ice for 30 min. The detection of the reactive oxygen species was performed with the CellROX Green Assay Kit (BD, Franklin Lakes, NJ), according to the manufacturer’s protocol. Briefly, PBMCs were treated with controls and designated concentrations of tested materials for 30 min. To prevent oxidative stress development, 5 mM of N-acetyl cysteine was added 1 h prior to the addition of test samples. After the treatment, cells were loaded with CellROX Green Reagent at a final concentration of 5 µM. Changes in mitochondrial potential were measured with MitoProbe JC-1 flow cytometry assay kits (BD Biosciences, San Jose, CA). Samples for all assays were analyzed using FACS Calibur and CellQuest software (BD Biosciences, San Jose, CA).
Northern blot
PBMCs (10 × 106 cells/sample) were incubated with Cremophor-EL or the LPS for 4 h. RNA protect cell reagent (Qiagen, Valencia, CA) was added to the samples, and the samples were stored at 4 °C overnight. RNA was isolated using the RNeasy Mini Kit (Qiagen, Valencia, CA), according to the manufacturer’s instructions. Some amount of the RNA from the LPS-treated samples was reverse transcribed and used as a template in the PCR reaction to build IL-8 detection probes for Northern blotting. To that end, IL-8 forward and reverse primers, and digoxigenin labeling dNTP from the PCR DIG labeling mix (Roche, Germany) were added to the PCR mixture. PCR products were separated using 1% agarose gel, and probes were isolated using QIAquick Gel Extraction Kit (Qiagen, Valencia, CA).
RNA separation on 1% agarose gel and transfer onto BrightStar-Plus membrane were performed with the NorthernMax Kit (Ambion/Life Technologies, Austin, TX). DIG wash and block buffer set, and DIG nucleic acid detection labeling mix (Roche, Germany) were used to detect RNA, according to the manufacturer’s instructions.
Detection of transcription factors
PBMCs (40 × 106cells/mL) were treated with Cremophor-EL (25 μM) for 1 h and 3 h, and nuclear extracts were isolated as follows: cells were washed with cold PBS and HB buffer (25 mM Tris-HCl [pH 7.4], 1 mM MgCl, 5 mM KCl); the final cell pellet was reconstituted in 1.5 mL of HB buffer and left on ice for 10 min; NP-40 was added to the final concentration of 0.05%; samples were gently mixed and incubated on ice for an additional 5 min (cell lysis was controlled under a phase-contrast microscope); and samples were spun down at 600× g for 5 min. The nuclear pellet was washed with HB buffer and reconstituted in 150 μL of nuclear extraction buffer (20 mM Tris-HCl [pH 8], 400 mM NaCl, 1.5 mM MgCl, 0.1% NP-40). The extraction of the nuclear protein in the nuclear extraction buffer was performed on ice with agitation for an additional 30 min. The protein concentration in the nuclear extract was measured with the microBCA assay (Thermo Scientific, Rockford, IL). Further steps were performed according to the Protein/DNA Array I manufacturer’s instructions (Affymetrix, Santa Clara, CA).
Results
Physicochemical characterization
We have previously reported the physicochemical characterization of Abraxane® 16. Below, we review the characterization of Taxol® and Cremophor-EL.
Cremophor-EL and Taxol® both exhibited a monomodal size distribution (PdI < 0.1), with a Z-average of 14 ± 0.1 nm. These results were expected because Taxol’s main component is Cremophor-EL. Zeta potential provides a measurement of the electrostatic potential at the interface of the electrical double layer and the bulk medium, which is related to nanoparticle surface charge. All tested formulations had neutral zeta potentials at pH 7 (zeta potential values - 10 < 0 < +10 mV are generally considered neutral).
Taxol® and its vehicle, Cremophor-EL, but not Abraxane®, induce the secretion of pro-inflammatory chemokine IL-8 in human blood cultures
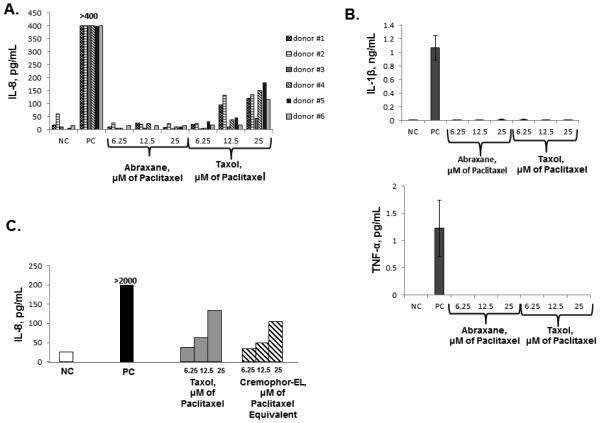
To study whether the reformulation of paclitaxel using nano-albumin particles resulted in a change in the cytokine secretion profile, we treated human whole blood and PBMCs with Taxol® and Abraxane® at equivalent concentrations of paclitaxel. These concentrations were selected based on previous studies 8, 9, 17. We limited a panel of pro-inflammatory cytokines to TNF-α, IL-1β, and IL-8 because these cytokines are the most prominent and commonly reported in the literature 18-21. Neither Taxol® nor Abraxane® induced the release of TNF-α and IL-1β, while IL-8 was observed only in the supernatants from cells treated with Taxol® (Figure 1, A and B and Supplementary Figure 1A). IL-8 induction by Taxol® was mediated by the Cremophor-EL vehicle because the cytokine profile data was identical in both Taxol®- and Cremophor-EL-treated cells (Figure 1, C and Supplementary Figure 1B and C).
Figure 1. Induction of pro-inflammatory cytokines by Taxol®, Abraxane® and Cremophor-EL in human whole blood.
Whole blood derived from 6 healthy donor volunteers was left untreated or treated with designated agents for 20 h. The LPS (20 ng/mL) was used as the positive control (PC) and culture media was used as the negative control (NC). Culture supernatants were analyzed by ELISA for the presence of IL-8 (A, C), IL-1β, and TNF-α. Each bar represents the mean value of the duplicate sample obtained from individual donor (N=2, %CV < 20%). Reference to the individual donor (#1 through #6) is provided in the box shown on the right (B). Concentrations of Cremophor-EL in samples treated only with this vehicle were equivalent to those in Taxol® at respective concentrations of paclitaxel. These concentrations are referred to as μM of paclitaxel equivalent. Samples from each individual donor were analyzed in duplicate (N=2, %CV<20); each bar shows the mean response of 6 donors. Blood from the same donors as in (A) was used to generate this data. (C) Shown is the data obtained from one donor and analyzed in duplicate (N=2, %CV< 20); similar results were obtained from two other donors (Supplementary Figures 1B and 1C).
Differences in cytokine response to Taxol® formulation and Cremophor-EL-free paclitaxel between mouse and human cells
The majority of published studies focusing on the cytokine-stimulating ability of paclitaxel were performed in murine cells8, 9, 12, 22. Furthermore, the involvement of the TLR-4 pathway in the induction of pro-inflammatory cytokines by paclitaxel was also shown in murine cells8, 9, 12, 22.
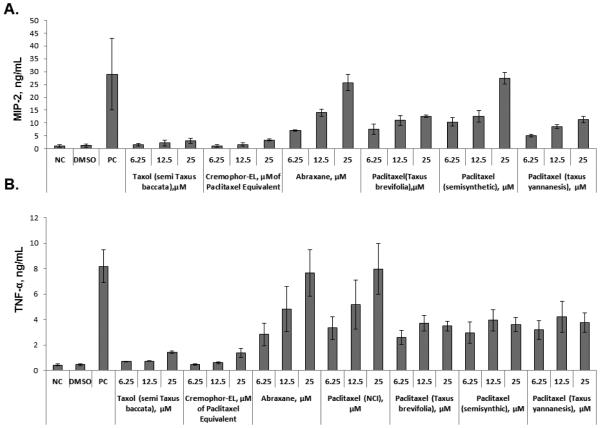
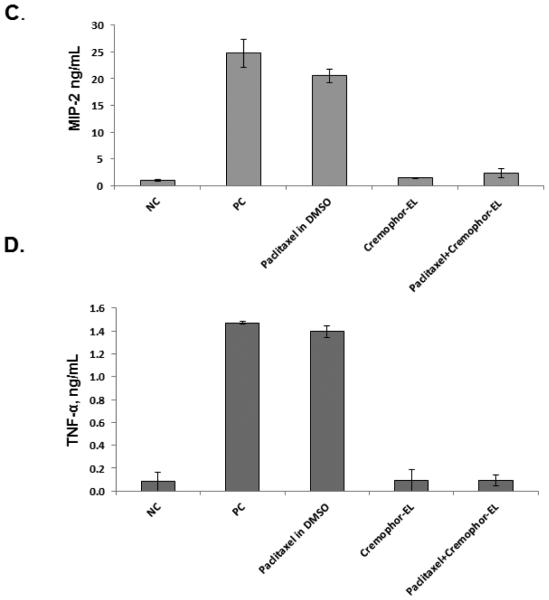
A discrepancy between murine and human cells in response to paclitaxel has been previously noted 13, 17, 23, and it was partly explained by the differences in paclitaxel’s binding to mouse and human MD-2 13, 24. Despite using paclitaxel dissolved in dimethyl sulfoxide (DMSO), these previous studies claimed that they tested Taxol® 8, 9, 13, 16, 22; however, neither the Taxol® formulation nor Cremophor-EL was evaluated in terms of cytokine response. To cover this gap and clarify the differences between paclitaxel’s and Taxol’s effects on cytokine production, we used mouse macrophage cell line Raw 264.7 and studied cytokine secretion in response to Taxol®, Cremophor-EL, Abraxane®, and various forms of paclitaxel dissolved in DMSO. Since murine cells do not express IL-8, we tested culture supernatants for the presence of the IL-8 functional homologue, macrophage inflammatory protein 2 (MIP-2). While we confirmed the findings of the previous studies demonstrating that paclitaxel in DMSO obtained from the NCI DTP branch induces inflammatory cytokines in mouse cells, we demonstrate here for the first time that neither the Taxol® formulation of paclitaxel nor Cremophor-EL induces the release of pro-inflammatory cytokines TNF-α and MIP-2 in Raw 264.7 cells (Figure 2, A and B). Moreover, when the same forms of paclitaxel were added concurrently with Cremophor-EL, TNF-α and MIP-2 secretion was completely blocked (Figure 2, C and D). In contrast, adding Cremophor-EL concurrently with the LPS did not significantly decrease cytokine production by this agonist (Supplementary Figure 2A and B). Cytokine induction by Abraxane® in murine macrophages was similar to that observed in supernatants from cells treated with paclitaxel dissolved in DMSO (Figure 2, A and B). Paclitaxels from various sources and in different Cremophor-EL-free formulations differed in their potency of inducing cytokines in murine macrophages Raw 264.7. Specifically, cytokine levels induced by the equimolar paclitaxel concentrations of Abraxane® and the DMSO-reconstituted paclitaxel from NCI DTP were the most potent inducers of TNFα; Abraxane® and DMSO-reconstituted semisynthetic paclitaxel were the most potent in terms of inducing MIP-2, while other paclitaxels in DMSO were moderate activators of cytokine secretion (Figure 2, A and B).
Figure 2. Effect of Cremophor-EL on paclitaxel-induced production of MIP-2 and TNF-α in murine macrophages.
Raw 264.7 cells were incubated with test samples and controls for 20 h, and the secretion of MIP-2 (A) and TNF-α (B) was analyzed by ELISA. PC – positive control (20 ng/mL of the LPS); NC – negative control (culture medium); DMSO (5.9 mg/mL) was used as a vehicle control for paclitaxels; test samples were Taxol®, Abraxane®, and paclitaxel from different sources dissolved in DMSO. The effects of Cremophor-EL on paclitaxel-triggered MIP-2 (C) and TNF-α (D) secretion by murine macrophages were evaluated by simultaneous addition of Cremophor-EL and 12.5 μM of paclitaxel in DMSO to the cells. Shown is the mean response and standard deviation from three independent experiments (N=3). Each sample within individual experiment was analyzed in duplicate (%CV <20).
Pathways involved in IL-8 induction by Cremophor-EL in human PBMCs
Since Cremophol-EL is a vehicle commonly used in the pharmaceutical industry to solubilize hydrophobic drugs, and there was a sharp distinction in the profile from other common inflammatory stimuli such as the LPS, we explored the mechanism of stimulating IL-8 production by Cremophor-EL. Mechanistic studies described herein used Cremophor-EL as a model because there was no difference between the cytokine profiles of the Taxol® formulation of paclitaxel and Cremophor-EL (Figure 1, C).
Release of IL-8 in response to Cremophor-EL is largely dependent on the processing of pre-existing mRNA
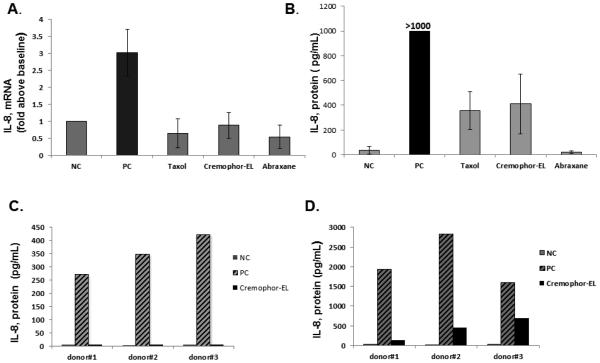
In order to understand the IL-8 induction mechanism, we first analyzed IL-8 mRNA levels in cells treated for 4 h with controls or Cremophor-EL. Human blood cells from only 2 out of 10 tested donors contained elevated levels of IL-8 mRNA after treatment with Cremophor-EL (Figure 3, A). Analysis of earlier and later time points (2 and 18 h, respectively) did not affect the overall finding in that further increases in IL-8 mRNA in more donors has not been detected (data not shown). Despite the lack of mRNA synthesis in specimens from the majority of donors, human blood cells from all 10 donors produced the IL-8 protein in response to Cremophor-EL treatment (Figure 3, B). To explore if Cremophor-EL triggers the release of the IL-8 protein from the pre-synthesized intracellular IL-8 pool, we measured IL-8 protein levels in the culture supernatants at 2 and 20 h after incubation with Cremophor-EL. While 20 h was sufficient for inducing IL-8 release, no IL-8 release was detected 2 h after the Cremophor-EL challenge (Figure 3, C and D). In contrast to Cremophor-EL treatment, human blood cells released IL-8 from pre-existing intracellular storage 2 h after stimulation with the LPS (Figure 3, C).
Figure 3. Secretion of IL-8 by human blood cells requires de novo synthesis of the protein but not mRNA.
Human whole blood was treated with the negative control (NC, cell culture medium), the positive control (PC, 20 ng/mL of the LPS), or test agents (Taxol®, Cremophor-EL, or Abraxane®) at equivalent paclitaxel concentration of 25 μM. The amounts of IL-8 mRNA (A) and IL-8 protein (B) were measured in the same specimens; each bar represents mean response and standard deviation from ten donors (N=10). The level of IL-8 protein in supernatants 2 h (C) and 20 h (D) after treatment with Cremophor 25 μM and the PC. Each bar shown the mean response (N=2, %CV < 20) for each of 3 tested individual donors.
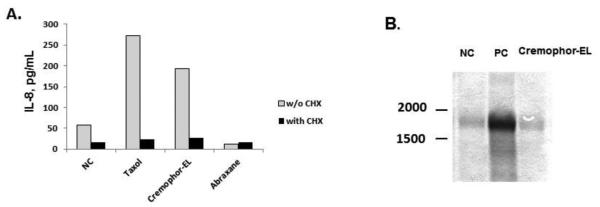
We next analyzed whether Cremophor-EL triggers the processing of pre-existing IL-8 mRNA. Protein synthesis inhibitor CHX prevented IL-8 secretion in response to Cremophor-EL treatment (Figure 4, A and Supplementary Figure 3A and B), while Northern blot analysis revealed that resting human PBMCs contain low levels of IL-8 mRNA (Figure 4, B).
Figure 4. Cremophor-EL induces synthesis of the IL-8 protein de novo from pre-existing IL-8 mRNA.
(A) Human PBMCs were treated with Taxol®, Abraxane®, or Cremophor-EL in the presence or absence of 5 μg/mL of protein synthesis inhibitor CHX. Supernatants were collected after 20 h of incubation and tested for the presence of IL-8 by ELISA. Shown is the mean response (N=2, %CV<20) from one donor; similar results were obtained from two more donors (Supplementary Figure 4A and B). (B) Northern blot analysis. PBMCs were left untreated or incubated with Cremophor-EL or the positive control (PC) for 4 h. The PC is 20 ng/mL of the LPS; Taxol® and Abraxane® were analyzed at equivalent paclitaxel concentrations of 25 μM; the concentration of Cremophor-EL used in this experiment was equivalent to what was used in Taxol® at 25 μM of paclitaxel. Shown is the representative data from one of three tested donors.
Cremophor-EL-induced release of the IL-8 protein is mediated by oxidative stress
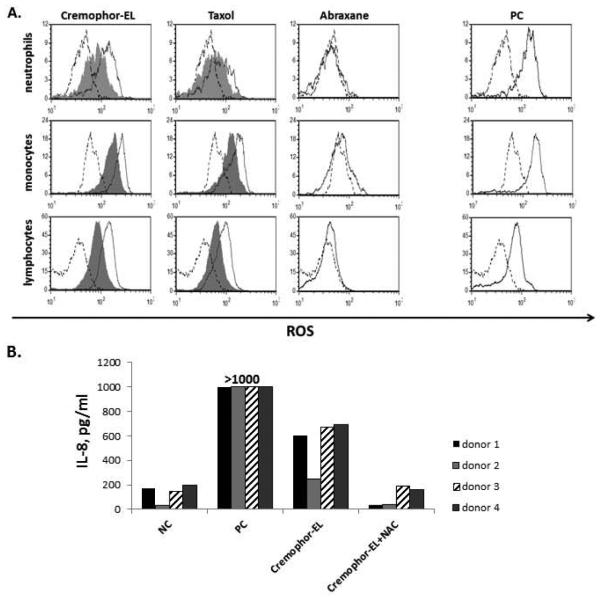
An excessive intracellular accumulation of lipids results in intensive lipid degradation and the generation of the reactive oxygen species 25-27. Since Cremophor-EL is a polyethoxylated castor oil, we next investigated whether Cremophor-EL can induce the generation of the reactive oxygen species. PBMCs were treated with Cremophor-EL for 30 min and loaded with a dye sensitive to the reactive oxygen species. Both Cremophor-EL and the Taxol® formulation of paclitaxel induced oxidative stress, which could be reduced by pre-incubating cells with antioxidant N-acetyl cysteine (NAC) (Figure 5, A). Consistent with our previous findings, the Cremophor-EL-free formulation of paclitaxel, Abraxane®, did not induce the generation of the reactive oxygen species (Figure 5, A). The increase in the amount of IL-8 protein secreted into the cell culture medium after treatment with Cremophor-EL correlates with the level of oxidative stress (Figure 5, B) and the decrease in cell viability (data not shown). Furthermore, pre-incubation with NAC significantly decreased Cremophor-EL-induced IL-8 production (Figure 5, B).
Figure 5. Cremophor-EL induces oxidative stress in human cells.
Human PBMCs were treated with the negative control (NC), the positive control (PC), Taxol®, Abraxane®, or Cremophor-EL with or without 5 mM of NAC. (A) After 1 h of treatment, cells were loaded with fluorescent dye sensitive to oxidative stress and analyzed by flow cytometry. The shift in green fluorescent channel FL-1 intensity (X-axis) is indicative of oxidative stress. Carbonyl cyanide m-chlorophenylhydrazone was used as the PC to induce oxidative stress. Shown is representative data from one of 4 tested donors (B) The levels of the IL-8 protein were tested in culture supernatants by ELISA 20 h after treatment of cells from the same donors used in A. The NC is cell culture media and the PC is 20 ng/mL of the LPS; Taxol® and Abraxane® were tested at equivalent (25 μM) concentrations of paclitaxel. The concentration of Cremophor-EL in Cremophor-EL-treated samples was equivalent to that in Taxol® when the Taxol® was used at 25 μM of paclitaxel. Each bar represents the mean value of the duplicate sample obtained from individual donor (N=2, %CV < 20%). Reference to the individual donor (#1 through #4) is provided in the box shown on the right.
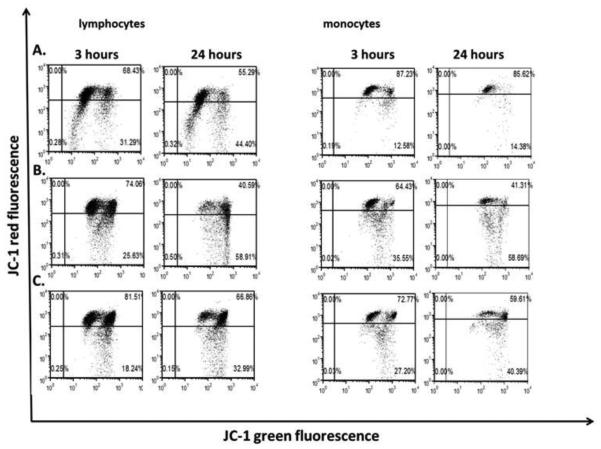
We next analyzed mitochondrial potential because mitochondria can both produce and be damaged by the reactive oxygen species. We loaded Cremophor-EL-treated cells with mitochondrial potential-sensitive dye JC-1. JC-1 accumulates in mitochondria and undergoes a membrane potential–dependent emission shift from green (529 nm) to red (590 nm) fluorescence. The disturbance of the mitochondrial potential results in a decrease in the red/green fluorescence ratio. Mitochondrial depolarization in monocytes was observed 3 h after treatment with Cremophor-EL, as evidenced by an increase in the number of cells with reduced red fluorescence (Figure 6, compare 3-h-labeled panel A to 3-h-labeled panels B and C). Extending the incubation time to 24 h resulted in an increase in the number of cells with depolarized mitochondria (Figure 6; compare 24-h-labeled panel A with 24-h-labeled panels B and C). Mitochondrial depolarization was more pronounced in monocytes than in lymphocytes (Figure 6; compare panel A to panels B and C for monocytes and lymphocytes).
Figure 6. Effects of Cremophor-EL on mitochondrial potential.
Human PBMCs were left untreated (A) or incubated with Cremophor-EL at two concentrations, 25 μM (B) and 12.5 μM (C), for 3 or 24 h. Shown is the representative data from one of three individual donors.
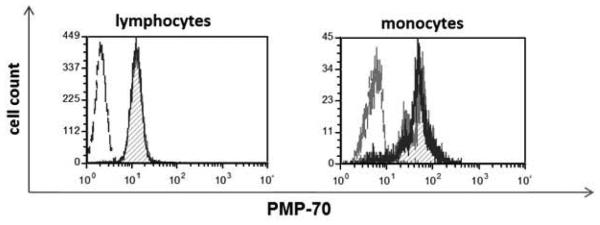
Because the reactive oxygen species can also be produced by peroxisomes, we analyzed whether Cremophor-EL triggers peroxisome activation and proliferation by assessing the expression of peroxisomal membrane protein PMP-70. Treating PBMCs with Cremophor-EL did not affect the expression of PMP-70 (Figure 7).
Figure 7. Effects of Cremophor-EL on peroxisome proliferation.
Human PBMCs were treated with 12.5 μM of Cremophor-EL for 18 h prior to analysis of intracellular levels of PMP-70 by flow cytometry. Dotted line – isotype control; hatched filled histogram – NC; solid line – Cremophor-EL. Shown is the representative data from one of three individual donors.
Activation of the MAPK pathway is involved in Cremophor-EL-induced IL-8 production by human blood cells
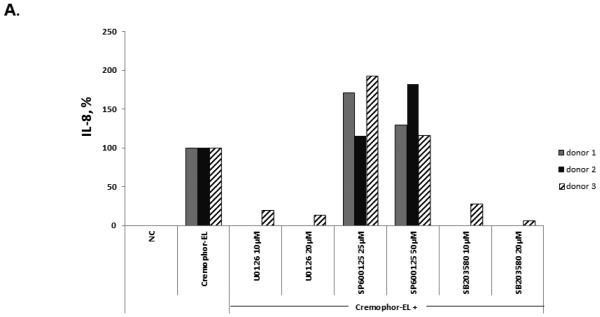
MAPK can be activated in response to mitogen- and stress-related stimuli 28. Activating the MAPK cascades was shown to control gene expression through the stabilization of mRNA 29, 30. Moreover, several studies suggested the involvement of MAPK activation in the induction of IL-8 31-34. To understand the role of MAPK in Cremophor-EL-triggered IL-8 synthesis, we pre-treated whole blood with several inhibitors specific to various members of the MAPK family: SB203580 (specific to p38, 35), U0126 (specific to Erk1/2, 36), and SP600125 (specific to JNK, 37). Cremophor-EL was added to these cultures 1 h after the addition of the inhibitors. While p38 and Erk1/2 inhibitors, SB203580 and U0126, respectively, almost completely suppressed the Cremophor-EL-triggered release of IL-8 (Figure 8, A), blocking JNK with SP600125 did not inhibit IL-8 release.
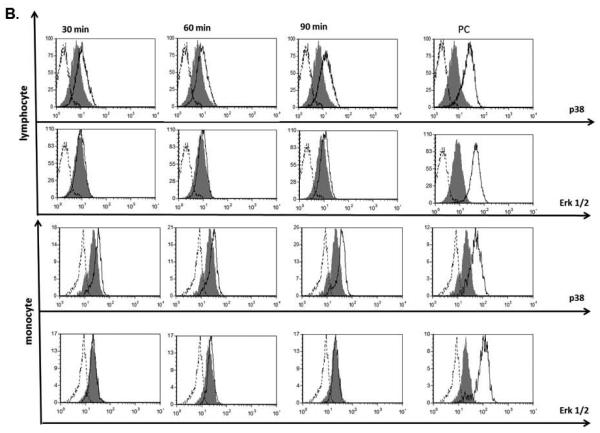
Figure 8. Effects of Cremophor-EL on MAPK.
(A) Human PBMCs were treated with 25 μM of Cremophor-EL and indicated concentrations of MAPK inhibitors. IL-8 was measured by ELISA in 20-h culture supernatants. Each bar represents the mean value of the duplicate sample obtained from individual donor (N=2, %CV < 20%). Reference to the individual donor (#1 through #3) is provided in the box shown on the right. Data are presented as the percentage of IL-8 protein induced by Cremophor-EL; the amounts of Cremophor-EL-triggered IL-8 were assigned to be 100%. (B) Human PBMCs were treated with 25 μM of Cremophor-EL for various time points before permeabilization and staining with antibodies specific to phosphorylated forms of p38 and Erk1/2. Dotted line – isotype control; filled histogram – NC; solid line – Cremophor-EL. Shown is the representative data from one of three individual donors.
To further verify activation of p38 by Cremophor-EL, we assessed the phosphorylation of this protein by flow cytometry. PBMC treatment with Cremophor-EL resulted in an increase in the phosphorylated form of p38 in both lymphocytes and monocytes (Figure 8, B, compare the filled histograms to solid line histograms in the panels labeled p38 for monocytes and lymphocytes). Similar analysis using antibodies specific to the phosphorylated form of Erk1/2 did not reveal phosphorylation of this member of the MAPK family in both cell populations (Figure 8, B, compare the filled histograms to solid line histograms in the panels labeled Erk1/2 for monocytes and lymphocytes).
Discussion
Growing evidence suggests that inflammation facilitates the transformation of tumors to more aggressive and invasive types 38-40. Elevated levels of pro-inflammatory cytokines in some tumors correlate with poor prognosis and the development of chemo-resistance 38, 41-43. Cytokine-triggered activation of cancer cells results in the expression of a variety of proteins, which facilitate cancer cell survival, motility, and proliferation 39. Furthermore, in addition to the effects on cancer cells, pro-inflammatory cytokines change a tumor’s microenvironment by recruiting a variety of cells to support inflammation and induce tumor vascularization 44. It was previously shown that the presence of chemokine IL-8 in a tumor’s microenvironment facilitates neovascularization by inducing the proliferation and growth of endothelial cells, and by mimicking the activity of vascular endothelial growth factor (VEGF) 21. The inhibition of IL-8 activity in RasV12-expressing tumors results in reduced tumor vascularization followed by massive tumor necrosis 45. It was also shown that IL-1β induces neovascularization of tumors through indirect induction of VEGF 46, and it protects pancreatic cancer from drug-induced apoptosis through up-regulation of cyclooxigenase-2 (COX-2) 47. Another cytokine, TNF-α, when produced by a variety of tumors, promotes their invasive growth and supports metastatic activity of cancer cells 39, 48. In light of these data, an understanding of cytokine induction by excipients and carriers of cytotoxic oncology drugs is crucial for the development of both safe and effective medicines.
Earlier studies by several independent research groups have suggested that cytotoxic oncology drug paclitaxel induces pro-inflammatory cytokines through the same signaling pathway as the one triggered by bacterial LPS, and have named TLR-4 as the key receptor initiating cytokine response to Taxol® 8, 9, 16, 17, 22. Activating the TLR-4 signaling pathways with paclitaxel was reported to require the presence of MD-2 in the receptor complex, and the difference between human and murine cell response to paclitaxel was attributed to the differences in the MD-2 protein 24, 49. The engagement of the TLR-4/MD-2 pathway correlated with the development of chemoresistance in cancer cell lines 50, 51. Activating TLR-4 with paclitaxel resulted in the recruitment of MyD88, induction of anti-apoptotic proteins X-linked inhibitor of apoptosis, Bcl-2, and Bcl-XL, and activation of pro-survival pathways, ultimately leading to increased cancer cell resistance to chemotherapy 52-54. According to several studies, paclitaxel activated the expression of the IL-12, TNF-α, IP-10, COX-2, IL-8, IL-1β, and IL-6 genes in macrophages, and this pro-inflammatory cytokine expression pattern was identical to that of the LPS 9, 11, 17, 51. However, it is important to note here that despite using paclitaxel dissolved in DMSO, the majority of the previous studies have used the term “Taxol.” Moreover, using the words “Taxol” and “paclitaxel” interchangeably resulted in confusion in the current literature, which complicated the interpretation of the research findings between various studies. Remembering this nuance is important for interpreting and understanding the novelty of our data.
Herein we report that 1) neither Taxol® nor Cremophor-EL induced pro-inflammatory cytokines in mouse macrophages; 2) consistent with previous reports, paclitaxel dissolved in DMSO induced cytokines in mouse cells; 3) Cremophor-EL inhibited cytokine secretion triggered by paclitaxel-DMSO in mouse cells; 4) the induction of cytokines in mouse cells was also observed with another Cremophor-EL-free formulation of paclitaxel, Abraxane®; 5) in contrast to mouse cells, Abraxane® does not induce inflammatory cytokines in human PBMCs and whole blood; 6) human PBMCs do not produce TNF-α and IL-1β in response to Taxol®; 7) Taxol® and its vehicle Cremophor-EL induce IL-8 in human PBMCs and whole blood; 8) the process of IL-8 induction by Cremophor-EL in human cells occurs through a mechanism bypassing gene expression, and the mechanism involves oxidative stress and activation of MAPK p38. Our study emphasizes the importance of distinguishing between a drug and a drug formulation, which may contain other components in addition to the drug. Specifically, it is important to remember that excipients commonly used to formulate drugs may not be inert and may account for toxicities. For example, in this study, we show that a cytokine profile differs significantly between a drug and the drug formulated using an excipient. Moreover, we show that such effects of the drug and the excipient are different between mouse and human cells. This difference has an important contribution to translational nanomedicine, because mice are commonly used in preclinical exploratory in vivo studies.
Our results demonstrating that Cremophor-EL does not induce synthesis of IL-8 mRNA are consistent with previous studies reporting the presence of intracellular storage of the IL-8 protein inside the cell 55, 56. Our data with the LPS are in line with this model and show quick release of the pre-synthesized IL-8 after 2 h of LPS challenge (Figure 3, C). Nevertheless, our data also demonstrate that such a release of the pre-synthesized protein does not occur after Cremophor-EL treatment (Figure 3, C). Instead, the cells use pre-synthesized mRNA to produce a new protein in response to the Cremophor-EL treatment (Figure 4, A and B), and the induction of oxidative stress followed by the activation of the p38 MAPK pathway is the key driver of this process (Figures 5 and 8, respectively). Indirect confirmation of the oxidative stress induced by Cremophor-EL is provided by our protein-DNA-binding array data demonstrating the activation of transcription factors specific to various oxidative stress pathways (Supplementary Figure 4). A connection between oxidative stress and IL-8 secretion has been noted before 57. Our study is the first to show that inducing oxidative stress by Cremophor-EL leads to the activation of the p38 MAPK pathway, which, in turn, drives expression of the pre-synthesized mRNA. Investigating the mechanism of mRNA stabilization by Cremophor-EL was out of the scope of the present study.
In summary, we demonstrated that when paclitaxel is formulated using the traditional vehicle Cremophor-EL, it induces pro-inflammatory marker IL-8, but when it is reformulated using nano-albumin particles, this reformulation eliminates these negative effects. Our study compliments a set of existing data demonstrating a better safety profile for Abraxane® than Taxol®. In addition, we clarified the existing confusion in the literature regarding the pro-inflammatory properties of Taxol® in mouse cells. Our data also showed that using mouse cells to study Abraxane® is irrelevant to the immunological safety of this formulation in human cells. Finally, we demonstrated for the first time that the mechanism by which Cremophor-EL induces production of the IL-8 protein bypasses mRNA synthesis, occurs via post-transcriptional regulation of pre-existing mRNA, and involves activation of the p38 MAPK pathway by oxidative stress.
Supplementary Material
Acknowledgements
The content of this publication does not necessarily reflect the views or policies of the Department of Health and Human Services, nor does mention of trade names, commercial products, or organizations imply endorsement by the U.S. Government.
Funding: This project has been funded in whole or in part with federal funds from the Frederick National Laboratory for Cancer Research, National Institutes of Health, under contract HHSN261200800001E.
List of abbreviations
- CHX
cycloheximide
- DMSO
dimethyl sulfoxide
- IL
interleukin
- LPS
lipopolysaccharide
- MAPK
mitogen-activated protein kinase
- MIP-2
macrophage inflammatory protein 2
- NAC
N-acetyl cysteine
- PBMCs
peripheral blood mononuclear cells
- TLR-4
toll-like receptor-4
- TNF-α
tumor necrosis factor α
Footnotes
Publisher's Disclaimer: This is a PDF file of an unedited manuscript that has been accepted for publication. As a service to our customers we are providing this early version of the manuscript. The manuscript will undergo copyediting, typesetting, and review of the resulting proof before it is published in its final citable form. Please note that during the production process errors may be discovered which could affect the content, and all legal disclaimers that apply to the journal pertain.
Conflict of Interest: The authors have no conflicts to disclose.
References
- 1.Nehate C, Jain S, Saneja A, Khare V, Alam N, Dubey R, et al. Paclitaxel Formulations: Challenges and Novel Delivery Options. Curr Drug Deliv. 2014 doi: 10.2174/1567201811666140609154949. [DOI] [PubMed] [Google Scholar]
- 2.Gelderblom H, Verweij J, Nooter K, Sparreboom A. Cremophor EL: the drawbacks and advantages of vehicle selection for drug formulation. Eur J Cancer. 2001;37:1590–8. doi: 10.1016/s0959-8049(01)00171-x. [DOI] [PubMed] [Google Scholar]
- 3.Szebeni J, Muggia FM, Alving CR. Complement activation by Cremophor EL as a possible contributor to hypersensitivity to paclitaxel: an in vitro study. J Natl Cancer Inst. 1998;90:300–6. doi: 10.1093/jnci/90.4.300. [DOI] [PubMed] [Google Scholar]
- 4.Gradishar WJ, Tjulandin S, Davidson N, Shaw H, Desai N, Bhar P, et al. Phase III trial of nanoparticle albumin-bound paclitaxel compared with polyethylated castor oil-based paclitaxel in women with breast cancer. J Clin Oncol. 2005;23:7794–803. doi: 10.1200/JCO.2005.04.937. [DOI] [PubMed] [Google Scholar]
- 5.Dobrovolskaia MA, McNeil SE. In vitro assays for monitoring nanoparticle intreaction with components of the immune system. In: Yarmush ML, Shi D, editors. Handbook of immunological properties of engeenered nanomaterials. World Scientific Publishing; Singapore: 2013. pp. 581–639. [Google Scholar]
- 6.Weiszhar Z, Czucz J, Revesz C, Rosivall L, Szebeni J, Rozsnyay Z. Complement activation by polyethoxylated pharmaceutical surfactants: Cremophor-EL, Tween-80 and Tween-20. Eur J Pharm Sci. 2012;45:492–8. doi: 10.1016/j.ejps.2011.09.016. [DOI] [PubMed] [Google Scholar]
- 7.Szebeni J, Alving CR, Savay S, Barenholz Y, Priev A, Danino D, et al. Formation of complement-activating particles in aqueous solutions of Taxol: possible role in hypersensitivity reactions. Int Immunopharmacol. 2001;1:721–35. doi: 10.1016/s1567-5769(01)00006-6. [DOI] [PubMed] [Google Scholar]
- 8.Manthey CL, Qureshi N, Stutz PL, Vogel SN. Lipopolysaccharide antagonists block taxol-induced signaling in murine macrophages. J Exp Med. 1993;178:695–702. doi: 10.1084/jem.178.2.695. [DOI] [PMC free article] [PubMed] [Google Scholar]
- 9.Perera PY, Mayadas TN, Takeuchi O, Akira S, Zaks-Zilberman M, Goyert SM, et al. CD11b/CD18 acts in concert with CD14 and Toll-like receptor (TLR) 4 to elicit full lipopolysaccharide and taxol-inducible gene expression. J Immunol. 2001;166:574–81. doi: 10.4049/jimmunol.166.1.574. [DOI] [PubMed] [Google Scholar]
- 10.Manthey CL, Brandes ME, Perera PY, Vogel SN. Taxol increases steady-state levels of lipopolysaccharide-inducible genes and protein-tyrosine phosphorylation in murine macrophages. J Immunol. 1992;149:2459–65. [PubMed] [Google Scholar]
- 11.Ding AH, Porteu F, Sanchez E, Nathan CF. Shared actions of endotoxin and taxol on TNF receptors and TNF release. Science. 1990;248:370–2. doi: 10.1126/science.1970196. [DOI] [PubMed] [Google Scholar]
- 12.Perera PY, Vogel SN, Detore GR, Haziot A, Goyert SM. CD14-dependent and CD14-independent signaling pathways in murine macrophages from normal and CD14 knockout mice stimulated with lipopolysaccharide or taxol. J Immunol. 1997;158:4422–9. [PubMed] [Google Scholar]
- 13.Kawasaki K, Akashi S, Shimazu R, Yoshida T, Miyake K, Nishijima M. Involvement of TLR4/MD-2 complex in species-specific lipopolysaccharide-mimetic signal transduction by Taxol. J Endotoxin Res. 2001;7:232–6. [PubMed] [Google Scholar]
- 14.O'Brien JM, Jr., Wewers MD, Moore SA, Allen JN. Taxol and colchicine increase LPS-induced pro-IL-1 beta production, but do not increase IL-1 beta secretion. A role for microtubules in the regulation of IL-1 beta production. J Immunol. 1995;154:4113–22. [PubMed] [Google Scholar]
- 15.Bhat N, Perera PY, Carboni JM, Blanco J, Golenbock DT, Mayadas TN, et al. Use of a photoactivatable taxol analogue to identify unique cellular targets in murine macrophages: identification of murine CD18 as a major taxol-binding protein and a role for Mac-1 in taxol-induced gene expression. J Immunol. 1999;162:7335–42. [PubMed] [Google Scholar]
- 16.Byrd-Leifer CA, Block EF, Takeda K, Akira S, Ding A. The role of MyD88 and TLR4 in the LPS-mimetic activity of Taxol. Eur J Immunol. 2001;31:2448–57. doi: 10.1002/1521-4141(200108)31:8<2448::aid-immu2448>3.0.co;2-n. [DOI] [PubMed] [Google Scholar]
- 17.Zaks-Zilberman M, Zaks TZ, Vogel SN. Induction of proinflammatory and chemokine genes by lipopolysaccharide and paclitaxel (Taxol) in murine and human breast cancer cell lines. Cytokine. 2001;15:156–65. doi: 10.1006/cyto.2001.0935. [DOI] [PubMed] [Google Scholar]
- 18.Dinarello CA. Proinflammatory cytokines. Chest. 2000;118:503–8. doi: 10.1378/chest.118.2.503. [DOI] [PubMed] [Google Scholar]
- 19.Dinarello CA. Interleukin-1 in the pathogenesis and treatment of inflammatory diseases. Blood. 2011;117:3720–32. doi: 10.1182/blood-2010-07-273417. [DOI] [PMC free article] [PubMed] [Google Scholar]
- 20.Aggarwal BB, Gupta SC, Kim JH. Historical perspectives on tumor necrosis factor and its superfamily: 25 years later, a golden journey. Blood. 2012;119:651–65. doi: 10.1182/blood-2011-04-325225. [DOI] [PMC free article] [PubMed] [Google Scholar]
- 21.Gales D, Clark C, Manne U, Samuel T. The Chemokine CXCL8 in Carcinogenesis and Drug Response. ISRN Oncol. 2013;2013:859154. doi: 10.1155/2013/859154. [DOI] [PMC free article] [PubMed] [Google Scholar]
- 22.Henricson BE, Carboni JM, Burkhardt AL, Vogel SN. LPS and Taxol activate Lyn kinase autophosphorylation in Lps(n), but not in Lpsd), macrophages. Mol Med. 1995;1:428–35. [PMC free article] [PubMed] [Google Scholar]
- 23.Allen JN, Moore SA, Wewers MD. Taxol enhances but does not induce interleukin-1 beta and tumor necrosis factor-alpha production. J Lab Clin Med. 1993;122:374–81. [PubMed] [Google Scholar]
- 24.Zimmer SM, Liu J, Clayton JL, Stephens DS, Snyder JP. Paclitaxel binding to human and murine MD-2. J Biol Chem. 2008;283:27916–26. doi: 10.1074/jbc.M802826200. [DOI] [PMC free article] [PubMed] [Google Scholar]
- 25.Piro S, Anello M, Di Pietro C, Lizzio MN, Patane G, Rabuazzo AM, et al. Chronic exposure to free fatty acids or high glucose induces apoptosis in rat pancreatic islets: possible role of oxidative stress. Metabolism. 2002;51:1340–7. doi: 10.1053/meta.2002.35200. [DOI] [PubMed] [Google Scholar]
- 26.Schrader M, Fahimi HD. Peroxisomes and oxidative stress. Biochim Biophys Acta. 2006;1763:1755–66. doi: 10.1016/j.bbamcr.2006.09.006. [DOI] [PubMed] [Google Scholar]
- 27.Said T, Dutot M, Christon R, Beaudeux JL, Martin C, Warnet JM, et al. Benefits and side effects of different vegetable oil vectors on apoptosis, oxidative stress, and P2X7 cell death receptor activation. Invest Ophthalmol Vis Sci. 2007;48:5000–6. doi: 10.1167/iovs.07-0229. [DOI] [PubMed] [Google Scholar]
- 28.Allen RG, Tresini M. Oxidative stress and gene regulation. Free Radic Biol Med. 2000;28:463–99. doi: 10.1016/s0891-5849(99)00242-7. [DOI] [PubMed] [Google Scholar]
- 29.Dean JL, Sully G, Clark AR, Saklatvala J. The involvement of AU-rich element-binding proteins in p38 mitogen-activated protein kinase pathway-mediated mRNA stabilisation. Cell Signal. 2004;16:1113–21. doi: 10.1016/j.cellsig.2004.04.006. [DOI] [PubMed] [Google Scholar]
- 30.Hitti E, Iakovleva T, Brook M, Deppenmeier S, Gruber AD, Radzioch D, et al. Mitogen-activated protein kinase-activated protein kinase 2 regulates tumor necrosis factor mRNA stability and translation mainly by altering tristetraprolin expression, stability, and binding to adenine/uridine-rich element. Mol Cell Biol. 2006;26:2399–407. doi: 10.1128/MCB.26.6.2399-2407.2006. [DOI] [PMC free article] [PubMed] [Google Scholar]
- 31.Hoffmann E, Dittrich-Breiholz O, Holtmann H, Kracht M. Multiple control of interleukin-8 gene expression. J Leukoc Biol. 2002;72:847–55. [PubMed] [Google Scholar]
- 32.Albanyan EA, Vallejo JG, Smith CW, Edwards MS. Nonopsonic binding of type III Group B Streptococci to human neutrophils induces interleukin-8 release mediated by the p38 mitogen-activated protein kinase pathway. Infect Immun. 2000;68:2053–60. doi: 10.1128/iai.68.4.2053-2060.2000. [DOI] [PMC free article] [PubMed] [Google Scholar]
- 33.Muselet-Charlier C, Roque T, Boncoeur E, Chadelat K, Clement A, Jacquot J, et al. Enhanced IL-1beta-induced IL-8 production in cystic fibrosis lung epithelial cells is dependent of both mitogen-activated protein kinases and NF-kappaB signaling. Biochem Biophys Res Commun. 2007;357:402–7. doi: 10.1016/j.bbrc.2007.03.141. [DOI] [PubMed] [Google Scholar]
- 34.Bhattacharyya S, Gutti U, Mercado J, Moore C, Pollard HB, Biswas R. MAPK signaling pathways regulate IL-8 mRNA stability and IL-8 protein expression in cystic fibrosis lung epithelial cell lines. Am J Physiol Lung Cell Mol Physiol. 2011;300:L81–7. doi: 10.1152/ajplung.00051.2010. [DOI] [PMC free article] [PubMed] [Google Scholar]
- 35.Katome T, Namekata K, Guo X, Semba K, Kittaka D, Kawamura K, et al. Inhibition of ASK1-p38 pathway prevents neural cell death following optic nerve injury. Cell Death Differ. 2013;20:270–80. doi: 10.1038/cdd.2012.122. [DOI] [PMC free article] [PubMed] [Google Scholar]
- 36.Chow S, Patel H, Hedley DW. Measurement of MAP kinase activation by flow cytometry using phospho-specific antibodies to MEK and ERK: potential for pharmacodynamic monitoring of signal transduction inhibitors. Cytometry. 2001;46:72–8. doi: 10.1002/cyto.1067. [DOI] [PubMed] [Google Scholar]
- 37.Tan Z, Qian X, Jiang R, Liu Q, Wang Y, Chen C, et al. IL-17A plays a critical role in the pathogenesis of liver fibrosis through hepatic stellate cell activation. J Immunol. 2013;191:1835–44. doi: 10.4049/jimmunol.1203013. [DOI] [PubMed] [Google Scholar]
- 38.Freund A, Chauveau C, Brouillet JP, Lucas A, Lacroix M, Licznar A, et al. IL-8 expression and its possible relationship with estrogen-receptor-negative status of breast cancer cells. Oncogene. 2003;22:256–65. doi: 10.1038/sj.onc.1206113. [DOI] [PMC free article] [PubMed] [Google Scholar]
- 39.Sethi G, Shanmugam MK, Ramachandran L, Kumar AP, Tergaonkar V. Multifaceted link between cancer and inflammation. Biosci Rep. 2012;32:1–15. doi: 10.1042/BSR20100136. [DOI] [PubMed] [Google Scholar]
- 40.Cheng XS, Li YF, Tan J, Sun B, Xiao YC, Fang XB, et al. CCL20 and CXCL8 synergize to promote progression and poor survival outcome in patients with colorectal cancer by collaborative induction of the epithelial-mesenchymal transition. Cancer Lett. 2014;348:77–87. doi: 10.1016/j.canlet.2014.03.008. [DOI] [PubMed] [Google Scholar]
- 41.Veltri RW, Miller MC, Zhao G, Ng A, Marley GM, Wright GL, Jr., et al. Interleukin-8 serum levels in patients with benign prostatic hyperplasia and prostate cancer. Urology. 1999;53:139–47. doi: 10.1016/s0090-4295(98)00455-5. [DOI] [PubMed] [Google Scholar]
- 42.Ferrajoli A, Keating MJ, Manshouri T, Giles FJ, Dey A, Estrov Z, et al. The clinical significance of tumor necrosis factor-alpha plasma level in patients having chronic lymphocytic leukemia. Blood. 2002;100:1215–9. [PubMed] [Google Scholar]
- 43.Wang Y, Qu Y, Niu XL, Sun WJ, Zhang XL, Li LZ. Autocrine production of interleukin-8 confers cisplatin and paclitaxel resistance in ovarian cancer cells. Cytokine. 2011;56:365–75. doi: 10.1016/j.cyto.2011.06.005. [DOI] [PubMed] [Google Scholar]
- 44.Coussens LM, Werb Z. Inflammation and cancer. Nature. 2002;420:860–7. doi: 10.1038/nature01322. [DOI] [PMC free article] [PubMed] [Google Scholar]
- 45.Sparmann A, Bar-Sagi D. Ras-induced interleukin-8 expression plays a critical role in tumor growth and angiogenesis. Cancer Cell. 2004;6:447–58. doi: 10.1016/j.ccr.2004.09.028. [DOI] [PubMed] [Google Scholar]
- 46.Jung YJ, Isaacs JS, Lee S, Trepel J, Neckers L. IL-1beta-mediated up-regulation of HIF-1alpha via an NFkappaB/COX-2 pathway identifies HIF-1 as a critical link between inflammation and oncogenesis. FASEB J. 2003;17:2115–7. doi: 10.1096/fj.03-0329fje. [DOI] [PubMed] [Google Scholar]
- 47.Angst E, Reber HA, Hines OJ, Eibl G. Mononuclear cell-derived interleukin-1 beta confers chemoresistance in pancreatic cancer cells by upregulation of cyclooxygenase-2. Surgery. 2008;144:57–65. doi: 10.1016/j.surg.2008.03.024. [DOI] [PMC free article] [PubMed] [Google Scholar]
- 48.Bigatto V, De Bacco F, Casanova E, Reato G, Lanzetti L, Isella C, et al. TNF-alpha promotes invasive growth through the MET signaling pathway. Mol Oncol. 2014 doi: 10.1016/j.molonc.2014.09.002. [DOI] [PMC free article] [PubMed] [Google Scholar]
- 49.Kawasaki K, Akashi S, Shimazu R, Yoshida T, Miyake K, Nishijima M. Mouse toll-like receptor 4.MD-2 complex mediates lipopolysaccharide-mimetic signal transduction by Taxol. J Biol Chem. 2000;275:2251–4. doi: 10.1074/jbc.275.4.2251. [DOI] [PubMed] [Google Scholar]
- 50.Rajput S, Volk-Draper LD, Ran S. TLR4 is a novel determinant of the response to paclitaxel in breast cancer. Mol Cancer Ther. 2013;12:1676–87. doi: 10.1158/1535-7163.MCT-12-1019. [DOI] [PMC free article] [PubMed] [Google Scholar]
- 51.Wang AC, Ma YB, Wu FX, Ma ZF, Liu NF, Gao R, et al. TLR4 induces tumor growth and inhibits paclitaxel activity in MyD88-positive human ovarian carcinoma. Oncol Lett. 2014;7:871–877. doi: 10.3892/ol.2013.1759. [DOI] [PMC free article] [PubMed] [Google Scholar]
- 52.Kelly MG, Alvero AB, Chen R, Silasi DA, Abrahams VM, Chan S, et al. TLR-4 signaling promotes tumor growth and paclitaxel chemoresistance in ovarian cancer. Cancer Res. 2006;66:3859–68. doi: 10.1158/0008-5472.CAN-05-3948. [DOI] [PubMed] [Google Scholar]
- 53.Aggarwal BB, Shishodia S, Takada Y, Banerjee S, Newman RA, Bueso-Ramos CE, et al. Curcumin suppresses the paclitaxel-induced nuclear factor-kappaB pathway in breast cancer cells and inhibits lung metastasis of human breast cancer in nude mice. Clin Cancer Res. 2005;11:7490–8. doi: 10.1158/1078-0432.CCR-05-1192. [DOI] [PubMed] [Google Scholar]
- 54.Wang AC, Su QB, Wu FX, Zhang XL, Liu PS. Role of TLR4 for paclitaxel chemotherapy in human epithelial ovarian cancer cells. Eur J Clin Invest. 2009;39:157–64. doi: 10.1111/j.1365-2362.2008.02070.x. [DOI] [PubMed] [Google Scholar]
- 55.Miskolci V, Hodgson L, Cox D, Vancurova I. Western analysis of intracellular interleukin-8 in human mononuclear leukocytes. Methods Mol Biol. 2014;1172:285–93. doi: 10.1007/978-1-4939-0928-5_26. [DOI] [PMC free article] [PubMed] [Google Scholar]
- 56.Siddiqui RA, Akard LP, Garcia JG, Cui Y, English D. Chemotactic migration triggers IL-8 generation in neutrophilic leukocytes. J Immunol. 1999;162:1077–83. [PubMed] [Google Scholar]
- 57.DeForge LE, Fantone JC, Kenney JS, Remick DG. Oxygen radical scavengers selectively inhibit interleukin 8 production in human whole blood. J Clin Invest. 1992;90:2123–9. doi: 10.1172/JCI116097. [DOI] [PMC free article] [PubMed] [Google Scholar]
Associated Data
This section collects any data citations, data availability statements, or supplementary materials included in this article.


