Abstract
The incretin hormones, glucose-dependent insulinotropic polypeptide (GIP) and glucagon-like peptide-1 (GLP-1), enhance postprandial insulin secretion, promote adipogenesis, and regulate gastrointestinal motility and food intake. To date, a consensus on how the incretin response is altered in obesity is lacking. We investigated the effects of chronic high-fat (HF) feeding on incretin secretion in the lymph fistula rat model. Male Sprague-Dawley rats (8 wk) were provided a semipurified AIN93M HF or low-fat (LF) diet ad libitum for 3 or 13 wk; a HF pair-fed (HF-PF) group was included as a control during the 3-wk feeding trial. Energy intake, body weight, and body composition were regularly monitored. At the culmination of the feeding period, an intestinal lymphatic duct cannula and duodenal infusion tube were installed. All animals were challenged with a 3-ml Ensure bolus (3.125 kcal/animal) to measure lymphatic incretin secretion. Despite a significantly higher energy intake, both the 3-wk and 13-wk HF-fed animals did not have an increase in body weight and only a slight increase in body fat compared with LF-fed rats. Following the duodenal Ensure challenge, the 3-wk and 13-wk HF-fed rats had significantly greater lymphatic GIP and GLP-1 secretion than the LF-fed animals. Additionally, the HF-PF group displayed a secretion profile similar to the HF-fed animals for GIP but a similar pattern to the LF-fed animals for GLP-1. The HF-PF data suggest that the increased GIP secretion is driven by the greater percentage of fat intake, whereas the increased GLP-1 secretion is driven by the excess caloric intake.
Keywords: glucose-dependent insulinotropic polypeptide, glucagon-like peptide-1, lymph fistula rat model, high-fat diet, incretin
obesity is an expanding global health problem. It is estimated worldwide that 1.6 billion adults are overweight [body mass index (BMI) > 25 kg/m2] and 400 million additional adults are obese (BMI > 30 kg/m2). Between the years 1980 and 2004, the prevalence of obesity in the US increased from 15 to 33% in adults and from 6 to 19% in children (29). In addition to increasing health care costs (10), obesity is associated with several comorbidities (16), many of which are mediated through insulin resistance and glucose intolerance, such as Type 2 diabetes, nonalcoholic fatty liver disease, cardiovascular disease, and metabolic syndrome.
The incretin hormones, glucose-dependent insulinotropic polypeptide (GIP) and glucagon-like peptide-1 (GLP-1), are secreted from the enteroendocrine K and L cells, respectively, in response to ingested nutrients. The main function of GIP and GLP-1 is to enhance postprandial insulin secretion. Both incretin hormones also upregulate pancreatic β-cell insulin gene transcription and biosynthesis, stimulate β-cell proliferation, and reduce β-cell apoptosis (3, 17, 44). GLP-1 additionally improves glycemic control by regulating food intake (15, 38) and decreasing gastrointestinal motility (25, 28, 36), thereby reducing the delivery of absorbed nutrients to the circulation over time. On the other hand, signaling through the GIP receptor promotes fat deposition by enhancing adipogenesis (12).
Impairments of the incretin response in patients with Type 2 diabetes have been well documented. Several studies (27, 39, 41) have reported decreased postprandial GLP-1 secretion. In contrast, GIP secretion from enteroendocrine cells in Type 2 diabetic patients is normal or slightly elevated. These patients do, however, present with impaired insulinotropic effects of GIP at the pancreatic β-cells (8, 26, 27). The attenuated GLP-1 secretion and compromised GIP function contribute to the pathology of Type 2 diabetes. Because the glucoregulatory properties of GLP-1, unlike those of GIP, are still functional in insulin-resistant individuals, therapeutic strategies have focused on the development of GLP-1 receptor agonists.
Despite the established evidence supporting the impaired incretin response in diabetic patients, this effect is not wholly agreed upon in obesity. In obese, nondiabetic humans, GIP secretion has been reported to increase (11, 42) or not change (30, 31, 40), whereas GLP-1 secretion remains unchanged (1, 9, 11, 31, 42) or is attenuated (24, 30, 31, 37, 40). The reasons for these variations are complex and may be partly due to the wide array of immunoassays and test meals used in the studies. Additionally, the nutritional status of the subjects prior to experimentation is rarely stated; therefore it is difficult to determine whether prior eating habits have any potential effects on incretin secretion. From the available data, it is currently unclear whether, and how, incretin secretion is affected by obesity. Furthermore, it is unclear whether the alterations are caused by obesity or the high-energy diet that often induces obesity. In this study, we tested the hypothesis that chronic high-fat (HF) feeding affects the secretion of the incretin hormones, GIP and GLP-1. To test this hypothesis, we measured GIP and GLP-1 levels following a mixed-meal challenge using the lymph fistula rat model in Sprague-Dawley rats chronically fed a HF diet for 3 or 13 wk. We further determined whether these effects were due to the increased consumption of calories or to the increased percentage of fat in the diet using a HF pair-fed (HF-PF) group.
METHODS
Animals.
Male Sprague-Dawley rats (7 wk) (Harlan Laboratories, Indianapolis, IN) were housed individually and maintained in a temperature- (21°C) and humidity-controlled (50%) room with a 12-h light-dark cycle. The animals were allowed free access to water and standard chow (Harlan Teklad 7012 Mouse/Rat Sterilizable Diet, Harlan Laboratories, Indianapolis, IN) during a 1-wk acclimatization period prior to placement into dietary groups on the basis of comparable mean body weights. All animal procedures and protocols were approved by the University of Cincinnati Institutional Animal Care and Use Committee (Cincinnati, OH).
Diets and experimental design.
The animals were provided one of two pelleted, semipurified nutritionally complete AIN93M experimental diets (D03082706) prepared by Research Diets (New Brunswick, NJ). The HF (HF) diet contained 20 g of fat/100 g of diet (19 g of butter oil and 1 g of soybean oil). The low-fat (LF) diet contained 4 g of fat/100 g of diet (3 g of butter oil and 1 g of soybean oil). The HF and LF diets differed only by fat and carbohydrate content as described previously (45). Because the emphasis in these experiments was on dietary fat, the amount of protein and all of the essential minerals and vitamins required for rats were equalized per kilojoule for the HF and LF diets.
In the first experiment, animals were provided ad libitum access to either the HF or LF diet for 13 wk. Body weight and energy intake were monitored every 2–3 days. Body composition was analyzed prior to initiation of the diet and then every other week until completion of the study. At the end of the 13-wk feeding period, the animals were challenged with a mixed meal in lymph fistula rat model installed with a duodenal infusion tube.
In the second experiment, the feeding period was reduced from 13 to 3 wk. This second group of animals was provided ad libitum access to either the HF or LF diet. Because HF-fed and LF-fed rats consume different amounts of calories per day, a HF-PF group was included as a control. The HF-PF animals were provided the HF diet but with a caloric content equivalent to the average daily consumption of the rats fed the LF diet ad libitum. The HF-PF group was included to clarify whether changes in incretin secretion are due to increased total energy intake or increased percentage of dietary fat. Body weight and energy intake were monitored every 2–3 days, and body composition was analyzed prior to diet initiation and at the completion of the 3-wk feeding period. At the end of the study, the animals underwent a mixed-meal challenge to measure the lymphatic secretion of the incretin hormones.
Body composition.
Body composition (lean and fat mass) was measured via an EchoMRI whole-body composition analyzer (Echo Medical Systems, Houston, TX). Body fat was calculated as percentage of body weight.
Blood sampling and analysis.
At the end of 3-wk feeding period, tail blood samples were collected after overnight fasting. Blood glucose levels were measured with a glucometer (Abbott, FreeStyle Lite). Plasma leptin and insulin were measured by ELISA according to the manufacturer's manual (EMD Millipore, MO).
Lymph fistula operation and recovery.
Prior to surgery, the animals were fasted overnight with free access to water. Under isoflurane anesthesia, the major mesenteric lymphatic duct was cannulated with polyvinyl chloride tubing (0.5 mm inner diameter, 0.8 mm outer diameter, Tyco Electronics, Castle Hill, Australia). Instead of suture, the cannula was secured with a drop of cyanoacrylate glue (Krazy Glue, Columbus, OH). A silicone feeding tube (1.02 mm inner diameter, 2.16 mm outer diameter, VWR International, West Chester, PA) was introduced into the stomach and advanced slightly beyond the pylorus into the duodenum. The feeding tube was secured in place with a purse-string ligature in the stomach. Both the lymph cannula and the duodenal feeding tube were exteriorized through the right flank; the abdomen was then closed in two layers by suturing. After surgery, the animals were placed in Bollman restraint cages and allowed to recover overnight (18–22 h). The animals were kept in a temperature-regulated chamber (28°C) to prevent hypothermia. To compensate for fluid and electrolyte loss due to lymphatic drainage, a 5% glucose-saline solution was infused into the duodenum at 3 ml/h for 6–7 h, followed by an overnight infusion of saline only at 3 ml/h.
Mixed-meal challenge and lymph collection.
Following an overnight recovery, the animals underwent a mixed-meal challenge to determine incretin secretion. Lymph was collected in a conical tube on ice for 1 h to establish fasting lymph output and incretin hormone secretion. The animals were then provided a 3 ml mixed-meal bolus of Ensure [Abbott Nutrition, Columbus, OH; 3.125 kcal/animal, 0.075 g fat (21.6%), 0.5 g carbohydrate (64.0%), 0.1125 g protein (14.4%)]. Thirty minutes following the nutrient bolus, a 0.9% saline infusion was provided at 3 ml/h for the remainder of the study period. Lymph samples were continuously collected on ice every 10 min for the first hour and then every hour thereafter following the mixed-meal bolus. Each sample contained 10% by volume of an antiproteolytic cocktail (0.25 M EDTA, 0.80 mg/ml aprotinin, 80 U/ml heparin).
GIP and GLP-1 measurements in lymph.
GIP and GLP-1 concentrations were determined by use of commercially available ELISA kits (EMD Millipore, St. Charles, MO). The GIP ELISA measures both active GIP(1–42) and nonactive GIP(3–42) and does not cross-react with glucagon, oxyntomodulin, GLP-1, or GLP-2. The GLP-1 ELISA measures biologically active GLP-1(7–37) and GLP 1(7–36)NH2 and does not cross-react with glucagon, GLP-2, or inactive GLP-1(9–37) and GLP-1(9–36)NH2.
DPP-IV activity in lymph.
Dipeptidyl peptidase IV (DPP-IV) was measured by an Activity Assay Kit (Sigma Aldrich, St. Louis, MO). In this assay, DPP-IV cleaves a nonfluorescent substrate, H-Gly-Pro-AMC, to release a fluorescent product, 7-amino-4-methyl coumarin (AMC) (excitation wavelength = 360/emission wavelength = 460 nm). DPP-IV activity is reported as pmol·min−1·ml−1 = microunit/ml. One unit of DPP-IV is defined as the amount of enzyme that will hydrolyze the DPP-IV substrate to yield 1.0 mmol of AMC per minute at 37°C.
Determination of GIP and GLP-1 content in intestinal segments.
After overnight fasting, the whole gut was isolated, washed with phosphate-buffered saline, and separated into proximal (first quarter of small intestine below the pylorus), mid (center quarter of the small intestine), and distal (last quarter of small intestine above the cecum) segments. Mucosa was scrapped and homogenized in acid-ethanol containing 74% ethanol with 0.15 M HCl [100% ethanol: sterile water: 12 N HCl 74:25:1 vol/vol solution (5 ml/g tissue)] for the determination of GIP and GLP-1 concentrations. The homogenized tissues were extracted overnight at 4°C and centrifuged at 12,000 g for 10 min. The resultant supernatants were then diluted with phosphate-buffered saline containing 1 mg/ml bovine serum albumin and total GIP and active GLP-1 levels in the supernatants were determined by ELISA (EMD Millipore).
Statistical analysis.
Energy intake, body weight, body composition, and hourly incretin concentrations were analyzed by two-way repeated-measures ANOVA. GIP and GLP-1 concentration area under the curve was calculated by use of the trapezoidal rule and analyzed by a Student's t-test for experiment 1 and one-way ANOVA for experiment 2. All other comparisons in experiment 2 were also analyzed by one-way ANOVA. Tukey's test was used for all ANOVA posttest analyses. Differences were considered significant if P < 0.05 (GraphPad Prism 6.0).
RESULTS
Experiment 1, 13-wk HF feeding: energy intake, body weight, body composition.
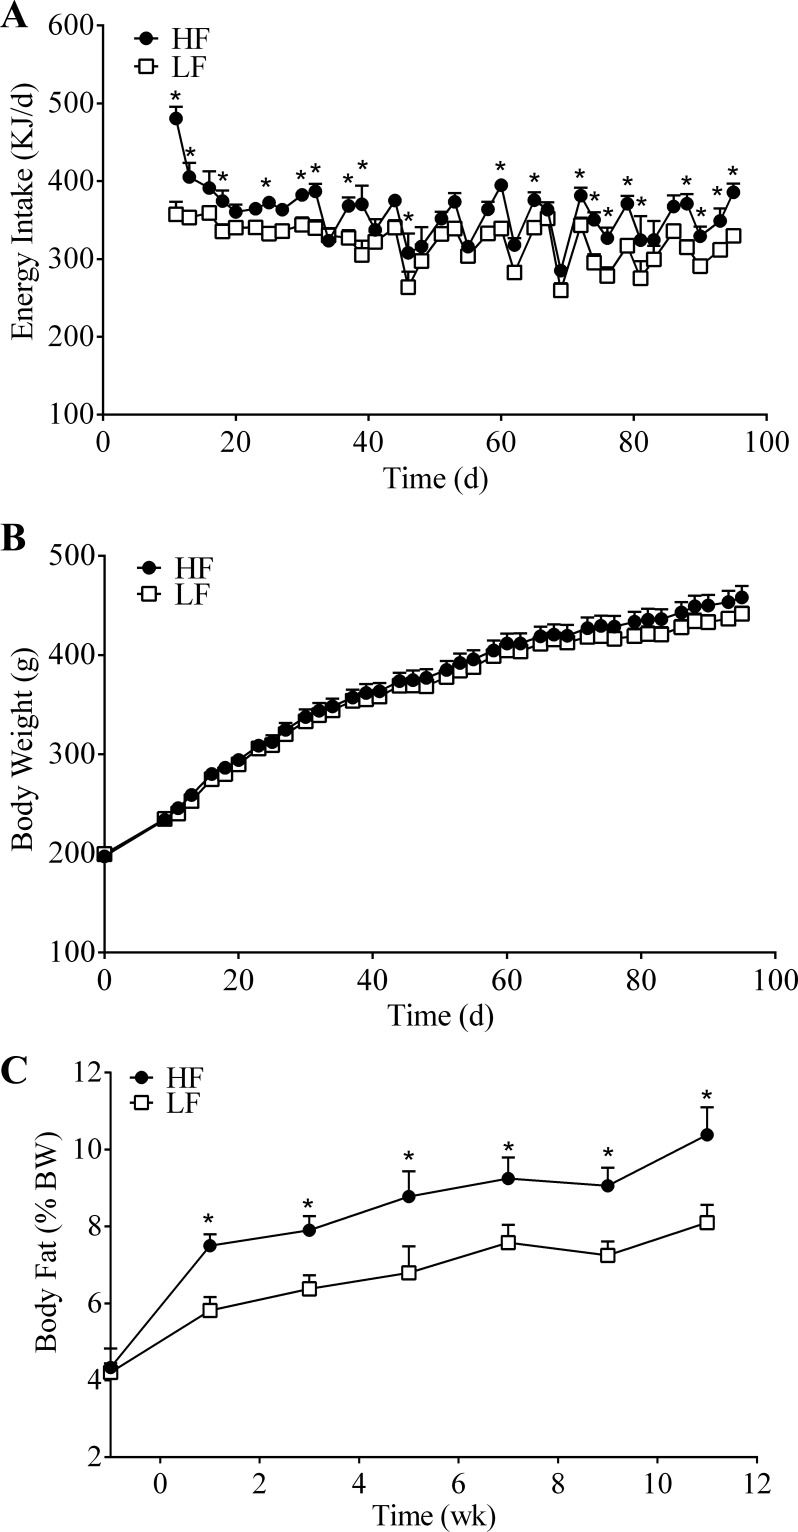
During the 13-wk feeding period, the HF-fed animals daily consumed more energy than the LF-fed animals (average daily energy intake: HF, 360 kJ vs. LF, 322 kJ); energy intake was significantly greater for the HF-fed animals at over 50% of the measured time points (Fig. 1A). Despite an increase in energy intake, the HF-fed animals did not weigh significantly different from the LF-fed animals during the entire 13-wk feeding period (final body weight: HF, 458.2 ± 11.5 g vs. LF, 441.7 ± 7.2 g; P = 0.154) (Fig. 1B). However, despite similar body weights, the HF group had a significantly greater body fat percentage than the LF group at all time points (final body fat measurement: HF, 10.4 ± 0.7% vs. LF, 8.1 ± 0.5%; P = 0.002) (Fig. 1C).
Fig. 1.
Energy intake (A), body weight (B), and body fat percentage (C) of rats fed a high-fat (HF; n = 8) or low-fat (LF; n = 8) diet ad libitum for 13 wk. Values are means + SE. *HF vs. LF; P < 0.05.
Experiment 1, 13-wk HF feeding: incretin secretion following a mixed-meal challenge.
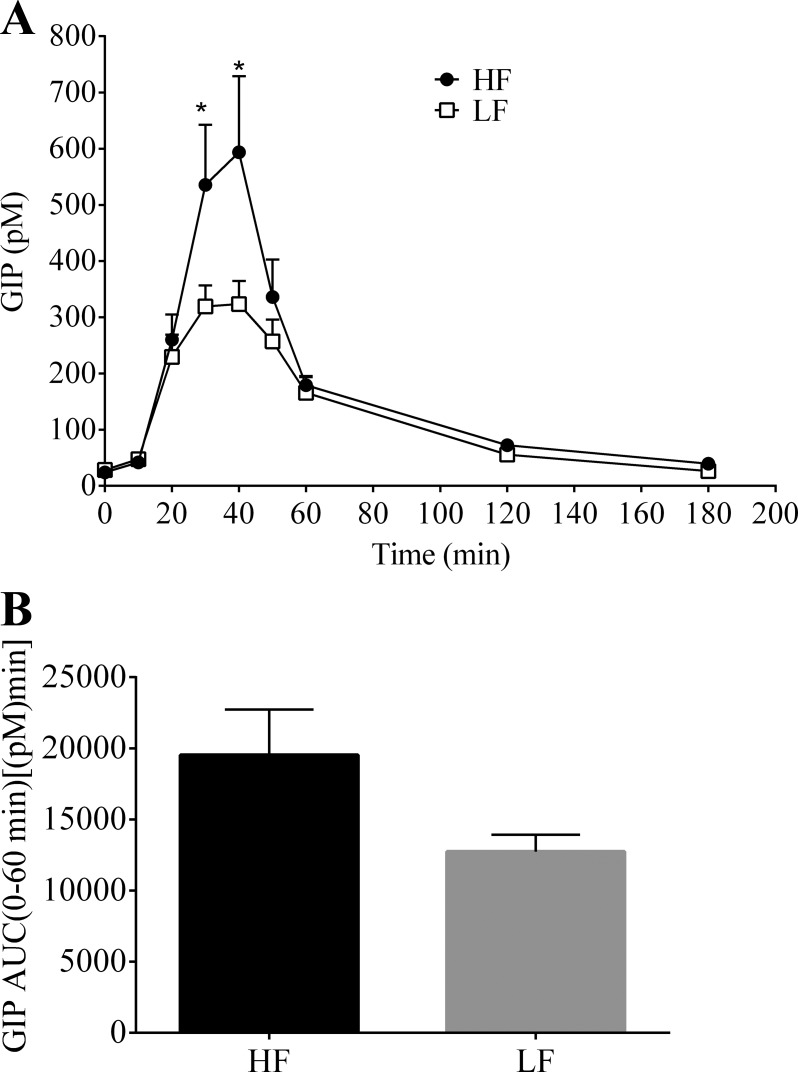
After 13 wk of dietary intervention, both groups of animals underwent the lymph fistula procedure to measure postprandial incretin secretion in response to a mixed-meal (Ensure, 3.125 kcal) bolus. The nutrient dose stimulated GIP secretion in both the HF- and LF-fed animals (Fig. 2). GIP secretion peaked at 40 min for both groups (HF, 593.7 ± 135.6 pM vs. LF, 323.5 ± 41.1 pM; P < 0.001) and returned to basal levels 180 min following the nutrient challenge (Fig. 2A). GIP concentration was significantly greater (∼1.75 times larger) at 30 and 40 min for the HF group compared with the LF group (30 min: HF, 535.5 ± 107.3 pM vs. LF, 319.1 ± 37.5 pM; P = 0.003). Although not significant, there was a trend toward increased overall (0–60 min) GIP secretion for the animals on the HF diet [HF, 19,527 ± 3,209 pM·min vs. LF, 12,737 ± 1,187 pM·min; P = 0.071] (Fig. 2B).
Fig. 2.
A: hourly lymphatic glucose-dependent insulinotropic polypeptide (GIP) concentration following a duodenal mixed-meal challenge (Ensure, 3.125 kcal) in rats fed a HF (n = 7) or LF (n = 7) diet for 13 wk. Lymph was collected continuously for 3 h. B: 0–60 min area under the curve (AUC). Values are means + SE. *HF vs. LF; P < 0.05.
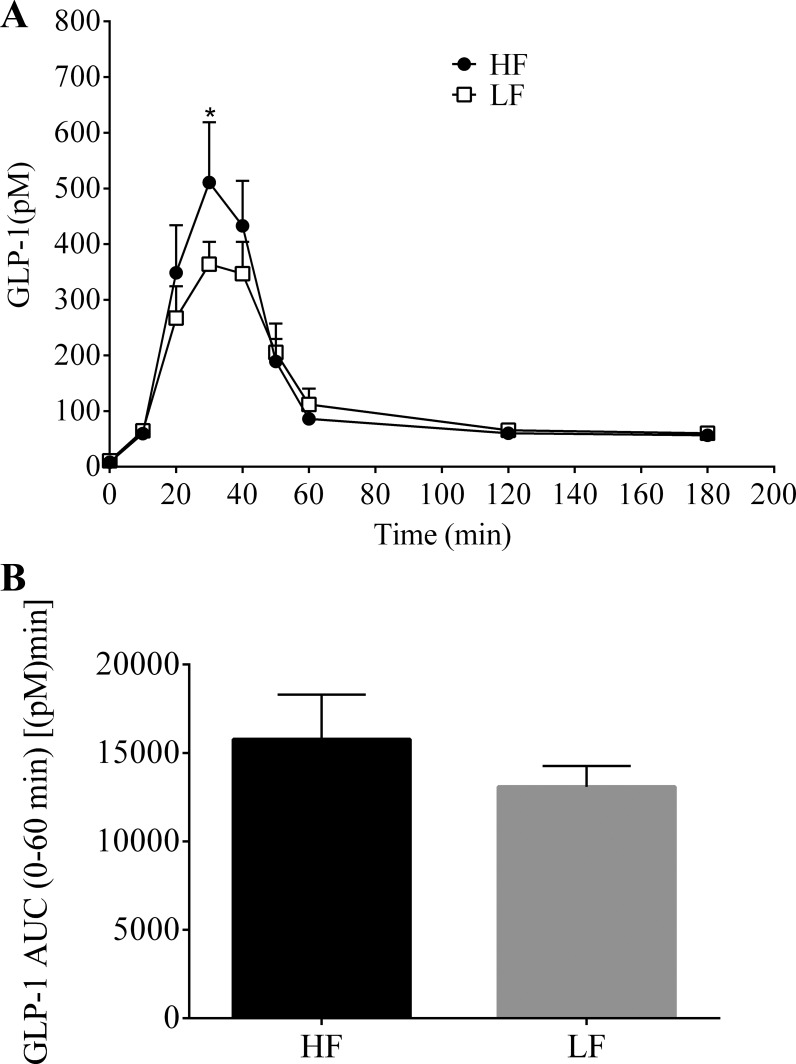
Lymphatic GLP-1 secretion was also stimulated following the mixed-meal challenge in both the HF- and LF-fed animals (Fig. 3). GLP-1 secretion peaked at 30 min and had returned to basal levels by the end of the 180-min collection period. The HF group had a significantly greater concentration of GLP-1 at the time of peak secretion compared with the LF group (HF, 510.8 ± 108.3 pM vs. LF, 363.8 ± 40.5 pM; P = 0.029). There was no significant difference of overall (0–60 min) GLP-1 secretion between the two groups [HF, 15,769 ± 2,532 pM·min vs. LF, 13,090 ± 1,182 pM·min; P = 0.357] (Fig. 3B).
Fig. 3.
A: hourly lymphatic glucagon-like peptide-1 (GLP-1) concentration following a duodenal mixed-meal challenge (Ensure, 3.125 kcal) in rats fed a HF (n = 7) or LF (n = 7) diet for 13 wk. Lymph was collected continuously for 3 h. B: 0–60 min AUC. Values are means + SE. *HF vs. LF; P < 0.05.
Experiment 2, 3-wk HF feeding: energy intake, body weight, body composition.
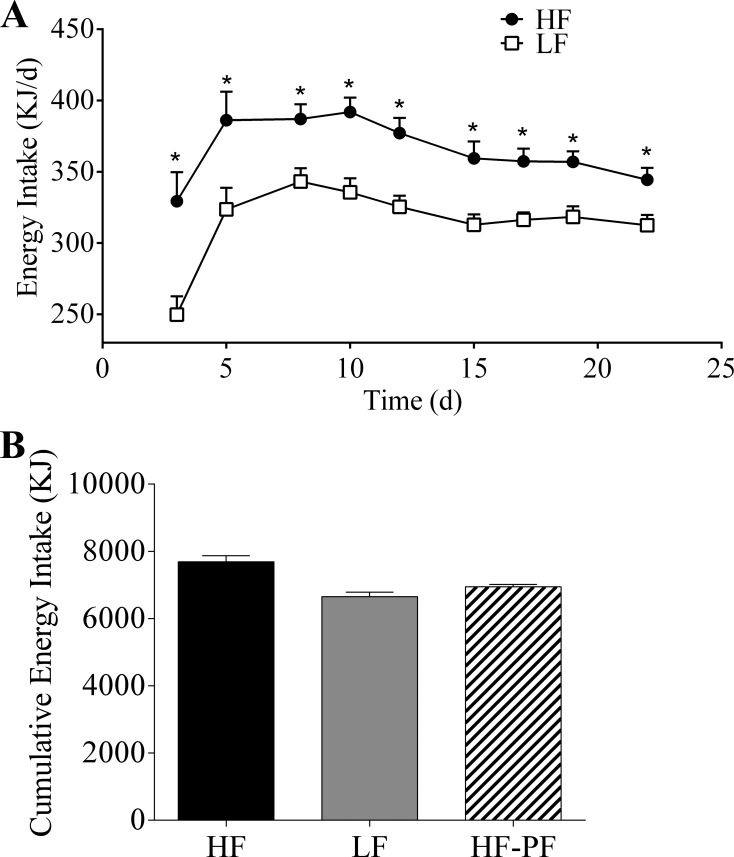
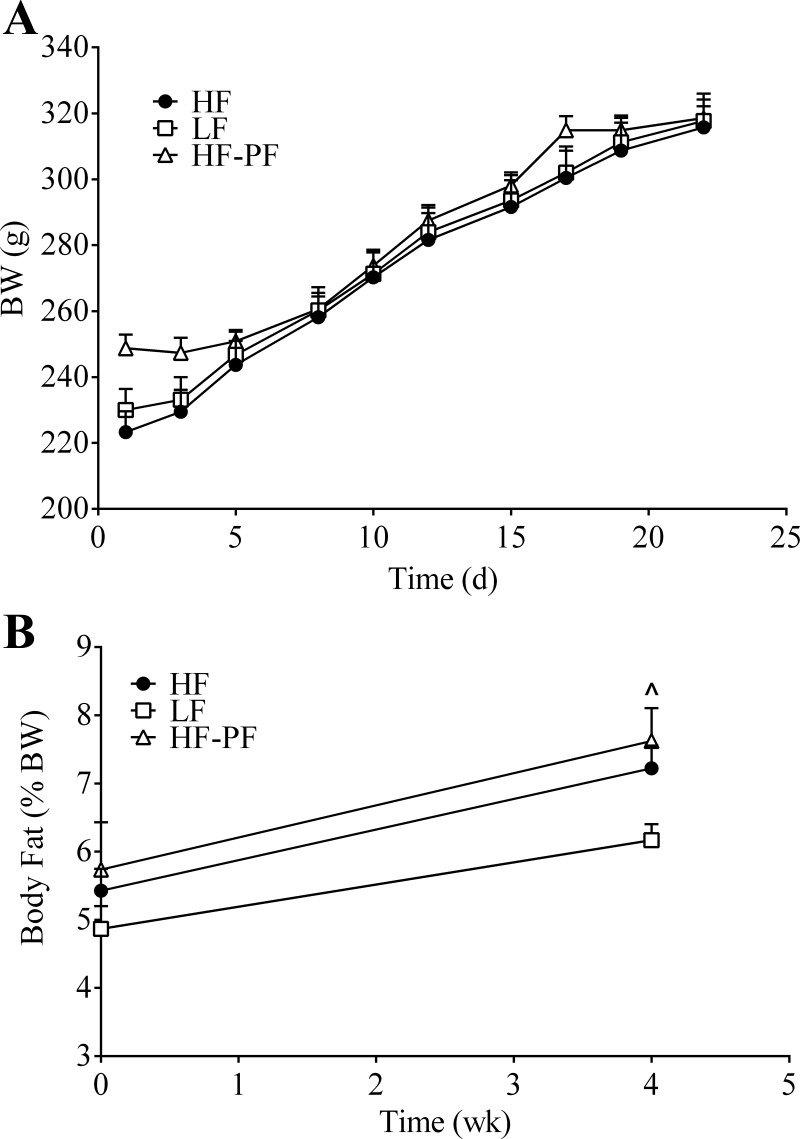
Following the data from our 13-wk experiment, we next wanted to investigate whether or not a shorter period of HF-feeding could induce similar changes in incretin secretion. Similar to the data from the 13-wk feeding period, the 3-wk HF-fed animals also had a higher energy intake than the LF-fed animals at all measured time points (Fig. 4A) (average daily energy intake: HF, 365 kJ vs. LF, 315 kJ). There was no difference in body weight (Fig. 5A) or body fat percentage (Fig. 5B) between the 3-wk HF- and LF-fed animals (final body weight: HF, 315.8 vs. 8.5 g; LF, 317.7 vs. 8.3 g; P = 0.969) (final body fat measurement: HF, 7.2 ± 0.33% vs. LF, 6.2 ± 0.24%; P = 0.771).
Fig. 4.
A: daily energy intake of rats fed a HF (n = 14) or LF (n = 16) diet ad libitum for 3 wk. Cumulative energy intake (B) of the HF (n = 14), LF (n = 16), and high-fat pair-fed (HF-PF; n = 8) groups. Values are means + SE. *HF vs. LF, #HF vs. HF-PF; P < 0.05.
Fig. 5.
Body weight (BW) (A) and body fat percentage (B) of the 3-wk-fed HF (n = 14), LF (n = 16), and HF-PF (n = 8) groups. Values are means + SE. L̂F vs. HF-PF; P < 0.05.
We additionally included a 3-wk HF-PF group. Because the HF-fed animals are hyperphagic, they are not only consuming a diet that contains a higher percentage of fat but also consuming more energy overall. This makes it difficult to interpret whether the changes in incretin secretion are due to the increased consumption of energy or the increased consumption of a HF content diet. The HF-PF group was provided the HF diet but with a caloric content equivalent to the average daily consumption of the rats fed the LF diet ad libitum. By definition, the LF and HF-PF groups cumulatively consumed the same amount of energy during the 3-wk period (Fig. 4B), which was significantly different from the cumulative energy intake of the HF group. Additionally, there was no difference in body weight between the HF-PF group and the HF or LF group following 3 wk of feeding (Fig. 5A). Although there was no change in body fat between the HF and HF-PF group at the end of the 3-wk feeding period, there was a small difference between the LF and the HF-PF group (Fig. 5B) (LF, 6.2 ± 0.24% vs. HF-PF, 7.6 ± 0.48%; P = 0.033).
Experiment 2, 3-wk HF feeding: blood glucose, plasma leptin, and insulin.
Following the 3-wk feeding period, overnight fasting glucose levels were comparable in the three groups (Table 1; HF: 67.3 ± 2.7 mg/dl; LF: 64.0 ± 2.1 mg/dl; HF-PF: 59.5 ± 1.7 mg/dl). Although a small difference of body fat was observed between LF and HF-PF groups, leptin levels were not different in the three experimental groups (HF: 0.51 ± 0.08 ng/ml; LF: 0.66 ± 0.08 ng/ml; HF-PF: 0.61 ± 0.04 ng/ml). Similarly, insulin levels were not significantly different after 3 wk on the HF or HF-PF diets (HF: 0.44 ± 0.06 ng/ml; LF: 0.44 ± 0.05 ng/ml; HF-PF: 0.37 ± 0.05 ng/ml).
Table 1.
Blood glucose, plasma leptin, and insulin
| HF (n = 8) | LF (n = 8) | HF-PF (n = 8) | |
|---|---|---|---|
| Glucose, mg/dl | 67.3 ± 2.7 | 64.0 ± 2.1 | 59.5 ± 1.7 |
| Leptin, ng/ml | 0.51 ± 0.08 | 0.66 ± 0.08 | 0.61 ± 0.04 |
| Insulin, ng/ml | 0.44 ± 0.06 | 0.44 ± 0.05 | 0.37 ± 0.05 |
Results are present as means ± SE. All samples were obtained after an overnight fasting.
HF, high-fat group; LF, low-fat group; HF-PF, high-fat pair-fed group.
Experiment 2, 3-wk HF feeding: incretin secretion following a mixed-meal challenge.
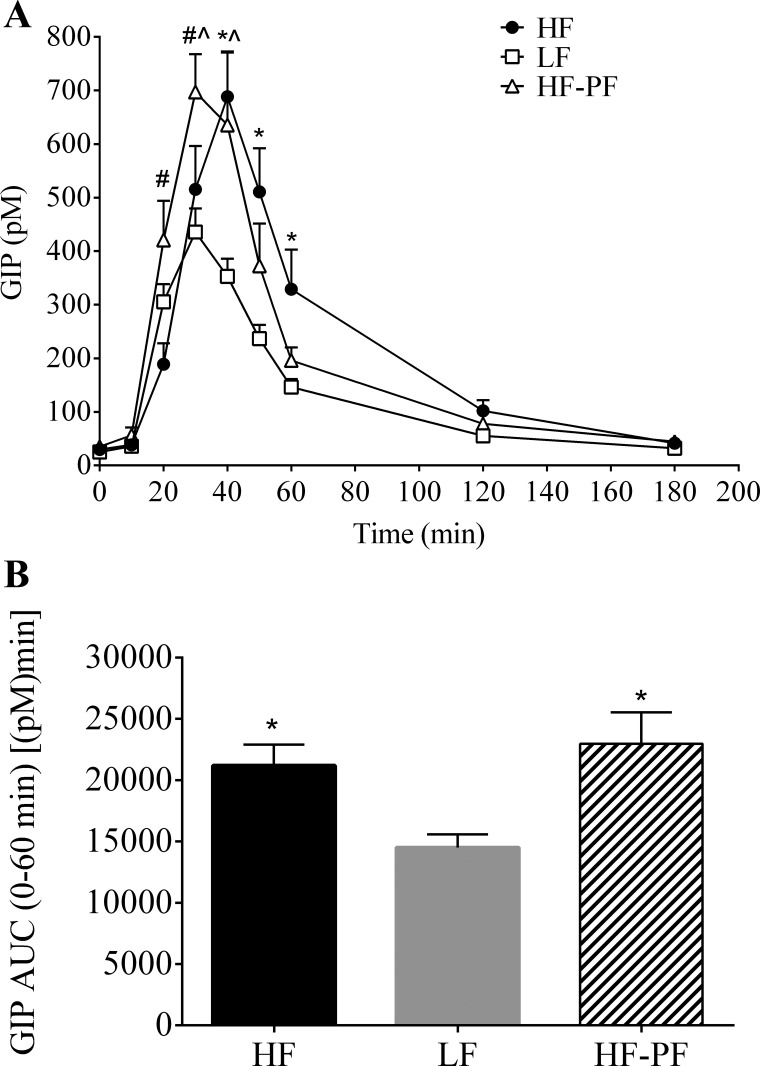
Following the 3-wk feeding period, lymphatic GIP (Fig. 6) and GLP-1 (Fig. 7) secretion was measured, as described above, after duodenal administration of a mixed-meal bolus (Ensure, 3.125 kcal). GIP secretion peaked at 40 min for the HF group (688.4 ± 84.5 pM) and at 30 min for the LF (435.9 ± 44.2 pM) and HF-PF (697.1 ± 71.1 pM) groups. Compared with the LF group, the HF group had significantly greater GIP secretion at 40, 50, and 60 min following the mixed-meal challenge (Fig. 6A); overall (0–60 min AUC) GIP secretion was also significantly greater for HF-fed than for the LF-fed animals [HF, 21,209 ± 1,695 pM·min vs. LF, 14,521 ± 1,069 pM·min; P = 0.020] (Fig. 6B).
Fig. 6.
A: hourly lymphatic GIP concentration following a duodenal mixed-meal challenge (Ensure, 3.125 kcal) for the 3-wk-fed HF (n = 8), LF (n = 8), and HF-PF (n = 5) groups. Lymph was collected continuously for 3 h. *HF vs. LF, #HF vs. HF-PF, L̂F vs. HF-PF; P < 0.05. B: 0–60 min AUC. *P < 0.05 vs. LF. Values are means + SE.
Fig. 7.
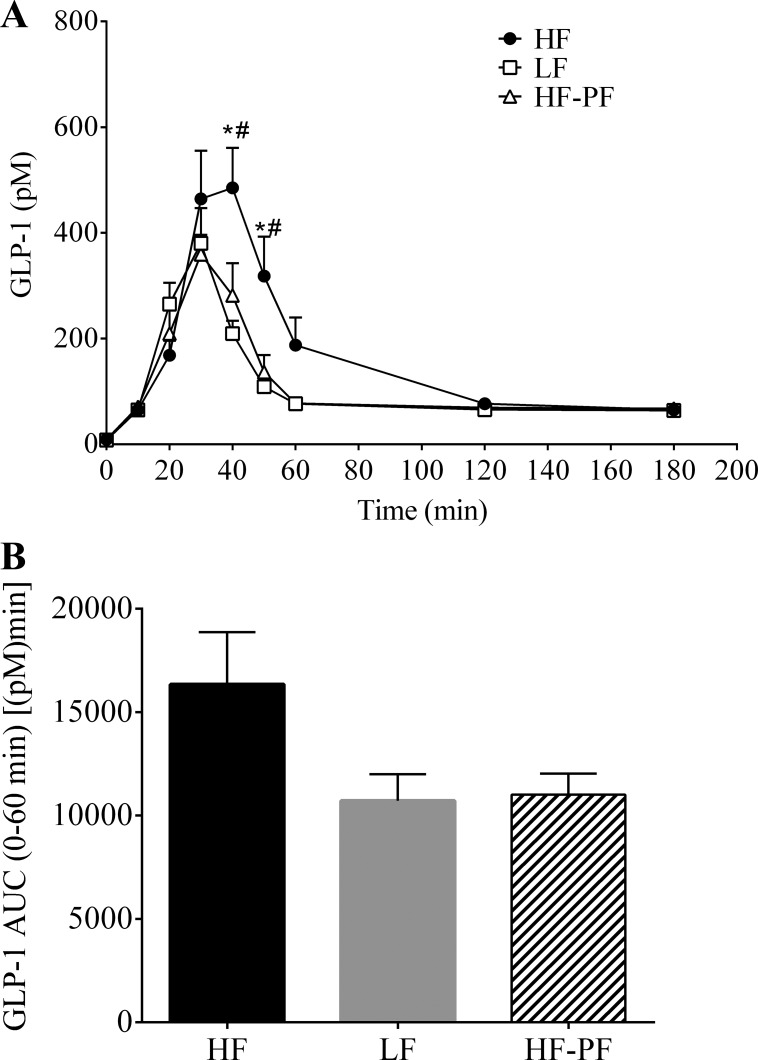
A: hourly lymphatic GLP-1 concentration following a duodenal mixed-meal challenge (Ensure, 3.125 kcal) for the 3-wk-fed HF (n = 8), LF (n = 8), and HF-PF (n = 5) groups. Lymph was collected continuously for 3 h. *HF vs. LF, #HF vs. HF-PF; P < 0.05. B: 0–60 min AUC. Values are means + SE.
The duodenal mixed-meal bolus also stimulated GLP-1 secretion in the 3-wk HF/LF-fed animals (Fig. 7). Similar to GIP, GLP-1 secretion peaked at 40 min for the HF (485.1 ± 75.9 pM) group and at 30 min for the LF (380.3 ± 66.4 pM) and HF-PF (359.7 ± 36.9 pM) groups. GLP-1 secretion for the HF group was significantly larger than that for the LF group 40 and 50 min following the nutrient bolus (Fig. 7A). Additionally, although not statistically significant, there was a trend toward increased overall (0–60 min) GLP-1 secretion for the HF-fed group [HF, 16,346 ± 2,518 pM·min vs. LF, 10,713 ± 1,279 pM·min; P = 0.121] (Fig. 7B).
As mentioned previously, we included the HF-PF group to differentiate whether or not the changes in incretin secretion due to consumption of a HF diet were because of the increased energy intake or the consumption of a HF diet. Both the HF and the HF-PF groups received the same diet, whereas the LF and HF-PF groups consume the same amount of calories but from different diets. Interestingly, the HF-PF animals displayed a secretion profile similar to the HF-fed animals for GIP (Fig. 6) but a similar pattern to the LF-fed animals for GLP-1 (Fig. 7). Compared with the LF-fed group, the HF-PF group had significantly greater GIP secretion at 40 and 50 min following the nutrient bolus. Although the GIP secretion profile for the HF-PF animals aligned more precisely with the HF-fed group, the GIP concentration for the HF-PF group was significantly different than that for the HF group at 20 and 30 min (Fig. 6A). Regardless, the overall (0–60 min) GIP secretion was the same for the HF-fed and the HF-PF groups [HF, 21,209 ± 1,695 pM·min vs. HF-PF, 22,980 ± 2,552 pM·min; P = 0.767] and was increased for the HF-PF group compared with the LF-fed group [LF, 145,210 ± 1,069 pM·min vs. HF-PF, 22,980 ± 2,552 pM·min; P = 0.010] (Fig. 6B). Conversely, GLP-1 secretion for the HF-PF group was similar to the LF group at all time points but significantly less than that for the HF group at 40 and 50 min following the nutrient challenge (Fig. 7A). Though not significant, there was a trend for decreased overall (0–60 min) GLP-1 secretion for the HF-PF group compared with the HF group (HF, 16,346 ± 2,519 pM·min vs. HF-PF, 11,013 ± 1,024 pM·min; P = 0.249) (Fig. 7B). GLP-1 AUC was not different between the LF-fed and the HF-PF groups [LF, 10,714 ± 1,279 pM·min vs. HF-PF 11,013 ± 1,024 pM·min; P = 1.000].
Experiment 2: 3-wk HF feeding: DPP-IV activity in lymph under fasting and feeding.
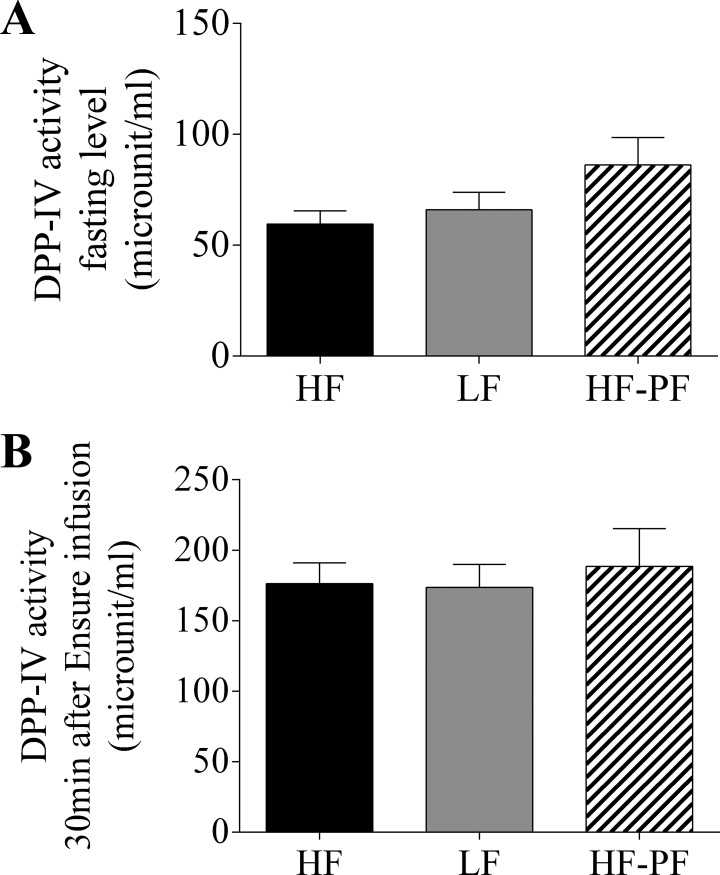
Following the 3-wk feeding period, lymphatic DPP-IV was measured in the HF, LF, and HF-PF groups (Fig. 8). DPP-IV activity was not changed in the HF or HF-PF groups compared with the LF group either under fasting (HF: 59.6 ± 5.9; LF: 66.0 ± 7.9; HF-PF: 86.2 ± 12.3) or 30 min (HF: 176.3 ± 14.8; LF: 173.5 ± 16.5; HF-PF: 188.6 ± 26.7) after GIP and GLP-1 concentrations in lymph start to differ among the groups due to Ensure infusion.
Fig. 8.
Dipeptidyl peptidase IV (DPP-IV) activity in lymph was determined for the 3-wk-fed HF (n = 7), LF (n = 6), and HF-PF (n = 8) groups during fasting (A) and 30 min after Ensure infusion (B). Data are presented as means ± SE.
Experiment 2, 3-wk HF feeding: GIP and GLP-1 content in intestinal segments.
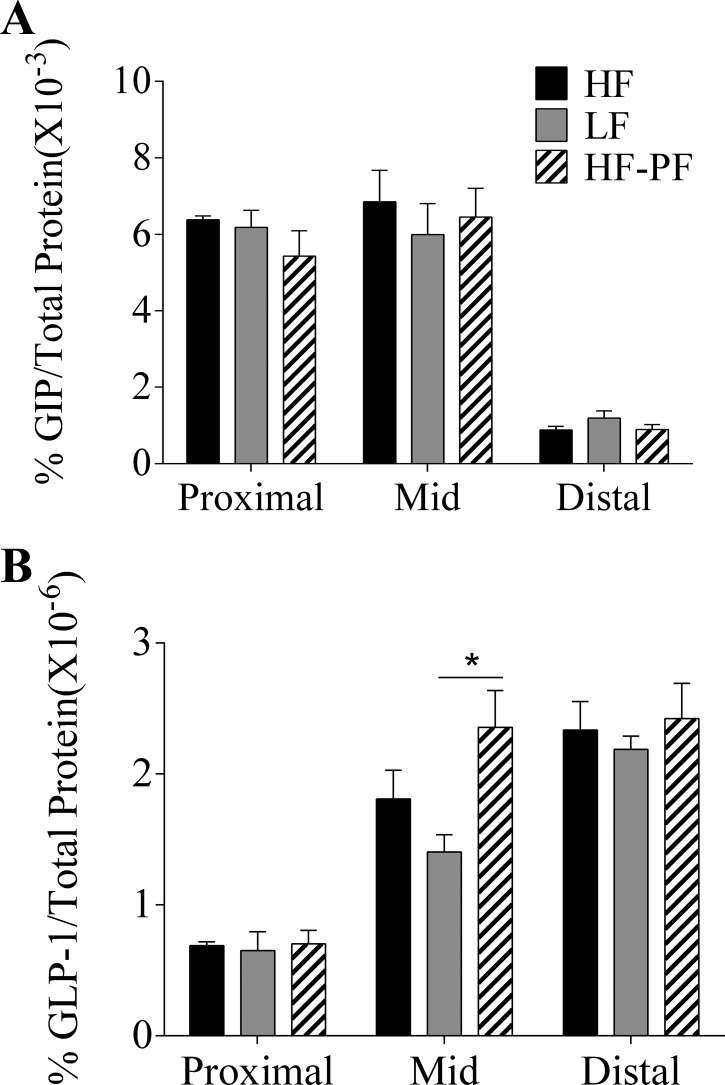
As shown in Fig. 9, GIP content was much higher in the proximal and mid than in the distal segments of the small intestine, consistent with the reports that GIP is mainly secreted by the upper gut. However, there was no significant difference in GIP content in the three experimental groups (Fig. 9A). As expected, GLP-1 content was much higher in the mid and distal than in the proximal segments of the small intestine. The only significant difference in GLP-1 content was observed in the mid segment of the small intestine between the HF-PF and LF groups (% GLP-1/total protein × 10−6, LF: 1.4 ± 0.1 vs. HF-PF: 2.4 ± 0.3; P < 0.05) (Fig. 9B).
Fig. 9.
Percentage intestinal GIP (A) or GLP-1 protein content (B) was determined for the 3-wk-fed HF (n = 5), LF (n = 6), and HF-PF (n = 5) groups. Intestinal segments were taken from the first quarter of the small intestine (proximal), the last quarter of small intestine (distal), and a quarter length segment in the center of small intestine (mid). *P < 0.05. Data are presented as means ± SE.
DISCUSSION
Despite the well-documented relationship between Type 2 diabetes and the impairments in the incretin system, the dynamics of postprandial incretin secretion in diet-induced obesity are not clearly defined. We sought to determine whether the alterations in GIP and GLP-1 secretion are secondary consequences of obesity or rather are induced by the overconsumption of high-energy diets that often perpetuate obesity. In the present study, we investigated the effects of chronic HF feeding on the secretion of GIP and GLP-1 using the lymph fistula rat model. Recently, we found intestinal lymph to be a sensitive medium to study the continuous secretion of the incretin hormones in conscious rats and mice (7, 22, 23). Male Sprague-Dawley rats were provided either a HF or LF diet for 13 wk in study 1 or for 3 wk in study 2. Interestingly, despite demonstrating no signs of obesity beyond hyperphagia, both the 3-wk and 13-wk HF-fed animals had elevated lymphatic GIP and GLP-1 concentrations compared with animals fed a LF diet, suggesting that alterations in incretin secretion may occur prior to the development of obesity. Thus the elevated levels of GIP and GLP-1 are consequences of either increased energy intake (hyperphagia) or increased consumption of a HF diet and are not due to secondary consequences of obesity.
To clarify whether the alterations are due to the increased energy intake or the increased dietary fat content, we included the HF-PF group. The HF-PF animals received the same diet as the HF-fed animals; however, they were restricted to the amount of calories consumed ad libitum by the LF group. At the end of the 3-wk feeding period, there was no difference in body weight between the HF-PF group and the HF or LF group and only a small difference in percent body fat between the HF-PF and the LF groups. The GIP secretion profile for the HF-PF group more closely aligned with the HF group, whereas the HF-PF and LF groups produced similar GLP-1 secretory responses. These data suggest that, following the consumption of a HF diet, the increased GIP secretion is driven by the greater percentage of fat in the diet, whereas the increased GLP-1 secretion is driven by the excess caloric intake.
We were surprised that there was not a significant difference in body weight and only a modest difference in percent body fat between the two feeding groups, despite the consumption of excess energy by the HF group for up to 13 wk. Woods and colleagues (45) previously reported successful use of this particular diet in inducing obesity in male and female Long-Evans rats. In their study, the HF-fed animals weighed 10% more and had 50% more body fat than the LF-fed group following 10 wk of HF or LF feeding, respectively. The primary difference between the two studies is the use of Sprague-Dawley rats in our study over Long-Evans rats in the work by Woods and colleagues (45). The segregation of Sprague-Dawley animals into diet-induced obesity-prone and diet-induced obesity-resistant groups has been reported previously (6, 18, 19, 32). Individual weight curves, however, do not suggest the stratification of our HF-fed animals into two distinct groups. Although we feel that determining the cause behind the lack of weight gain and fat mass increase is of interest, it is beyond the scope of our present study. Regardless, the absence of a weight difference between the two groups allowed us to determine the effect of the diet alone or the caloric intake alone on incretin secretion without obesity or weight gain as a confounding factor.
The intestine adapts during the consumption of a HF diet to accommodate the digestion and absorption of a larger lipid load. Intestinal transit is increased, and small intestinal morphology and function is modified (21, 34). Moreover, studies in rodents also suggest that consumption of a HF diet alters gastrointestinal function and intestinal morphology (5, 21, 34, 35), both of which could ultimately lead to altered incretin secretion. Singh and colleagues (35) observed elevated levels of jejunal and ileal mucosal enzymes involved in lipid absorption and a subsequent increased uptake of oleic acid following 4 wk on a chow diet supplemented with 20% lard. Data from Balint and colleagues (5) suggest that this increase in oleic acid uptake is additionally due to cellular hypertrophy in the ileum. Is it possible that the enteroendocrine cells are also undergoing adaptations following chronic HF feeding? Along these lines, Gniuli et al. (14) recently reported that 30-day feeding of a diet rich in saturated fat to male Wistar rats significantly elevated GIP levels following an oral glucose challenge; in a follow-up study, the authors report that HF feeding stimulates duodenal proliferation of endocrine cells, which differentiate into GIP-secreting K cells (13). In a similar study, ob/ob mice challenged with a HF diet had elevated plasma GIP levels compared with ob/ob mice fed a high-carbohydrate (HC) or chow diet (4). Both high energy diets (HF and HC) induced K cell hyperplasia; however, the HF diet additionally increased intestinal GIP concentration and content, which resulted in the elevated plasma GIP levels. Whether or not the ob/ob mice had a stronger propensity for K cell hyperplasia than the lean mice following a chronic high-energy diet was not addressed in the study, thus making the results difficult to interpret for diet-induced obese animals without genetic disruptions. Regardless, the data do suggest that consumption of a HF diet increases the production of GIP. In the present study, GIP content in different intestinal segments was not found to be significantly altered by 3 wk of HF feeding. This discrepancy could be due to the duration of feeding and different composition of fat compared with other studies. Our data suggest that without altering GIP production, HF feeding increases the sensitivity of GIP secretion in response to nutrient ingestion. Our data, in combination with other studies, demonstrate that consumption of a HF diet results in elevated GIP levels through increased GIP production and secretion, in which a greater percentage of fat in the diet may play a key role.
Unlike the GIP data, the consumption of a diet higher in fat alone does not explain the elevated GLP-1 levels. The HF-PF group did not have increased lymphatic GLP-1 concentrations despite consuming a diet with a higher fat content, suggesting that the increased energy intake of the HF group is causing the rise in GLP-1 secretion. Interestingly, the HF-PF group had higher GLP-1 content in the mid segment of intestine than the LF group. Apparently, this higher GLP-1 content did not induce increased GLP-1 secretion. Although difficult to explain at this time, given the complexity of the GLP-1 secretory system, this observation is of interest.
Recent studies have demonstrated that hyperleptinemia, hyperinsulinemia, and hyperglycemia (all secondary consequences of obesity) affect the secretion of GLP-1 (2, 20, 43); however, in our study, we did not observe the elevated leptin, insulin, or glucose levels in our HF-fed group that could induce the altered GLP-1 secretion (Table 1). Another possible cause of increased GLP-1 secretion could be reduced degradation of GLP-1 in lymph. However, DPP-IV activity in lymph did not differ in the three groups (Fig. 8).
In addition to being directly regulated by nutrient stimuli, GLP-1 is also indirectly regulated by neuronal and hormonal signals. For example, fat can either affect GLP-1 secretion directly by stimulating the L cells at their luminal surface (46) or can indirectly affect L cells by influencing the vagal nerve activity. It was reported that bilateral subdiaphragmatic vagotomy completely blocks fat-induced GLP-1 secretion, whereas direct electrical stimulation of the celiac branches of the vagus to innervate the jejunum, ileum, and colon augments GLP-1 secretion (33). Whether or not HF diet alters the endocrine and neural signaling on the L cells warrants further investigation.
In conclusion, we found that rats chronically fed a HF diet had greater lymphatic GIP and GLP-1 responses to a mixed nutrient challenge; furthermore, these responses occurred without the increased fat mass and weight gain generally associated with chronic feeding of a HF diet. The data suggest that the alterations in incretin secretion may occur prior to the development of obesity. Data from the HF-PF group in the 3-wk feeding trial suggested that the driving forces behind the elevated incretin levels are different for GIP and GLP-1. The increased GIP secretion is driven by the greater percentage of fat intake, whereas the increased GLP-1 secretion is driven by the excess caloric intake. Further studies are needed to investigate the mechanisms underlying the effect of a HF diet on GIP secretion and of hyperphagia on GLP-1 production and secretion.
GRANTS
We are grateful for support from the National Institute of Diabetes and Digestive and Kidney Diseases Grants DK056863 (P. Tso), DK059360 (P. Tso), and DK076928 (P. Tso) and American Heart Association Predoctoral Fellowship 09PRE2400160 (S. M. Yoder).
DISCLOSURES
No conflicts of interest, financial or otherwise, are declared by the author(s).
AUTHOR CONTRIBUTIONS
F.W., S.M.Y., and P.T. conception and design of research; F.W., S.M.Y., Q.Y., and J.W. performed experiments; F.W., S.M.Y., Q.Y., T.L.K., J.W., and P.T. analyzed data; F.W., S.M.Y., T.L.K., and P.T. interpreted results of experiments; F.W. and S.M.Y. prepared figures; F.W., A.B.K., J.W., and P.T. edited and revised manuscript; F.W., S.M.Y., Q.Y., A.B.K., T.L.K., J.W., and P.T. approved final version of manuscript; S.M.Y. drafted manuscript.
REFERENCES
- 1.Adam TC, Westerterp-Plantenga MS. Glucagon-like peptide-1 release and satiety after a nutrient challenge in normal-weight and obese subjects. Br J Nutr 93: 845–851, 2005. [DOI] [PubMed] [Google Scholar]
- 2.Anini Y, Brubaker PL. Role of leptin in the regulation of glucagon-like peptide-1 secretion. Diabetes 52: 252–259, 2003. [DOI] [PubMed] [Google Scholar]
- 3.Baggio LL, Drucker DJ. Biology of incretins: GLP-1 and GIP. Gastroenterology 132: 2131–2157, 2007. [DOI] [PubMed] [Google Scholar]
- 4.Bailey CJ, Flatt PR, Kwasowski P, Powell CJ, Marks V. Immunoreactive gastric inhibitory polypeptide and K cell hyperplasia in obese hyperglycaemic (ob/ob) mice fed high fat and high carbohydrate cafeteria diets. Acta Endocrinol (Copenh) 112: 224–229, 1986. [DOI] [PubMed] [Google Scholar]
- 5.Balint JA, Fried MB, Imai C. Ileal uptake of oleic acid: evidence for adaptive response to high fat feeding. Am J Clin Nutr 33: 2276–2280, 1980. [DOI] [PubMed] [Google Scholar]
- 6.Chang S, Graham B, Yakubu F, Lin D, Peters JC, Hill JO. Metabolic differences between obesity-prone and obesity-resistant rats. Am J Physiol Regul Integr Comp Physiol 259: R1103–R1110, 1990. [DOI] [PubMed] [Google Scholar]
- 7.D'Alessio D, Lu W, Sun W, Zheng S, Yang Q, Seeley R, Woods SC, Tso P. Fasting and postprandial concentrations of GLP-1 in intestinal lymph and portal plasma: evidence for selective release of GLP-1 in the lymph system. Am J Physiol Regul Integr Comp Physiol 293: R2163–R2169, 2007. [DOI] [PubMed] [Google Scholar]
- 8.Deacon CF, Nauck MA, Meier J, Hucking K, Holst JJ. Degradation of endogenous and exogenous gastric inhibitory polypeptide in healthy and in type 2 diabetic subjects as revealed using a new assay for the intact peptide. J Clin Endocrinol Metab 85: 3575–3581, 2000. [DOI] [PubMed] [Google Scholar]
- 9.Feinle C, Chapman IM, Wishart J, Horowitz M. Plasma glucagon-like peptide-1 (GLP-1) responses to duodenal fat and glucose infusions in lean and obese men. Peptides 23: 1491–1495, 2002. [DOI] [PubMed] [Google Scholar]
- 10.Finkelstein EA, Fiebelkorn IC, Wang G. National medical spending attributable to overweight and obesity: how much, and who's paying? Health Aff (Millwood) Jan-Jun: Suppl Web Exclusives: W3-219–W3-226, 2003. [DOI] [PubMed] [Google Scholar]
- 11.Fukase N, Igarashi M, Takahashi H, Manaka H, Yamatani K, Daimon M, Tominaga M, Sasaki H. Hypersecretion of truncated glucagon-like peptide-1 and gastric inhibitory polypeptide in obese patients. Diabet Med 10: 44–49, 1993. [DOI] [PubMed] [Google Scholar]
- 12.Getty-Kaushik L, Song DH, Boylan MO, Corkey BE, Wolfe MM. Glucose-dependent insulinotropic polypeptide modulates adipocyte lipolysis and reesterification. Obesity (Silver Spring) 14: 1124–1131, 2006. [DOI] [PubMed] [Google Scholar]
- 13.Gniuli D, Calcagno A, Dalla LL, Calvani R, Leccesi L, Caristo ME, Vettor R, Castagneto M, Ghirlanda G, Mingrone G. High-fat feeding stimulates endocrine, glucose-dependent insulinotropic polypeptide (GIP)-expressing cell hyperplasia in the duodenum of Wistar rats. Diabetologia 53: 2233–2240, 2010. [DOI] [PubMed] [Google Scholar]
- 14.Gniuli D, Dalla LL, Caristo ME, Calvani R, Castagneto M, Mingrone G. High saturated-fat diet induces apoptosis in rat enterocytes and blunts GIP and insulin-secretive response to oral glucose load. Int J Obes (Lond) 32: 871–874, 2008. [DOI] [PubMed] [Google Scholar]
- 15.Gutzwiller JP, Goke B, Drewe J, Hildebrand P, Ketterer S, Handschin D, Winterhalder R, Conen D, Beglinger C. Glucagon-like peptide-1: a potent regulator of food intake in humans. Gut 44: 81–86, 1999. [DOI] [PMC free article] [PubMed] [Google Scholar]
- 16.Hensrud DD, Klein S. Extreme obesity: a new medical crisis in the United States. Mayo Clin Proc 81: S5–S10, 2006. [DOI] [PubMed] [Google Scholar]
- 17.Kim SJ, Winter K, Nian C, Tsuneoka M, Koda Y, McIntosh CH. Glucose-dependent insulinotropic polypeptide (GIP) stimulation of pancreatic beta-cell survival is dependent upon phosphatidylinositol 3-kinase (PI3K)/protein kinase B (PKB) signaling, inactivation of the forkhead transcription factor Foxo1, and down-regulation of bax expression. J Biol Chem 280: 22297–22307, 2005. [DOI] [PubMed] [Google Scholar]
- 18.Levin BE, Dunn-Meynell AA, Balkan B, Keesey RE. Selective breeding for diet-induced obesity and resistance in Sprague-Dawley rats. Am J Physiol Regul Integr Comp Physiol 273: R725–R730, 1997. [DOI] [PubMed] [Google Scholar]
- 19.Levin BE, Hogan S, Sullivan AC. Initiation and perpetuation of obesity and obesity resistance in rats. Am J Physiol Regul Integr Comp Physiol 256: R766–R771, 1989. [DOI] [PubMed] [Google Scholar]
- 20.Lim GE, Xu M, Sun J, Jin T, Brubaker PL. The rho guanosine 5′-triphosphatase, cell division cycle 42, is required for insulin-induced actin remodeling and glucagon-like peptide-1 secretion in the intestinal endocrine L cell. Endocrinology 150: 5249–5261, 2009. [DOI] [PubMed] [Google Scholar]
- 21.Little TJ, Horowitz M, Feinle-Bisset C. Modulation by high-fat diets of gastrointestinal function and hormones associated with the regulation of energy intake: implications for the pathophysiology of obesity. Am J Clin Nutr 86: 531–541, 2007. [DOI] [PubMed] [Google Scholar]
- 22.Lu WJ, Yang Q, Sun W, Woods SC, D'Alessio D, Tso P. The regulation of the lymphatic secretion of glucagon-like peptide-1 (GLP-1) by intestinal absorption of fat and carbohydrate. Am J Physiol Gastrointest Liver Physiol 293: G963–G971, 2007. [DOI] [PubMed] [Google Scholar]
- 23.Lu WJ, Yang Q, Sun W, Woods SC, D'Alessio D, Tso P. Using the lymph fistula rat model to study the potentiation of GIP secretion by the ingestion of fat and glucose. Am J Physiol Gastrointest Liver Physiol 294: G1130–G1138, 2008. [DOI] [PubMed] [Google Scholar]
- 24.Lugari R, Dei CA, Ugolotti D, Barilli AL, Camellini C, Ganzerla GC, Luciani A, Salerni B, Mittenperger F, Nodari S, Gnudi A, Zandomeneghi R. Glucagon-like peptide 1 (GLP-1) secretion and plasma dipeptidyl peptidase IV (DPP-IV) activity in morbidly obese patients undergoing biliopancreatic diversion. Horm Metab Res 36: 111–115, 2004. [DOI] [PubMed] [Google Scholar]
- 25.Maljaars PW, Peters HP, Mela DJ, Masclee AA. Ileal brake: a sensible food target for appetite control. A review. Physiol Behav 95: 271–281, 2008. [DOI] [PubMed] [Google Scholar]
- 26.Nakanome C, Akai H, Umezu M, Toyota T, Goto Y. Gastric inhibitory polypeptide (GIP) response to an oral glucose load in the patients with diabetes mellitus. Tohoku J Exp Med 139: 287–292, 1983. [DOI] [PubMed] [Google Scholar]
- 27.Nauck MA, Heimesaat MM, Orskov C, Holst JJ, Ebert R, Creutzfeldt W. Preserved incretin activity of glucagon-like peptide 1 [7–36 amide] but not of synthetic human gastric inhibitory polypeptide in patients with type-2 diabetes mellitus. J Clin Invest 91: 301–307, 1993. [DOI] [PMC free article] [PubMed] [Google Scholar]
- 28.Nauck MA, Niedereichholz U, Ettler R, Holst JJ, Orskov C, Ritzel R, Schmiegel WH. Glucagon-like peptide 1 inhibition of gastric emptying outweighs its insulinotropic effects in healthy humans. Am J Physiol Endocrinol Metab 273: E981–E988, 1997. [DOI] [PubMed] [Google Scholar]
- 29.Ogden CL, Yanovski SZ, Carroll MD, Flegal KM. The epidemiology of obesity. Gastroenterology 132: 2087–2102, 2007. [DOI] [PubMed] [Google Scholar]
- 30.Ranganath L, Norris F, Morgan L, Wright J, Marks V. Inhibition of carbohydrate-mediated glucagon-like peptide-1 (7–36)amide secretion by circulating non-esterified fatty acids. Clin Sci (Lond) 96: 335–342, 1999. [DOI] [PubMed] [Google Scholar]
- 31.Ranganath LR, Beety JM, Morgan LM, Wright JW, Howland R, Marks V. Attenuated GLP-1 secretion in obesity: cause or consequence? Gut 38: 916–919, 1996. [DOI] [PMC free article] [PubMed] [Google Scholar]
- 32.Ricci MR, Levin BE. Ontogeny of diet-induced obesity in selectively bred Sprague-Dawley rats. Am J Physiol Regul Integr Comp Physiol 285: R610–R618, 2003. [DOI] [PubMed] [Google Scholar]
- 33.Rocca AS, Brubaker PL. Role of the vagus nerve in mediating proximal nutrient-induced glucagon-like peptide-1 secretion. Endocrinology 140: 1687–1694, 1999. [DOI] [PubMed] [Google Scholar]
- 34.Sagher FA, Dodge JA, Johnston CF, Shaw C, Buchanan KD, Carr KE. Rat small intestinal morphology and tissue regulatory peptides: effects of high dietary fat. Br J Nutr 65: 21–28, 1991. [DOI] [PubMed] [Google Scholar]
- 35.Singh A, Balint JA, Edmonds RH, Rodgers JB. Adaptive changes of the rat small intestine in response to a high fat diet. Biochim Biophys Acta 260: 708–715, 1972. [DOI] [PubMed] [Google Scholar]
- 36.Spiller RC, Trotman IF, Adrian TE, Bloom SR, Misiewicz JJ, Silk DB. Further characterisation of the ‘ileal brake’ reflex in man—effect of ileal infusion of partial digests of fat, protein, and starch on jejunal motility and release of neurotensin, enteroglucagon, and peptide YY. Gut 29: 1042–1051, 1988. [DOI] [PMC free article] [PubMed] [Google Scholar]
- 37.Tomasik PJ, Sztefko K, Malek A. GLP-1 as a satiety factor in children with eating disorders. Horm Metab Res 34: 77–80, 2002. [DOI] [PubMed] [Google Scholar]
- 38.Turton MD, O'Shea D, Gunn I, Beak SA, Edwards CM, Meeran K, Choi SJ, Taylor GM, Heath MM, Lambert PD, Wilding JP, Smith DM, Ghatei MA, Herbert J, Bloom SR. A role for glucagon-like peptide-1 in the central regulation of feeding. Nature 379: 69–72, 1996. [DOI] [PubMed] [Google Scholar]
- 39.Vaag AA, Holst JJ, Volund A, Beck-Nielsen HB. Gut incretin hormones in identical twins discordant for non-insulin-dependent diabetes mellitus (NIDDM)—evidence for decreased glucagon-like peptide 1 secretion during oral glucose ingestion in NIDDM twins. Eur J Endocrinol 135: 425–432, 1996. [DOI] [PubMed] [Google Scholar]
- 40.Verdich C, Toubro S, Buemann B, Lysgard MJ, Juul HJ, Astrup A. The role of postprandial releases of insulin and incretin hormones in meal-induced satiety—effect of obesity and weight reduction. Int J Obes Relat Metab Disord 25: 1206–1214, 2001. [DOI] [PubMed] [Google Scholar]
- 41.Vilsboll T, Krarup T, Deacon CF, Madsbad S, Holst JJ. Reduced postprandial concentrations of intact biologically active glucagon-like peptide 1 in type 2 diabetic patients. Diabetes 50: 609–613, 2001. [DOI] [PubMed] [Google Scholar]
- 42.Vilsboll T, Krarup T, Sonne J, Madsbad S, Volund A, Juul AG, Holst JJ. Incretin secretion in relation to meal size and body weight in healthy subjects and people with type 1 and type 2 diabetes mellitus. J Clin Endocrinol Metab 88: 2706–2713, 2003. [DOI] [PubMed] [Google Scholar]
- 43.Vollmer K, Gardiwal H, Menge BA, Goetze O, Deacon CF, Schmidt WE, Holst JJ, Meier JJ. Hyperglycemia acutely lowers the postprandial excursions of glucagon-like Peptide-1 and gastric inhibitory polypeptide in humans. J Clin Endocrinol Metab 94: 1379–1385, 2009. [DOI] [PubMed] [Google Scholar]
- 44.Wang Y, Montrose-Rafizadeh C, Adams L, Raygada M, Nadiv O, Egan JM. GIP regulates glucose transporters, hexokinases, and glucose-induced insulin secretion in RIN 1046-38 cells. Mol Cell Endocrinol 116: 81–87, 1996. [DOI] [PubMed] [Google Scholar]
- 45.Woods SC, Seeley RJ, Rushing PA, D'Alessio D, Tso P. A controlled high-fat diet induces an obese syndrome in rats. J Nutr 133: 1081–1087, 2003. [DOI] [PubMed] [Google Scholar]
- 46.Yoder SM, Yang Q, Kindel TL, Tso P. Stimulation of incretin secretion by dietary lipid: is it dose dependent? Am J Physiol Gastrointest Liver Physiol 297: G299–G305, 2009. [DOI] [PMC free article] [PubMed] [Google Scholar]


