

Abstract
Introduction
Neurofibrillary tau pathology and amyloid beta (Aβ) plaques, characteristic lesions of Alzheimer's disease (AD), show different neocortical laminar distributions. NFT-tau pathology tends to be located closer to the gray-white-matter boundary (G-WB) whereas Aβ is dispersed throughout the width of the cortical ribbon.
Methods
Using PET radiotracers for tau and Aβ lesions, we developed an image analysis tool to measure the distance of tracer-positive voxels to the G-WB. We studied 5 AD and 5 healthy subjects with both 18F-THK5117 (tau) and 11C-PiB (Aβ) PET.
Results
We observed that on average tau positive-voxels were closer to the white matter than the Aβ positive voxels. This effect was found for all AD subjects and for all regions, both before and after regionally adjusting for the non-specific white matter binding of both tracers. The differential laminar pattern was validated at post mortem.
Conclusion
Within cortical lamina distance measures may be of value in testing PET tracers for their anatomical selectivity.
Keywords: Tau, amyloid beta, neocortical binding, PET
Introduction
Senile amyloid plaques and neurofibrillary tangles (tau pathology) are the two characteristic lesions required for a neuropathological diagnosis of Alzheimer's disease (AD) (1). On histopathology, amyloid beta (Aβ) plaques are extracellular and dispersed throughout the neocortical ribbon (2). During the progression of AD, tau tangles initially appears in the hippocampal formation and subsequently in the neocortex (3), where they are intracellular and preferentially located in the neocortical layers V and VI, closer to the gray-white-matter boundary (G-WB) (4). Analogs of thioflavin T such as Pittsburgh compound B (PiB) adapted for positron emission tomography (PET) are validated for imaging Aβ deposits (5). Recently, PET compounds have been developed to label tau pathology (6-8).
Typically, the analysis of PET images is done by assessing regional signal uptake in the cerebral cortex, but the distribution of signal within the cortical ribbon is ignored. The objective of this study was to investigate whether the differential spatial distributions of these two lesions in the cortical ribbon of AD patients can be detected with PET imaging. We tested the hypothesis that the bound tau tracer is found closer to G-WB, as compared with Aβ.
Materials and Methods
Participants
Ten subjects were studied: five with probable AD (three female and two males, age 77.4 ±13.0, range 57–88 years, Mini-Mental State Examination (MMSE) 18.8±5.9, Clinical Dementia Rating (CDR) 2.0±1.0, education 12.2±3.6 years) and five healthy elderly controls (four males and one female, age 71.6 ± 4.2, range 67–78 years, MMSE 28.8 ± 1.8, CDR 0, education 13.6±2.2 years). Written informed consent was obtained from all participants. One AD post mortem autoradiography validation study was conducted using 3H-THK5117 and 3H-PiB. The protocol was approved by the Ethics Committee of Tohoku University Hospital. Controls were recruited by advertisements in the community. AD patients were recruited from the memory clinic of Tohoku University Hospital. Participants were assessed on of their clinical and neuropsychological performance with the consensus of a neurologist and a neuropsychologist, blind to the PET. The diagnosis of AD was made according to the National Institute of Neurological and Communicative Disorders and Stroke/AD and Related Disorders Association criteria.
Image acquisition
MRI was performed on a SIGNA 1.5 T magnet (General Electric, Milwaukee, WI). A three-dimensional volumetric acquisition of a T1-weighted SPGR gradient echo sequence produced gapless axial sections (echo time/repetition time, 2.4/50 ms; flip angle, 45°; acquisition matrix, 256×256; 1 excitation; field of view, 22 cm; slice thickness, 2.0 mm). The two radiotracers, 6-[(3-18F-fluoro-2-hydroxy)propoxy]-2-(4-methylaminophenyl)quinoline (18F-THK5117) and 11C-PiB were prepared at the Cyclotron and Radioisotope Center of Tohoku University. 18F-THK5117 was synthesized as described previously (9). 11C-PiB PET was synthesized using the one-step11C-methyl triflate approach (10). PET data were acquired using an Eminence STARGATE PET scanner (Shimadzu, Kyoto, Japan) from 0-90 min for 18F-THK5117 with dosage of 185 mBq and 0-70 min for 11C-PiB with dosage of 296 mBq.
Image analysis
For each subject, dynamic PET frames of both 18F-THK5117 and 11C-PiB were realigned using SPM8 software (www.fil.ion.ucl.ac.uk/spm). Standardized uptake value (SUV) images were generated from 18F-THK5117 using the 50-80 min time frames and for 11C-PiB, using the 50-70 min frames. All SUV images were coregistered to the corresponding MRI volumes using SPM8. MRI- determined regions of interest (ROI) were used to sample the PET. MRI based ROI's were determined by Free-Surfer (version 5.1, http://surfer.nmr.mgh.harvard.edu) for the gray and white matter for the entire neocortex (principal outcome) and separately for the frontal, parietal, occipital, and temporal lobes, and cerebellum. For each tracer, the cerebellar gray matter was used to create regional SUV-ratios (SUVR).
Cutoff cortex values for “positive” and “negative” 18F-THK5117 and 11C-PiB PET voxels were regionally defined referencing the mean control SUVR and standard deviation (SD). Cutoffs were tested at 1.5 (see Figure 1) and 1.0 times the SD. A distance[v] measure was generated for all positive cortical voxels for each tracer based on the shortest distance to the MRI defined G-WB, (Figure 2). To test whether the distance[v] distinguished the 18F-THK5117 and 11C-PiB binding, the distributions in AD subjects were estimated for each of the ROIs. Voxels located in neocortex with an apparent thickness < 1.0 mm (likely caused by segmentation errors, < 10% of total) were excluded from the analysis.
Figure 1.
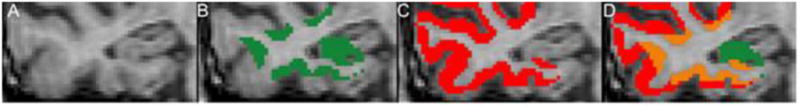
A. T1 weighted MRI of right temporal cortex of an AD patient; B. tau-positive voxels (green); C. amyloid-positive voxels (red); D. overlapping tau and amyloid voxels (orange), all at 1.5 SD cutoff.
Figure 2.
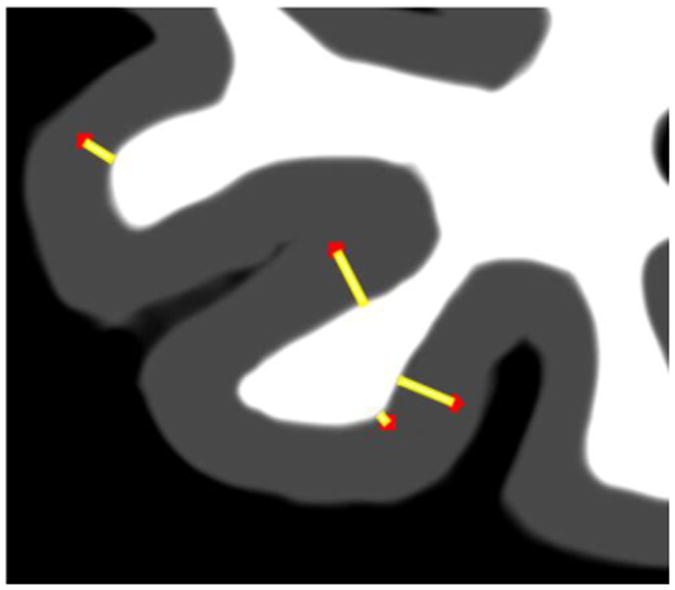
Schematic representation of the distance[v] image. For each PET tracer, positive gray ribbon voxels (red dots) were defined by statistical threshold and the shortest distance to the white matter boundary computed (yellow line). The gray matter ribbon and the G-WB are defined by MRI.
Statistical analysis
We tested the hypothesis that the distance[v] is shorter for tau than for Aβ by paired t-test and nonparametric Wilcoxon-Signed-Rank-test. A residual based approach was taken to adjust for the confounding effects of non-specific white matter uptake of the two tracers. Specifically, in the control group, regional regression equations defining the relationships between the distance[v] and the adjacent white matter uptake were estimated. Subsequently, these regressions models were applied to the AD group and used to calculate the AD residuals, (residual = actual value minus predicted value). The residuals and actual values were tested. Analyses were performed with SPSS version 19, Chicago, IL. Results were declared statistically significant when p<0.05.
Results
Compared with control (C) the total neocortex SUVR was higher in AD for both PiB (x̄SUVR-C=1.13±0.04, x̄SUVR-AD= 1.69±0.17) and THK5117 (x̄SUVR-C=1.12±0.06, x̄SUVR-AD= 1.31±0.07). The average cortical thickness in AD is 1.90mm and 2.85mm in control. For both the 1.5 and 1.0 SD cutoffs, for all regions the mean distance[v] was significantly shorter for tau than Aβ. Adjustment for partial volume artifact did not change the results (Table 1). All significant test results were confirmed using the Wilcoxon-Signed-Rank-test. Figure 1 shows the AD spatial distribution of tau and Aβ tracer binding in the temporal lobe of a representative patient. The individual distance[v] data are in the supplement.
Table 1. Mean distance[v] and total counts for 18F-THK5117 and 11C-PiB positive-voxels (1.5 SD Cutoff).
| 18F-THK5117(mm) | 11C-PiB(mm) | Unadjusted p value | Regression adjusted p value | number of positive-voxels (×105) | ||
|---|---|---|---|---|---|---|
| 18F-THK | 11C-PiB | |||||
| Total cortex | 1.49±0.11 | 1.73±0.10 | .01 | 0.02 | 2.2 | 11.1 |
| Frontal cortex | 1.42±0.06 | 1.78±0.15 | .01 | 0.04 | 0.6 | 4.3 |
| Parietal cortex | 1.32±0.05 | 1.50±0.05 | .01 | 0.04 | 0.4 | 2.5 |
| Temporal cortex | 1.70±0.23 | 1.89±0.19 | .01 | 0.01 | 0.7 | 2.1 |
| Occipital cortex | 1.44±0.13 | 1.66±0.06 | .01 | 0.01 | 0.2 | 1.0 |
Values are expressed as mean±SD.
For PiB at the 1.5 SD cutoff, the total numbers of positive-voxels (1.1*106) was approximately 5 times greater than for THK5117 (0.2*106). Histogram analysis of the neocortical distribution pattern of PiB and THK5117 positive-voxels shows the THK5117 skewed towards shorter distances (Figure 3). This distribution pattern was not observed in controls (Supplement, Figure S1).
Figure 3. AD distance[v] histogram for neocortical THK5117 and PiB positive voxels (1.5 SD).
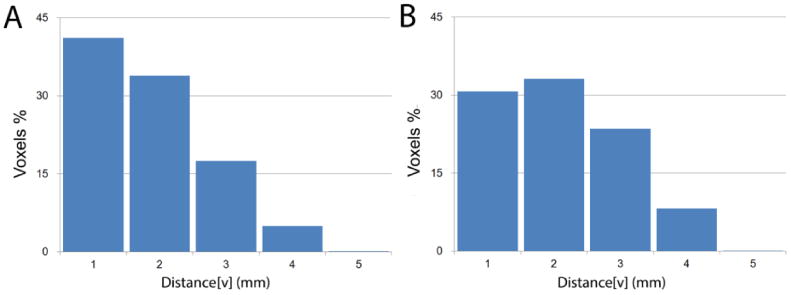
A. distance[v] histogram of THK5117 positive voxels in the total neocortex
B. distance[v] histogram of PiB positive voxels in the total neocortex
The post mortem autoradiography study also showed the tau binding localized to the deeper cortical layers whereas PiB binding was more widely distributed, Figure 4,
Figure 4.
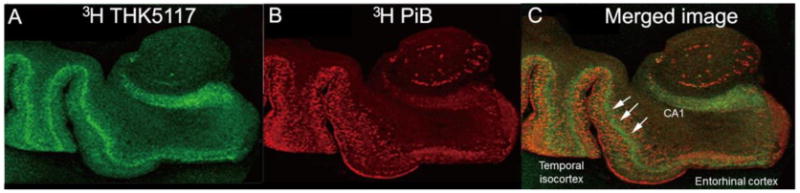
AD autoradiography images: A. 3H-THK5117 (green); B. 3H-PiB (red); C. overlapping tau and amyloid binding (orange), arrows highlight the more inferior tau pathology distribution.
Discussion
Previous studies show a diagnostic value for PiB (5) and for THK5117 (8) in AD. However, the intra-laminar distributions of THK5117 and PiB have not been previously described. In agreement with neuropathology evidence that tau and Aβ, the principal lesions of AD have different cortical lamina distributions (4), we present the first PET imaging confirmation of this distribution pattern. Neurofibrillary pathology in AD is typically found in the deeper cortical lamina while plaques are widely distributed (2,4). In agreement, we found with PET that the average distance[v] of tau-positive cortical voxels to the G-WB is shorter than for Aβ-positive voxels. We observed this effect in each AD subject and for all regions tested. These PET findings are further supported by our post mortem study using THK5117 and PiB to map Aβ and tau pathology.
While the distance[v] difference between the imaged tau and Aβ deposits was approximately 0.2 mm, well-below the spatial resolution of PET (11), due to the large number (∼106) of voxels the effect was significant and observed in all 5 AD patients and in all brain regions. When measured with Cohen's kappa (defined as the mean difference between the PiB and THK5117 distances, divided by overall standard deviation), the effect was nearly 200%.
Our finding of a 5-fold increased magnitude of Aβ over tau positive voxels indicates the greater extent of Aβ pathology. These findings are also consistent with neuropathology (12) and further contribute to the face validity of PET imaging in AD.
Cross-contamination between adjacent cortical and white matter voxels, each with distinct tracer uptake, is referred to as the partial volume artifact. To investigate if our findings can be attributed to this artifact, we generated a conservative control group based regression model that regresses the lesion distance measure on the white matter SUVR. After applying the adjustment to the AD group, the tracer pattern remained significant for all brain regions at the conservative 1.5 SD lesion cutoff.
The current method is of potential interest with subjects experiencing traumatic brain injury, where the laminar distribution of the tau pathology is reported to be more superficial (13). Future studies will also examine continuous measures of tracer retention, where the distance is weighted by the uptake in each voxel.
Conclusion
PET images of AD subjects show different laminar distributions of tau and Aβ deposits. Tau pathology tends to localize in the deeper lamina of the cortical ribbon, whereas the Aβ is more uniformly distributed. This observation may lead to a new biomarker of AD progression. It may also be of use in the evaluation of other neurodegenerative disorders with different tau distributions.
Supplementary Material
Acknowledgments
Work at NYU was supported by NIH/NIA grants AG035137, AG032554, AG022374, AG013616, AG012101, and by the Steven and Alexandra Cohen Veterans Center. Work at Tohoku University Japan was supported by Health and Labor Sciences Research Grants from the Ministry of Health, Labor, and Welfare of Japan, Grant-in-Aid for Scientific Research (B) (23390297), Grant-in-Aid for Scientific Research on Innovative Areas (26117003), “Japan Advanced Molecular Imaging Program (J-AMP)” of the Ministry of Education, Culture, Sports, Science and Technology (MEXT), Japan, and the research fund from GE Healthcare and Sumitomo Electric Industries, Ltd.
References
- 1.Hyman BT, Trojanowski JQ. Consensus recommendations for the postmortem diagnosis of Alzheimer disease from the national institute on aging and the reagan institute working group on diagnostic criteria for the neuropathological assessment of alzheimer disease. J Neuropathol Exp Neurol. 1997;56:1095–1097. doi: 10.1097/00005072-199710000-00002. [DOI] [PubMed] [Google Scholar]
- 2.Thal DR, Rub U, Orantes M, Braak H. Phases of A beta-deposition in the human brain and its relevance for the development of AD. Neurology. 2002;58:1791–1800. doi: 10.1212/wnl.58.12.1791. [DOI] [PubMed] [Google Scholar]
- 3.Braak H, Braak E. Neuropathological stageing of Alzheimer-related changes. Acta Neuropathol. 1991;82:239–259. doi: 10.1007/BF00308809. [DOI] [PubMed] [Google Scholar]
- 4.Hof PR, Bouras C, Buee L, Delacourte A, Perl DP, Morrison JH. Differential distribution of neurofibrillary tangles in the cerebral cortex of dementia pugilistica and Alzheimer's disease cases. Acta Neuropathol. 1992;85:23–30. doi: 10.1007/BF00304630. [DOI] [PubMed] [Google Scholar]
- 5.Klunk WE, Engler H, Nordberg A, et al. Imaging brain amyloid in Alzheimer's disease with pittsburgh compound-B. Ann Neurol. 2004;55:306–319. doi: 10.1002/ana.20009. [DOI] [PubMed] [Google Scholar]
- 6.Chien DT, Szardenings AK, Bahri S, et al. Early clinical PET imaging results with the novel PHF-tau radioligand [F18]-T808. J Alzheimers Dis. 2014;38:171–184. doi: 10.3233/JAD-130098. [DOI] [PubMed] [Google Scholar]
- 7.Okamura N, Furumoto S, Fodero-Tavoletti MT, et al. Non-invasive assessment of Alzheimer's Disease neurofibrillary pathology using 18F-THK5105 PET. Brain. 2014;137:1762–1771. doi: 10.1093/brain/awu064. [DOI] [PubMed] [Google Scholar]
- 8.Ishiki A, Furumoto S, Harada R, et al. Accumulation of the novel tau imaging tracer 18F-THK-5117 is associated with brain atrophy in Alzheimer's Disease. Alzheimer's & Dementia: The Journal of the Alzheimer's Association. 2014;10:131. [Google Scholar]
- 9.Okamura N, Furumoto S, Harada R, et al. Novel 18F-labeled arylquinoline derivatives for noninvasive imaging of tau pathology in Alzheimer disease. J Nucl Med. 2013;54:1420–1427. doi: 10.2967/jnumed.112.117341. [DOI] [PubMed] [Google Scholar]
- 10.Rowe CC, Ng S, Ackermann U, et al. Imaging beta-amyloid burden in aging and dementia. Neurology. 2007;68:1718–1725. doi: 10.1212/01.wnl.0000261919.22630.ea. [DOI] [PubMed] [Google Scholar]
- 11.Rahmim A, Qi J, Sossi V. Resolution modeling in PET imaging: Theory, practice, benefits, and pitfalls. Med Phys. 2013;40:064301. doi: 10.1118/1.4800806. [DOI] [PMC free article] [PubMed] [Google Scholar]
- 12.Mungas D, Tractenberg R, Schneider JA, Crane PK, Bennett DA. A 2-process model for neuropathology of Alzheimer's disease. Neurobiol Aging. 2014;35:301–308. doi: 10.1016/j.neurobiolaging.2013.08.007. [DOI] [PMC free article] [PubMed] [Google Scholar]
- 13.Baugh CM, Stamm JM, Riley DO, et al. Chronic traumatic encephalopathy: Neurodegeneration following repetitive concussive and subconcussive brain trauma. Brain Imaging Behav. 2012;6:244–254. doi: 10.1007/s11682-012-9164-5. [DOI] [PubMed] [Google Scholar]
Associated Data
This section collects any data citations, data availability statements, or supplementary materials included in this article.