

Abstract
Information on respiratory viruses in subtropical region is limited.
Incidence, mortality, and seasonality of influenza (Flu) A/B, respiratory syncytial virus (RSV), adenovirus (ADV), and parainfluenza viruses (PIV) 1/2/3 in hospitalized patients were assessed over a 15-year period (1998–2012) in Hong Kong.
Male predominance and laterally transversed J-shaped distribution in age-specific incidence was observed. Incidence of Flu A, RSV, and PIV decreased sharply from infants to toddlers; whereas Flu B and ADV increased slowly. RSV conferred higher fatality than Flu, and was the second killer among hospitalized elderly. ADV and PIV were uncommon, but had the highest fatality. RSV, PIV 2/3 admissions increased over the 15 years, whereas ADV had decreased significantly. A “high season,” mainly contributed by Flu, was observed in late-winter/early-spring (February–March). The “medium season” in spring/summer (April–August) was due to Flu and RSV. The “low season” in late autumn/winter (October–December) was due to PIV and ADV. Seasonality varied between viruses, but predictable distinctive pattern for each virus existed, and temperature was the most important associating meteorological variable.
Respiratory viruses exhibit strong sex- and age-predilection, and with predictable seasonality allowing strategic preparedness planning. Hospital-based surveillance is crucial for real-time assessment on severity of new variants.
INTRODUCTION
Respiratory viruses are responsible for significant global morbidity and mortality. Nearly half of pediatric community acquired pneumonia and a quarter of adult cases have evidence of viral infection.1,2 The World Health Organization predicted that lower respiratory tract infections will be the third leading cause of death in 2015.3 A thorough understanding of incidence, mortality, and seasonality of respiratory viruses is fundamental to the optimization of preparedness planning; and for real-time assessment of the severity of newly emerged variants.
The seasonality of respiratory viruses in subtropical regions is complicated, and its correlation with meteorological changes is different from those observed in the temperate regions.4–6 To improve our understanding on the disease burden and seasonality of common respiratory viruses in subtropical regions, we analyzed data from a district hospital in Hong Kong. Hong Kong is a small cosmopolitan city located on the coast of Southern China (22.3°N, 114.2°E), with a subtropical climate tending toward temperate for half of the year. January–February are the coldest months, with temperatures below 10°C occasionally in the urban areas. March–April are the spring months with relatively higher humidity. May–September are hot and humid with afternoon temperatures often exceeding 31°C. October–December are dry with comfortable temperatures.7
MATERIALS AND METHODS
Study Population
A 15-year (1998–2012) retrospective study was conducted at the Prince of Wales Hospital, a 1400-bed district general hospital serving 9% (0.6 million) of Hong Kong population. To account for changes in catchment population, the closest census or bi-census data of each year were used to estimate hospitalization incidence and mortality rates.8
Laboratory Diagnosis
As part of the routine clinical management, nasopharyngeal aspirate (NPA) samples were collected from patients presented with acute respiratory illnesses soon after admission to hospital. Immunofluorescence-based rapid antigen detection assays were used to detect 7 viruses including influenza A and B, respiratory syncytial virus (RSV), parainfluenza virus (PIV) 1, 2, and 3, and adenovirus (ADV). In brief, NPA samples were washed with phosphate-buffered saline. The cells were fixed on the wells of a glass slide with acetone and stained with respiratory virus-specific antibodies (Light Diagnostics, Chemicon/Millipore, Germany). Specific fluorescent signals were cross-checked by 2 experienced technicians.
Case Identification
Hospitalized patients with laboratory-confirmed diagnosis of influenza A or B, RSV, PIV 1, 2, or 3, or ADV were identified from computerized hospital records.
At-Risk Population
“At-risk population” was defined as age ≤15 or ≥51 years, since they constituted 90% of cases hospitalized over the study period. Hospitalization incidence of the at-risk population was used to analyze trends over the study period, and for assessing correlation between virus activity and meteorological factors.
2009 Pandemic
A vast majority of influenza A-associated admissions in 2009 were due to pandemic virus influenza A (H1N1)pdm09, which exhibited epidemiological characteristics different from seasonal influenza.9 To avoid biases, data from 2009 were excluded when analyzing the seasonality, incidence, and mortality of influenza A.
Epidemic Period
“Epidemic period” was defined as having weekly case number ≥3.8% of the annual total (ie, ≥2 × average) and with ≥5 cases per week.
Mortality
Patients who died within 30 days after the diagnosis of infection were included in mortality analysis.
Meteorological and Air Quality Data
Daily mean temperature, rainfall, mean relative humidity, global solar radiation, and sunshine duration were provided by the Hong Kong Observatory.7 Air quality data including hourly concentrations of nitrogen dioxide (NO2), sulfur dioxide (SO2), ozone (O3), and particulate matter (PM)-10 were provided by the Environmental Protection Department. Daily means for NO2, SO2, and PM-10, and 8-hr (9 am–5 pm) mean of O3 were computed for the purpose of analysis in this study.
Correlation With Meteorological Variation
Poisson generalized additive modeling (GAM) with a log-link function was used to model the relationship between daily pollutant concentrations and health outcomes. The quasi-likelihood method was used to correct for over-dispersion.10 All models were adjusted for the day of the week (DOW) and public holidays using categorical indicator variables.11 Smoothing splines12,13 were used to adjust for seasonal patterns and long-term trends in daily counts of incidence, with degrees of freedom (df) selected a priori based on previous studies.14,15 The partial autocorrelation function plot for residuals were examined and autoregressive terms were added to minimize autocorrelation if necessary.16 When these criteria were not met, autoregressive terms were added to the model. The model was fitted using the gam() function of R.
Based on the above core model, the effect of daily mean temperature, mean relative humidity, global solar radiation, rainfall, and sunshine duration, at different lags (with df = 6) after adjusting for NO2 (lag 0), PM-10 (lag 0), SO2 (lag 0), and O3 (lag 1) were estimated. The choice of lag for pollutants was based on our previous study.16 The choice of lag days for temperature, relative humidity, global solar radiation, and sunshine duration was based on the minimal value of Akaike information criterion. The smoothed plot for the chosen lag was produced and the P value of the smoothed term was extracted. Significant smooth terms were put into the multiple model.
The Joint Chinese University of Hong Kong—New Territories East Cluster Clinical Research Ethics Committee (The Joint CUHK-NTEC CREC) approved the study.
RESULTS
Incidence and Mortality
Hospitalization Incidence
Over the 15 years (1998–2012), 19,405 patients were hospitalized with laboratory-confirmed respiratory virus infections including influenza A (7655 cases, 39.4%), RSV (4839 cases, 24.9%), influenza B (1980 cases, 10.2%), ADV (1937 cases, 10.0%), PIV 3 (1792 cases, 9.2%), PIV 1 (1025 cases, 5.3%), and PIV 2 (177 cases, 0.9%). On average, 431.4/10,000 children < 5 years were hospitalized annually for respiratory viral infection, with RSV ranked top (157.7/10,000 person-years), followed by influenza A (107.7/10,000), ADV (53.8/10,000), PIV 3 (51.3/10,000), PIV 1 (29.9/10,000), influenza B (27.4/10,000), and PIV 2 (3.6/10,000). For elderly ages ≥65 years, an average of 32.7/10,000 persons were hospitalized annually for respiratory viral infection, with influenza A ranked top (18.3/10,000), followed by RSV (5.7/10,000), influenza B (3.5/10,000), PIV 3 (3.4/10,000), PIV 1 (1.4/10,000), ADV, and PIV 2 both with0.2/10,000 (Table 1; Fig. 1 A).
TABLE 1.
Annual Hospitalization Incidence and Mortality Due to Common Respiratory Viruses Among Different Age and Sex Groups
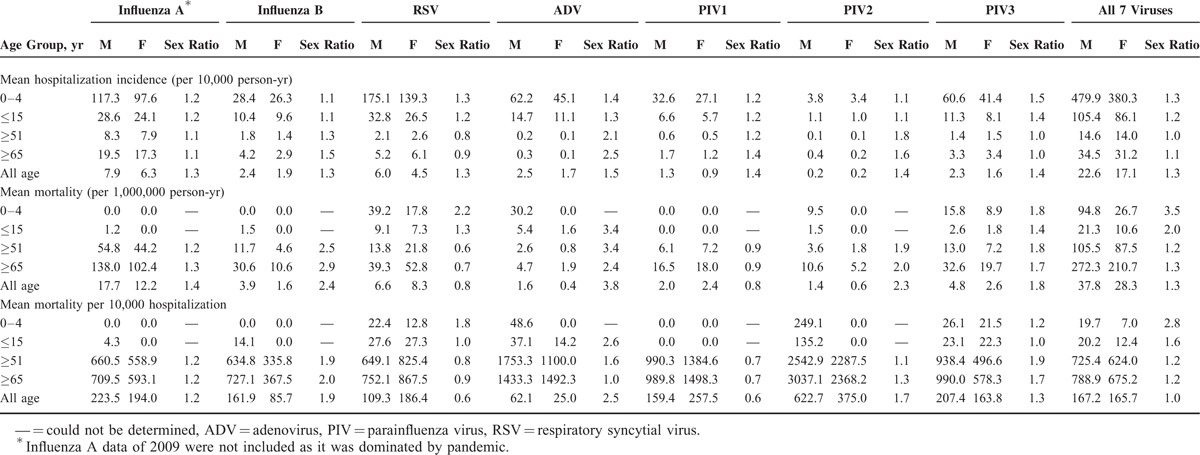
FIGURE 1.
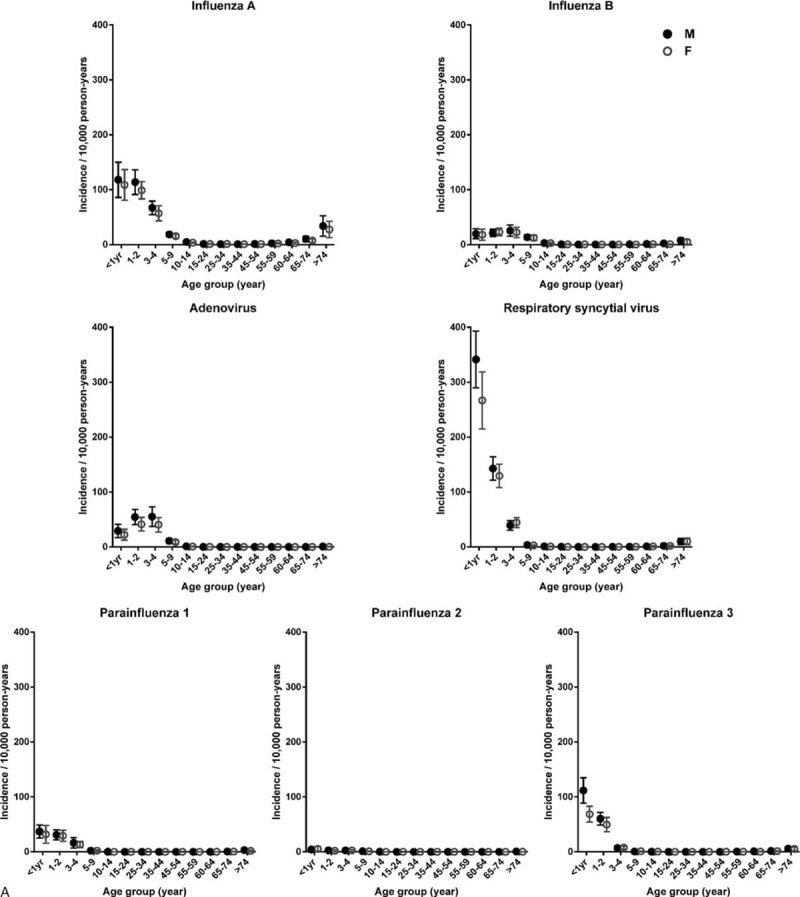
Age- and sex-specific annual incidence of hospitalization and mortality attributed to common respiratory viruses. Circular dots and error bars represent, respectively, the means and 95% confidence intervals of (A) annual incidence of hospitalization and (B) mortality from 1998 to 2012. Solid dots indicate male. Empty dots indicate female. The data of influenza A in 2009 were not included as it was dominated by pandemic.
Overall (excluding 2009), influenza A accounted for 64.4% to 94.0% (mean: 75.8%) of influenza admissions. In 2009, 97.8% of influenza cases were due to pandemic virus.
The age-specific hospitalization incidence curve exhibited a laterally transversed J shape, with high incidence among young children and low-to-moderate incidence among the elderly (Fig. 1A, Table 1, and Table S1). Two patterns of change from infants to toddlers were observed. Influenza A, RSV, PIV 1, and PIV 3 showed the highest incidence among infants and decreased with age, whereas the incidence of influenza B and ADV increased from infants to toddlers, reaching a peak at 3 to 4 years.
Linear regression showed a significant trend of increase in annual hospitalization incidence for RSV (β = 3.310, P = 0.040), PIV 2 (β = 0.516, P = 0.008), and PIV 3 (β = 2.427, P = 0.001), whereas ADV showed a significant trend of decrease (β = −3.561, P = 0.040) (Fig. 2).
FIGURE 1 (Continued).
Age- and sex-specific annual incidence of hospitalization and mortality attributed to common respiratory viruses. Circular dots and error bars represent, respectively, the means and 95% confidence intervals of (A) annual incidence of hospitalization and (B) mortality from 1998 to 2012. Solid dots indicate male. Empty dots indicate female. The data of influenza A in 2009 were not included as it was dominated by pandemic.
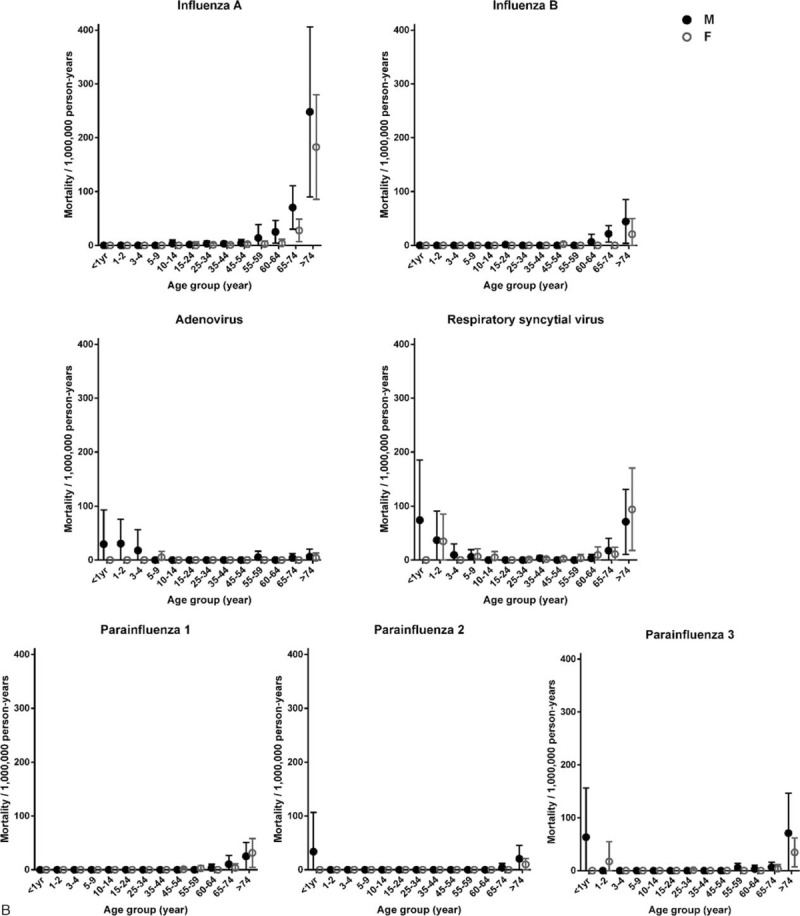
Mortality
Over the 15 years, 308 patients died within 30 days (mean: 10, standard deviation: 8.3) after diagnosis. Majority of these were influenza A (45.5%), followed by RSV (22.7%), PIV 3 (11.0%), influenza B (8.1%), PIV 1 (6.8%), ADV (2.9%), and PIV 2 (2.9%). The fraction attributed to each virus varied markedly with age. Among children < 5 years, RSV ranked top (50.0%), followed by ADV (25.0%), PIV 3 (18.8%), and PIV 2 (6.3%). No death was recorded for other viruses. Among the elderly ≥ 65 years, influenza A accounted for 48.1%, followed by RSV (20.1%), PIV 3 (11.3%), influenza B (8.4%), PIV 1 (7.5%), PIV 2 (3.4%), and ADV (1.3%). Of the 154 influenza-associated deaths (exclude 11 due to 2009 pandemic), influenza B accounted for 16.2% (25/154).
Two age-related patterns of mortality were observed (Fig. 1B, Table 1, and Table S2). The mortality of influenza B, PIV 1, and most remarkably influenza A was mainly confined to the elderly, whereas mortality of ADV, RSV, and PIV 2 and 3 involved extremes of age. Of note, children < 5 years and elderly > 65 years shared a similar mortality due to RSV.
Hospitalization–Fatality Ratio
While PIV 2 had the lowest hospitalization incidence, it carried the highest fatality per hospitalization for both children and the elderly (Table 1). Similarly, ADV had a relatively low hospitalization incidence (ranked forth), but a high (ranked second) hospitalization–fatality ratio.
Sex Predilection
A predilection for males in incidence was observed (Fig. 1A). The all-age, male-to-female hospitalization incidence ratios ranged from 1.3 to 1.5 (Table 1). Subgroup analyses revealed similar observations, with the exception of age ≥ 51 years for RSV and PIV 3. The number of PIV 3 cases for age ≥ 51 years might be too few to ascertain sex distribution.
Similar gender predilection was observed for mortality (Fig. 1B). The male-to-female mortality ratios for all 7 viruses combined ranged from 1.2 to 3.5 among different age groups (Table 1). Analyses focused on each virus revealed similar observations, except RSV and PIV 1 among age ≥ 51 years. The number of PIV 1 cases for age ≥ 51 years might be too low to ascertain sex distribution.
Seasonality
Admission Overview
The mean monthly temperature, relative humidity, total rainfall, global solar radiation, and sunshine duration are shown in Figures S1 and S2. Overall, 3 seasons of respiratory viral activity were observed (Fig. 3A). The “high season” occurred in late-winter/early-spring (week 5–12, February–March) with 36 to 38 admissions/week, of which 60% to 70% were influenza A and B (Fig. 3A).
FIGURE 2.
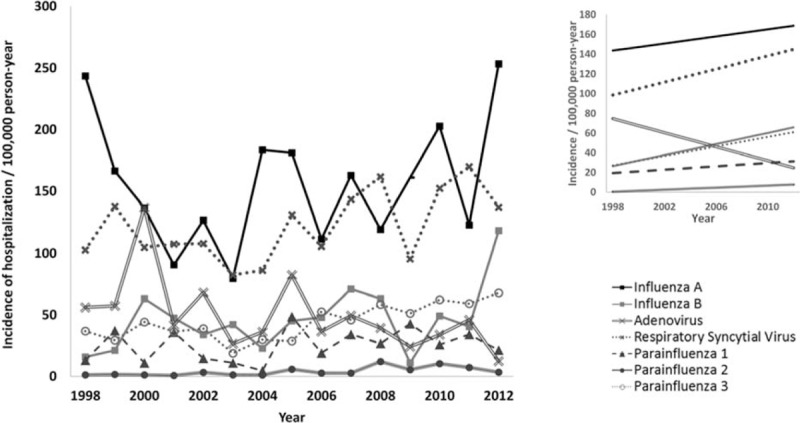
Trend of change in hospitalization incidence attributed to common respiratory viruses, 1998 to 2012. The main figure shows the actual annual incidence of hospitalization among the “at-risk” population defined as age ≤15 and ≥51 years. The right upper insert shows estimates based on linear regression model. The data of influenza A in 2009 were not included in the model as it was dominated by pandemic. β and P value for influenza A: 1.797 and 0.604, respectively; influenza B: 2.811 and 0.076, respectively; adenovirus: −3.561 and 0.040, respectively; RSV: 3.310 and 0.040, respectively; parainfluenza 1: 0.853 and 0.294, respectively; parainfluenza 2: 0.516 and 0.008, respectively; parainfluenza 3: 2.427 and 0.001, respectively. RSV = respiratory syncytial virus.
The “medium season” occurred in rainy months of spring and summer (week 13–36, April–August), with 23 to 28 admissions/week. This was the “Flu-RSV period” where influenza and RSV accounted for 40% to 51% and 21% to 44% of cases, respectively (Fig. 3A).
The “low season” occurred in late autumn and winter (week 41–52, October–December), with around 13 admissions/week. This was the “PIV-ADV period” with PIV 1/2/3 and ADV accounting for 39% to 50% and 19% to 25% of cases, respectively (Fig. 3A).
Mortality Overview
Two seasonal peaks of mortality in elderly occurred in February (week 5–8, 0.7 death/week) and mid-August to September (week 33–36, 0.5 death/week), respectively (Fig. 3B). Influenza accounted for 73% of the first peak, whereas influenza and RSV each accounted for 45% of the second peak.
Patterns and Variations
The overall seasonality of each virus is shown in Figure 4, and the year-to-year variation is shown in Figure 5.
FIGURE 3.
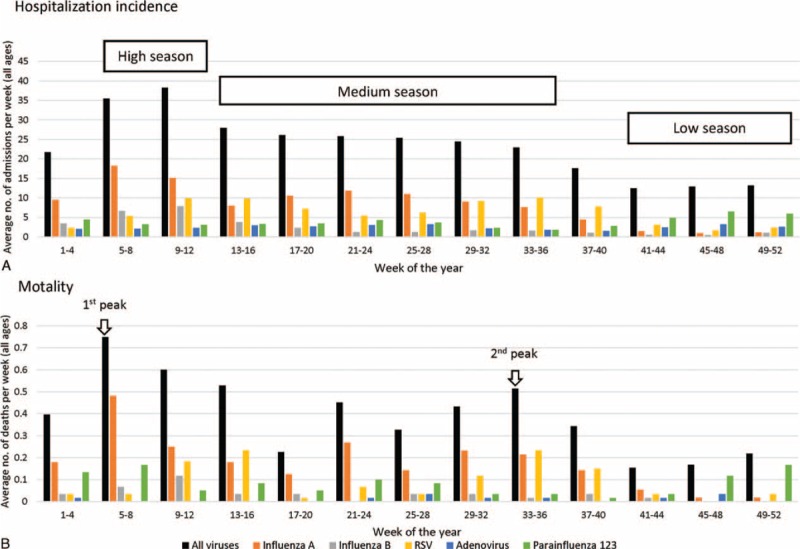
Overview on hospitalization, mortality, and seasonality of common respiratory viruses.
FIGURE 4.
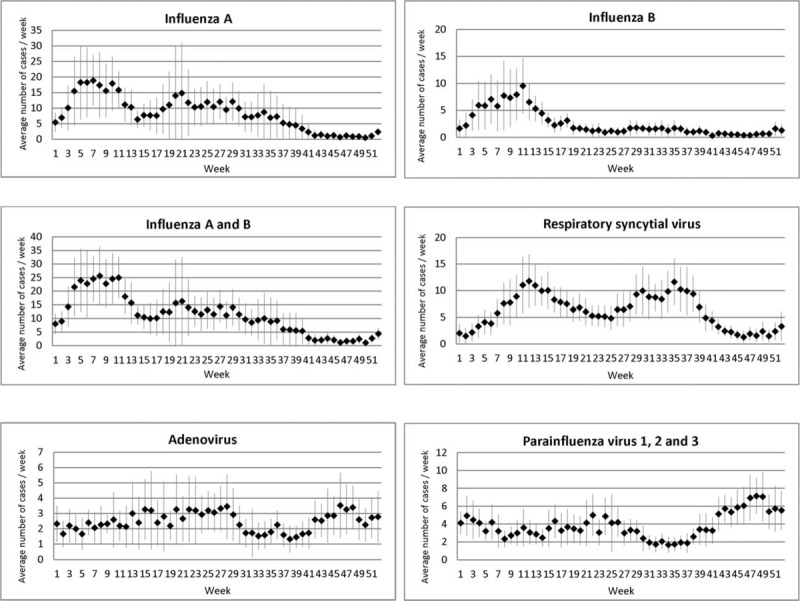
Hospitalization due to common respiratory viruses according to week of the year. Squares and lines indicate, respectively, means and 95% confidence intervals of number of hospitalized cases per week over the 15-year study period, 1998 to 2012. The data of influenza A in 2009 were not included as it was dominated by pandemic.
Influenza A
Overall, influenza A exhibited bi-annual peaks with highest activity in late-winter/early-spring (late-January to mid-March) followed by another wave of moderate activity lingering through summer and autumn (May to early September) (Fig. 4).
Year-to-year variation followed 3 patterns. The “strong-winter” pattern observed in 5 of the 15 years (1998, 1999, 2000, 2003, and 2011) was characterized by an early (week 3–4) winter epidemic lasting for 6 to 9 weeks, then followed by a low level of activity in the rest of the year. The “strong-summer” pattern observed in 7 of 15 years (2005–2010, 2012) was characterized by a sharp summer epidemic lasting 4 to 9 weeks and with moderate activity in the preceding winter months. In recent years, a shift of summer epidemics to later part of the year was observed (May in 2005 to August in 2010).
The third pattern was a moderate epidemic starting late (February–March) and lingering over a long period till July as observed in 2001, 2002, and 2004.
Influenza B
Influenza B epidemics mainly concentrated at late-winter/early-spring (mid-January/late-March) with less variation compared to influenza A (Figs. 4 and 5). Majority of the years showed a “strong-winter” pattern; except 2004 with a “strong-summer,” 2001 and 2007 showing a “mixed” pattern with low levels of activity scattered through winter and summer months. Influenza B epidemics often started in mid-January to mid-February lasting for 6 to 12 weeks. In 2 years (2003 and 2012), the epidemic started in mid-December of the previous year and lasted for a long period (3 months).
RSV
The activity of RSV lasted longer than influenza, spreading through week 8 to 40 (late-February to late-September) with annual peaks occurring either in week 10 to 15 (early-March to mid-April) or week 29 to 38 (mid-July to mid-September) (Figs. 4 and 5).
Adenovirus and Parainfluenza Viruses
A low-level activity of ADV and PIVs was observed throughout the year. ADV decreased slightly in August–September, whereas PIV increased moderately in winter (October–December) (Figs. 4 and 5).
Correlation With Meteorological Factors
Temperature was the most important meteorological factor showing a significant independent association with all viruses except ADV (Fig. 6). Influenza A and B, and RSV showed a similar pattern where virus activity was the lowest at mild temperature (20°C), but higher at colder and warmer temperatures. PIV showed the opposite with higher activity at mild temperature (20–25°C), but lower at colder and warmer temperatures. The activity of influenza A changed most sharply with temperature compared to others. Significantly higher activity was observed at <13°C, and significantly lower activity was observed at 17 to 23°C, but significantly higher activity appeared again at temperatures above 28°C.
FIGURE 5.
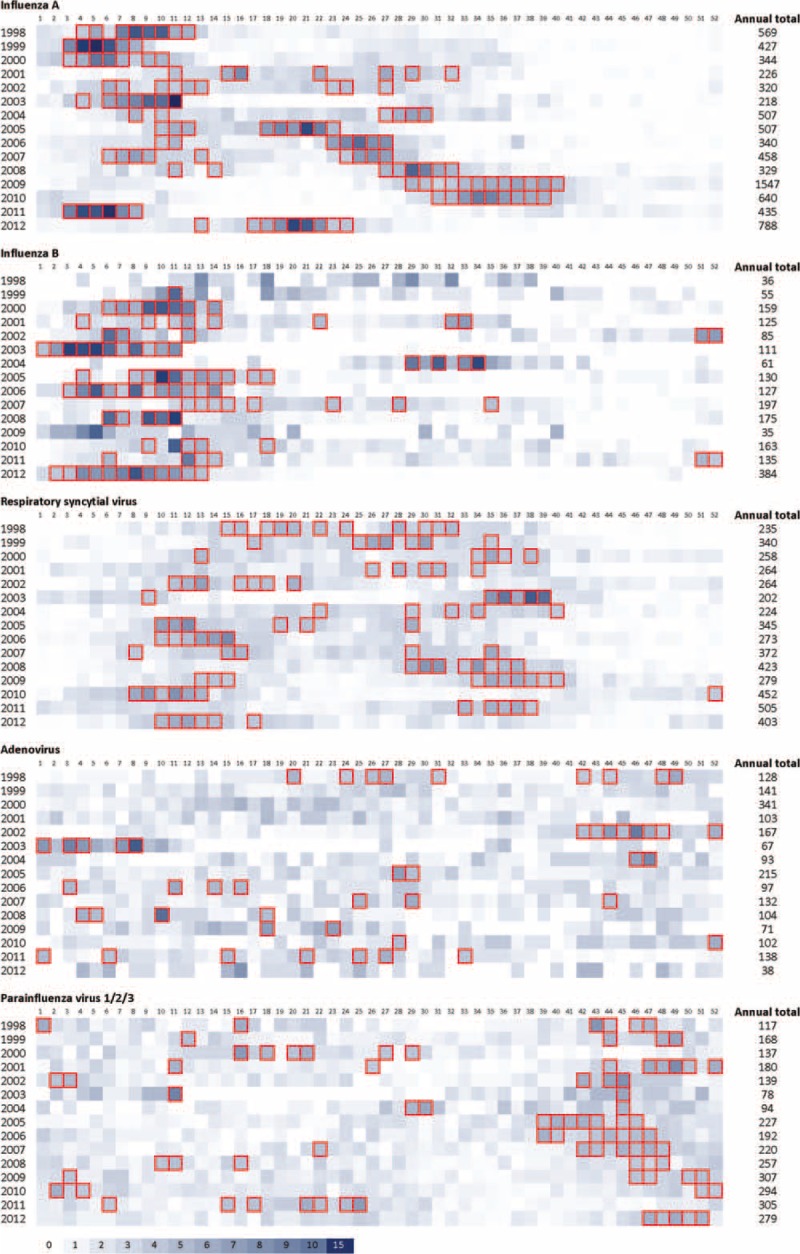
Heat map showing year-to-year variation in temporal distribution of hospitalization due to common respiratory viruses, 1998 to 2012. Numbers at the top indicate week of the year. The data of influenza A in 2009 include pandemic and seasonal viruses. Intensity of shading reflects proportion of cases identified during that week (no. of cases of the week/annual total). Boxes represent epidemic periods defined as having weekly no. of case ≥3.8% of the annual total (ie, ≥2 times of the expected average) and with a minimum of 5 cases per week.
FIGURE 6.
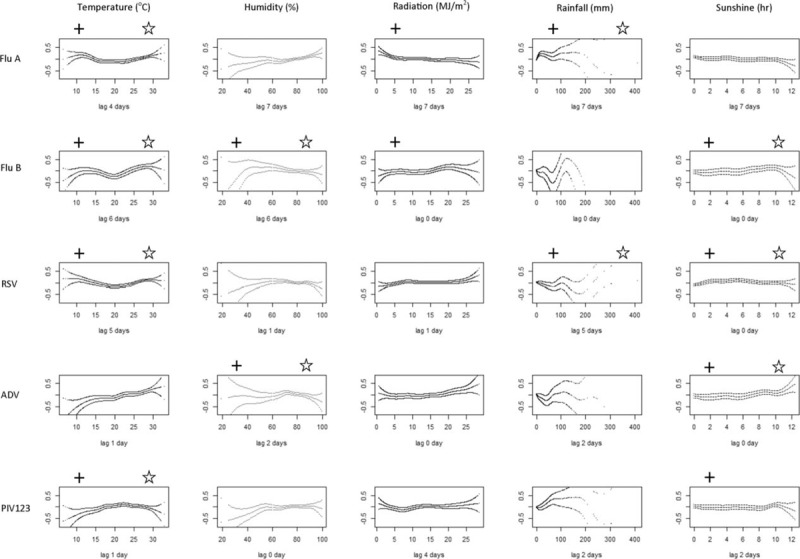
Correlation between meteorological factors and incidence of hospitalization due to common respiratory viruses. The log-relative risk (log-RR) were computed using generalized additive model after adjusting for time trend, day of the week, and 4 major pollutants. The df was chosen as 6 for each meteorological variable. ADV = adenovirus; Flu A = influenza A excluding data from 2009 and later to avoid the influence of pandemic; Flu B = influenza B; RSV = respiratory syncytial virus; PIV 123 = parainfluenza virus 1, 2, and 3. +P ≤ 0.05 in univariate analysis; P ≤ 0.05 in multivariate analysis. In case, the univariate analysis revealed significant association for both sunshine and radiation, P only sunshine was included in multivariate analysis for avoiding co-linearity due to the high correlation between these 2 variables.
Significantly higher activity of influenza B and ADV was observed when the sunshine duration was long (8–10 hr), whereas the activity of RSV was higher when sunshine duration was short (4–6 hr).
Influenza B and ADV showed an independent association with daily mean relative humidity. A significantly higher activity was observed at relative humidity of 62% for influenza B and at 73% for ADV.
Influenza A and RSV showed a significant association with rainfall, but with different patterns. The activity of influenza A was significantly higher at the low levels of rainfall (0–50 mm/day), whereas RSV activity was lower at this range.
DISCUSSION
This study was based on a routine rapid diagnostic service covering 7 common viruses offered throughout the 15-year study period. It provides a comprehensive overview of the seasonality, morbidity, and mortality of these common viruses, which not only enhances our epidemiological understanding but also provides important information for public health decision making.
Firstly, predilection for males in incidence and mortality among children was observed for all viruses. This could at least partly be explained by the gender differences in immune response to infection.17 While most viruses, including influenza, reproduced a similar gender bias among the elderly, RSV was a notable exception. The reasons for this interesting observation remain to be explored. Nevertheless, countries with growing gender imbalance toward male, like China, will face even heavier disease burden attributed to respiratory viruses.
Secondly, RSV which is traditionally associated with the pediatric population was found in this study to confer a remarkably high disease burden among elderly, indicating that clinical trials of new antivirals need to be conducted in children as well as in the elderly. A previous meta-analysis showed that almost all RSV-associated deaths reported from developed countries occurred in infants, whereas in developing countries it also occurred in the second year of life.18 While Hong Kong had a GDP per capita of US$37,859 at 2013 and is regarded as a developed city,19 our RSV mortality mimics developing countries with notable deaths in the second year of life, possibly reflecting our subtropical location rather than our developmental status.
RSV confers a high disease burden in both children and elderly, but vaccine and antiviral are not available. In this regard, understanding the seasonality of RSV could help formulating a cost-effective strategy for immunoprophylaxis. The seasonality of RSV varies widely across the globe.20 In a study covering 7 tropical and subtropical countries, the onset and peak of RSV activity was found throughout January–December depending on location.21 In Hong Kong, we found that the annual epidemic of RSV occurred in either spring or summer, which is in contrast to temperate regions where the activity is highest in winter. Our data indicated that RSV immunoprophylaxis for high-risk infants in Hong Kong should cover at least 2 periods (March–May and July–September).
Thirdly, a few epidemiological characteristics of influenza that may have public health implications were observed. A previous meta-analysis estimated that 91% of hospitalizations worldwide for children < 5 years were due to RSV18; however, our hospitalization incidence for influenza and RSV among children was comparable. In fact, our hospitalization incidence of influenza among children < 5 years was 5 times higher than that of Thailand.22 The high admission rate among infants and young children due to influenza calls for more intense vaccination targeting pregnant women and children.23 At present the vaccine uptake rate of children in Hong Kong is only around 28%.24 Since influenza B showed an increase in incidence from infants to toddlers, and it accounts for a greater portion of cases in children than in older age groups; the use of quadrivalent vaccines would be more cost-effective.25–27
Preparedness planning according to seasonality is critical to cater for the upsurge in demand for healthcare facilities during peak seasons. While influenza seasons are well known to be variable in the tropical and subtropical regions, we found that it is still predictable. Influenza seasons often started around the end of January lasting for 6 to 12 weeks. In contrast to a single annual peak in temperate regions, we observed a second peak in summer months. Having 2 peaks might partly account for the high annual incidence in Hong Kong. More importantly, our data suggested that the second flu season is becoming heavier and moving toward later months. If this continues, vaccine protection would need to last for 9 months or longer, which is a challenge to current vaccines. Monitoring of vaccine effectiveness during summer flu peaks should be in place.
Fourthly, while ADV and PIV were uncommon among hospitalized elderly, they were found to carry the highest hospitalization-mortality rate. Because of resource constraints, most hospitals only test for treatable or common viruses. These rare but more severe infections could have been missed.
In temperate regions, highest respiratory viral activity, especially influenza and RSV, typically occurs in the cold and dry winter.28,29 The “enhanced winter survival” and “wintertime immune suppression” theories proposed to explain such observation may not be applicable to subtropical regions like Hong Kong.30 Instead, respiratory viruses were active over a wide range of weather conditions lasting through late-winter, spring, and summer. It could be that winter in subtropics is not dry enough to favor aerosol transmission.31
The seasonality of respiratory viruses in subtropical regions is complicated and only limited information is available.4–6 We found that temperature was a key factor showing independent correlation with most viruses. However, the correlation was not straightforward. For example, influenza peaks were found in both cold and hot months. In coastal places like Hong Kong, the humidity remains high for half of the year. The wet conditions increase amount of viruses deposited on surfaces and increase their survival in droplets, thus favoring contact transmission.32 The wet season (April–September) effect appeared to be stronger for RSV than for influenza, suggesting a preference for contact transmission of the former.
We pooled different types of PIV in the analysis for meteorological associations. Since PIV 3 was the predominant type, it contributed a major effect on the outcome. One should note that different PIV virus types might not carry the same seasonality.33–35 Nevertheless, our findings that PIV peaks in a period with low activity of influenza is in line with the observation from tropical country, Brazil36 and subtropical country, Japan.37
This study has limitations. The incidence and mortality rates could have been underestimated as we could have missed cases shedding a very low concentration of virus that could only be detected by more sensitive methods such as PCR. Furthermore, patients living in our catchment area could have received medical care in other districts. Nevertheless, this report documents the high disease burden of common respiratory viruses in a developed subtropical city. The population-specific hospitalization and mortality data are essential baselines for rapid assessment on the severity of newly emerged strains, and inform public health decisions. The age/gender-bias in disease burden revealed is instrumental for long-term planning according to changes in population composition. Despite year-to-year variation, the seasonality of respiratory viruses in subtropics is still predictable. These data captured over a long period of 15 years are valuable for strategic planning.
Supplementary Material
Footnotes
Abbreviations: ADV = adenovirus, AIC = Akaike information criterion, df = degrees of freedom, DOW = day of the week, Flu = influenza, GAM = generalized additive modeling, NO2 = nitrogen dioxide, O3 = ozone, PIV = parainfluenza viruses, PM = particulate matter, RSV = respiratory syncytial virus, SO2 = sulfur dioxide.
Authors’ contributions: PKSC designed and supervised the study; WWST and MCSW performed statistical analysis; KLH, NL, TFL, EASN, and DSCH collected clinical data; HYM and TCL collated and analyzed meteorological data; MCWC, ACMY, and WCSH collected and collated laboratory data. All authors contributed to data interpretation and manuscript preparation.
This work was supported by University Grants Committee (AoE/M-12/06).
The authors have no funding and conflicts of interest to disclose.
REFERENCES
- 1.Ruuskanen O, Lahti E, Jennings LC, et al. Viral pneumonia. Lancet 2011; 377:1264–1275. [DOI] [PMC free article] [PubMed] [Google Scholar]
- 2.Juvén T, Mertsola J, Waris M, et al. Etiology of community-acquired pneumonia in 254 hospitalized children. Pediatr Infect Dis J 2000; 19:293–298. [DOI] [PubMed] [Google Scholar]
- 3.Projections of mortality and causes of death, 2015 and 2030. W.H.O. http://www.who.int/healthinfo/global_burden_disease/projections/en/, Accessed December 2, 2014. [Google Scholar]
- 4.Chan PK, Mok HY, Lee TC, et al. Seasonal influenza activity in Hong Kong and its association with meteorological variations. J Med Virol 2009; 81:1797–1806. [DOI] [PubMed] [Google Scholar]
- 5.Hsu CH, Lin CY, Chi H, et al. Prolonged seasonality of respiratory syncytial virus infection among preterm infants in a subtropical climate. PLoS ONE 2014; 9:e110166. [DOI] [PMC free article] [PubMed] [Google Scholar]
- 6.He Y, Lin GY, Wang Q, et al. A 3-year prospective study of the epidemiology of acute respiratory viral infections in hospitalized children in Shenzhen, China. Influenza Other Respir Viruses 2014; 8:443–451. [DOI] [PMC free article] [PubMed] [Google Scholar]
- 7.Hong Kong Observatory. 2012. Climate of Hong Kong. http://www.weather.gov.hk/cis/climahk_e.htm Accessed January 29, 2015. [Google Scholar]
- 8.Population Census Interactive Dissemination Services, Census and Statistics Department, The Government of Hong Kong Special Administrative Region. http://itable.censtatd.gov.hk/UI/Report/Report.aspx?lang=en-US Accessed October 15, 2013. [Google Scholar]
- 9.Lee N, Chan PK, Lui GC, et al. Complications and outcomes of pandemic 2009 influenza A (H1N1) virus infection in hospitalized adults: how do they differ from those in seasonal influenza? J Infect Dis 2011; 203:1739–1747. [DOI] [PubMed] [Google Scholar]
- 10.Hastie T, Tibshirani R. Generalized additive models for medical research. Stat Methods Med Res 1995; 4:187–196. [DOI] [PubMed] [Google Scholar]
- 11.Schwartz J, Spix C, Touloumi G, et al. Methodological issues in studies of air pollution and daily counts of deaths or hospital admissions. J Epidemiol Commun Health 1996; 50 Suppl 1:S3–S11. [DOI] [PMC free article] [PubMed] [Google Scholar]
- 12.Host S, Larrieu S, Pascal L, et al. Short-term associations between fine and coarse particles and hospital admissions for cardiorespiratory diseases in six French cities. Occup Environ Med 2008; 65:544–551. [DOI] [PubMed] [Google Scholar]
- 13.Kan H, Chen B. Air pollution and daily mortality in Shanghai: a time-series study. Arch Environ Health 2003; 58:360–367. [PubMed] [Google Scholar]
- 14.Bell ML, Ebisu K, Peng RD, et al. Seasonal and regional short-term effects of fine particles on hospital admissions in 202 US counties. Am J Epidemiol 2008; 168:1301–1310. [DOI] [PMC free article] [PubMed] [Google Scholar]
- 15.Peng RD, Chang HH, Bell ML, et al. Coarse particulate matter air pollution and hospital admissions for cardiovascular and respiratory diseases among Medicare patients. JAMA 2008; 299:2172–2179. [DOI] [PMC free article] [PubMed] [Google Scholar]
- 16.Wong TW, Tam WW, Yu IT, et al. Developing a risk-based air quality health index. Atmos Environ 2012; 76:52–58. [Google Scholar]
- 17.Fish EN. The X-files in immunity: sex-based differences predispose immune responses. Nat Rev Immunol 2008; 8:737–744. [DOI] [PMC free article] [PubMed] [Google Scholar]
- 18.Nair H, Nokes DJ, Gessner BD, et al. Global burden of acute lower respiratory infections due to respiratory syncytial virus in young children: a systematic review and meta-analysis. Lancet 2010; 375:1545–1555. [DOI] [PMC free article] [PubMed] [Google Scholar]
- 19.Hong Kong—the facts. http://www.gov.hk/en/about/abouthk/facts.htm Accessed October 21, 2014. [Google Scholar]
- 20.Tang JW, Loh TP. Correlations between climate factors and incidence—a contributor to RSV seasonality. Rev Med Virol 2014; 24:15–34. [DOI] [PubMed] [Google Scholar]
- 21.Haynes AK, Manangan AP, Iwane MK, et al. Respiratory syncytial virus circulation in seven countries with Global Disease Detection Regional Centers. J Infect Dis 2013; 208 Suppl 3:S246–S254. [DOI] [PubMed] [Google Scholar]
- 22.Simmerman JM, Chittaganpitch M, Levy J, et al. Incidence seasonality and mortality associated with influenza pneumonia in Thailand: 2005–2008. PLoS ONE 2009; 4:e7776. [DOI] [PMC free article] [PubMed] [Google Scholar]
- 23.Nelson EA, Ip M, Tam JS, et al. Burden of influenza infection in hospitalised children below 6 months of age and above in Hong Kong from 2005 to 2011. Vaccine 2014; 32:6692–6698. [DOI] [PMC free article] [PubMed] [Google Scholar]
- 24.2013; Chan D. Seasonal influenza vaccination coverage survey for the 2012/13 season. 10:74. [Google Scholar]
- 25.Chan PK, Chan MC, Cheung JL, et al. Influenza B lineage circulation and hospitalization rates in a subtropical city Hong Kong, 2000–2010. Clin Infect Dis 2013; 56:677–684. [DOI] [PubMed] [Google Scholar]
- 26.You JH, Ming WK, Chan PK. Cost-effectiveness analysis of quadrivalent influenza vaccine versus trivalent influenza vaccine for elderly in Hong Kong. BMC Infect Dis 2014; 14:618. [DOI] [PMC free article] [PubMed] [Google Scholar]
- 27.You JH, Ming WK, Chan PK. Cost-effectiveness of quadrivalent influenza vaccine in Hong Kong—a decision analysis. Hum Vaccin Immunother 2015; 11:564–571. [DOI] [PMC free article] [PubMed] [Google Scholar]
- 28.Tang JW, Loh TP. Correlations between climate factors and incidence—a contributor to RSV seasonality. Rev Med Virol 2014; 24:15–34. [DOI] [PubMed] [Google Scholar]
- 29.duPrel JB, Puppe W, Gröndahl B, et al. Are meteorological parameters associated with acute respiratory tract infections? Clin Infect Dis 2009; 49:861–868. [DOI] [PubMed] [Google Scholar]
- 30.Fisman D. Seasonality of viral infections: mechanisms and unknowns. Clin Microbiol Infect 2012; 18:946–954. [DOI] [PubMed] [Google Scholar]
- 31.Yang W, Marr LC. Dynamics of airborne influenza A viruses indoors and dependence on humidity. PLoS ONE 2011; 6:e21481. [DOI] [PMC free article] [PubMed] [Google Scholar]
- 32.Paynter S. Humidity and respiratory virus transmission in tropical and temperate settings. Epidemiol Infect 2014; 13:1–9. [DOI] [PMC free article] [PubMed] [Google Scholar]
- 33.Mizuta K, Abiko C, Aoki Y, et al. Epidemiology of parainfluenza virus types 1, 2 and 3 infections based on virus isolation between 2002 and 2011 in Yamagata, Japan. Microbiol Immunol 2012; 56:855–858. [DOI] [PubMed] [Google Scholar]
- 34.Moore HC, de Klerk N, Richmond P, et al. Seasonality of respiratory viral identification varies with age and Aboriginality in metropolitan Western Australia. Pediatr Infect Dis J 2009; 28:598–603. [DOI] [PubMed] [Google Scholar]
- 35.Laurichesse H, Dedman D, Watson JM, et al. Epidemiological features of parainfluenza virus infections: laboratory surveillance in England and Wales. Eur J Epidemiol 1999; 15:475–484. [DOI] [PubMed] [Google Scholar]
- 36.Fé MM, Monteiro AJ, Moura FE. Parainfluenza virus infections in a tropical city: clinical and epidemiological aspects. Braz J Infect Dis 2008; 12:192–197. [DOI] [PubMed] [Google Scholar]
- 37.Mizuta K, Abiko C, Aoki Y, et al. Seasonal patterns of respiratory syncytial virus, influenza A virus, human metapneumovirus, and parainfluenza virus type 3 infections on the basis of virus isolation data between 2004 and 2011 in Yamagata, Japan. Jpn J Infect Dis 2013; 66:140–145. [DOI] [PubMed] [Google Scholar]
Associated Data
This section collects any data citations, data availability statements, or supplementary materials included in this article.