Abstract
Modeling molecular docking is critical to both understanding life processes and designing new drugs. In previous work we created the first published GPU-accelerated docking code (PIPER) which achieved a roughly 5× speed-up over a contemporaneous 4 core CPU. Advances in GPU architecture and in the CPU code, however, have since reduced this relalative performance by a factor of 10. In this paper we describe the upgrade of GPU PIPER. This required an entire rewrite, including algorithm changes and moving most remaining non-accelerated CPU code onto the GPU. The result is a 7× improvement in GPU performance and a 3.3× speedup over the CPU-only code. We find that this difference in time is almost entirely due to the difference in run times of the 3D FFT library functions on CPU (MKL) and GPU (cuFFT), respectively. The GPU code has been integrated into the ClusPro docking server which has over 4000 active users.
1. Introduction
It has now been almost ten years since the beginning of widespread use of GPGPU, facilitated through the generalization of GPU architecture and its support with high level programming languages such as CUDA. In that time GPUs have been applied to virtually every computationally intensive application. There have also been major advances in CPU and GPU architecture. At the same time, application “owners” have continued modifying their algorithms and otherwise updating their codes to both better serve their user base and to improve performance. In this paper we describe the upgrade of the PIPER molecular docking program from its original GPU implementation in 2009 (PIPER09, the first of its kind [16]) to its latest release in 2014 (PIPER14).
As we described in the initial report [16], a fundamental operation in biochemistry is the interaction of molecules through non-covalent bonding or docking (see Figure 1 generated using Pymol [12]). Modeling molecular docking is critical both to evaluating the effectiveness of pharmaceuticals, and to developing an understanding of life itself. Docking applications are computationally demanding. In drug design, millions of candidate molecules may need to be evaluated for each molecule of medical importance. As each evaluation can take many CPU-hours, huge processing capability must be applied. Docking codes have been accelerated with FPGAs [15, 18, 20, 21], Cell [14], and GPUs [13, 17, 19].
Figure 1. Visualization of two proteins docking.
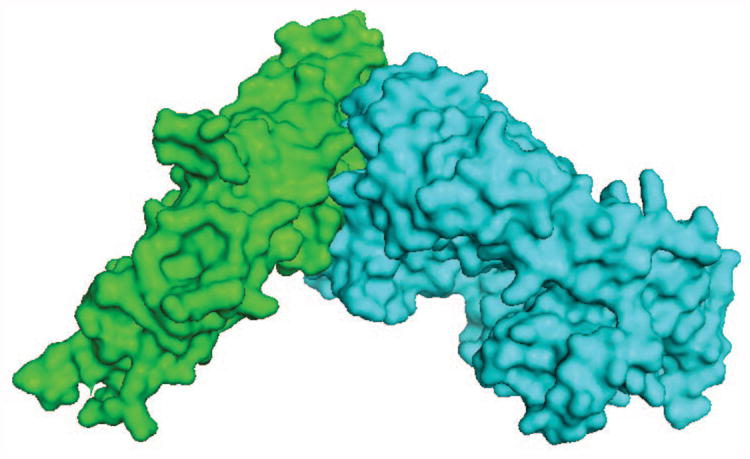
The basic computational task for docking is to find the relative offset and rotation (pose) between a pair of molecules that gives the strongest interaction (see Figure 2). Hierarchical methods are often used: an initial phase where candidate poses are determined (docking), and an evaluation phase where the quality of the highest scoring candidates is rigorously evaluated. PIPER minimizes the number of candidates needing detailed scoring with only modest added complexity [4].
Figure 2. Examples of protein poses.
Many docking applications including PIPER assume, at least initially, a rigid structure (see Figure 2). This still allows modeling of various force laws that govern the interaction between molecules, including geometric, electrostatic, atomic contact potential, and others. A standard technique maps the molecules' characteristics to three dimensional grids. The most energetically-favorable relative position is determined by summing the voxel-voxel interaction values for each modeled force at all positions to generate a score, and then repeating this for all possible translations and rotations. The computational cost is as follows: typical grid sizes are N = 1283 and the total number of angles is 10, 000; this yields 1010 relative positions to be evaluated for a single molecule pair. Complexity is reduced by having the outer loop consist of the rotations while the translations are handled with an FFT-based 3D correlation.
What we describe here is the upgrade of GPU PIPER09 in the face of new GPU processor and system architecture, changing application usage, and modifications to the “trunk” CPU-only code. We begin by finding that a naive mapping from 2009 to 2014 era GPUs actually leads to a slowdown in performance. To achieve expected performance it is necessary to rewrite the entire code except that which maps to vendor library functions. This includes modifying a GPU algorithm for one task and creating an entirely new one for another (necessary as that code is shifted from CPU to GPU). The end-product is a code where nearly all latency is hidden by cuFFT calls. The result is that GPU PIPER14 is 3.3× times faster than the CPU-only code with both running on contemporaneous recent technology. We find that this difference in time is almost entirely due to the difference in run times of the 3D FFT library functions on CPU (MKL) and GPU (cuFFT), respectively.
On the application side, the significance is as follows. Since the original implementation, PIPER has emerged as a high profile docking code, having consistently been the best performer in the CAPRI (Critical Assessment of Predicted Interactions) worldwide protein docking competition [8]. PIPER14 has been integrated into the ClusPro docking server [5], which has over 4000 active users. The upgrade described here has resulted in substantially improved turnaround times and overall throughput. On the engineering side, perhaps the most interesting result is that an application that maps well to both CPU and GPU, and that has highly tuned versions for each processor, should have a speedup substantially less than the ratio of peak capabilities (3.3× versus 23×).
2. PIPER CPU and GPU Baseline
2.1 PIPER Overview
PIPER's primary advance is the use of desolvation energies in the evaluation function, in addition to the previously used shape and electrostatics terms. The desolvation terms are generated as pairwise potential terms. The PIPER algorithm proposed that by using eigenvalue-eigenvector decomposition, the number of terms needed could be limited to the P largest eigenvalues, where 2 ≤ P ≤ 4, limiting the added number of Fourier transforms to 2 to 4 forward transforms and one reverse. When GPU PIPER09 was designed, it was under the assumption that up to 18 of these desolvation terms may still be used [16]. Since then, however, it has been found that in practice only 4 terms are typically ever used; this is a key to one of the optimizations in the current work.
In PIPER, there are typically 4 non-pairwise terms used for evaluation pertaining to shape and electrostatic behaviors, along with the pairwise desolvation terms [4]. For each rotation, the exhaustive search of 6D space is done using Fourier transforms for each of the pairwise and non-pairwise terms. The PIPER energy-like scoring function is computed to evaluate the goodness of fit between the molecules. This goodness of fit is expressed as the sum of P correlation functions for all possible translations α, β, γ of the rotated ligand relative to the receptor,
| (1) |
where Rp(i, j, k) and Lp(i + α, j + β, k + γ) are the components of the correlation function defined on the receptor and the ligand grids, respectively.
Thus for each rotation the ligand energy function is evaluated on the grid, and repeated FFT correlations are performed for each of the different energy functions. Filtering is performed by scoring each pose within a rotation and subsequently selecting the top scoring poses. A top scoring pose is a pose which minimizes total energy based on both the pairwise and non-pairwise energy terms. The total energy function is expressed as a weighted sum:
| (2) |
The weights are provided at runtime; multiple sets of coefficients can be provided so that PIPER returns the top scores for each set of coefficients. PIPER is capable of returning the top N scores for each pose and coefficient set.
2.2 PIPER Program Flow
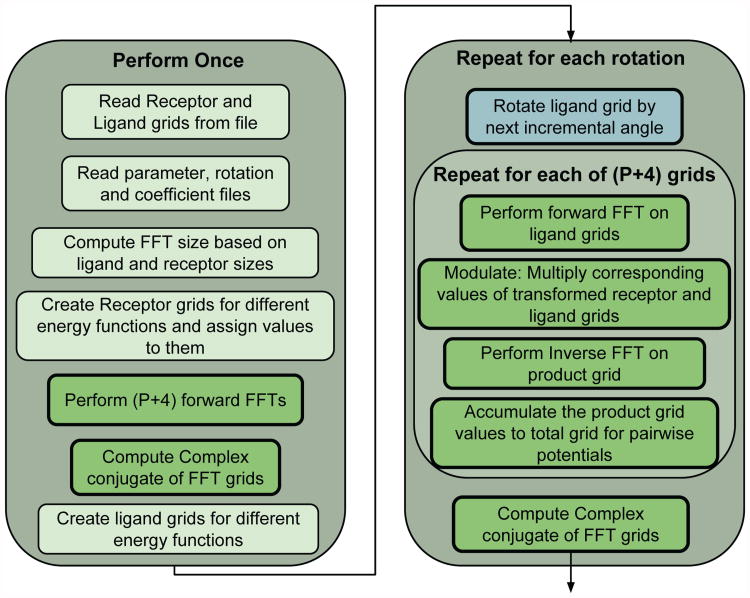
PIPER has initial stages that read in molecule information, compute the FFT size, create the receptor grids, compute the receptor FFT for all energy terms, and create the ligand grids. After this setup, PIPER performs the various rotations, and within each rotation, the following steps occur.
Rotation of the ligand grid
Assignment of the 3D energy grids for all terms
FFT correlation of the receptor and the ligand grids
Accumulation of the desolvation terms to obtain pairwise potential score
Weighted score computation of different energy functions
Scoring and filtering for the current rotation
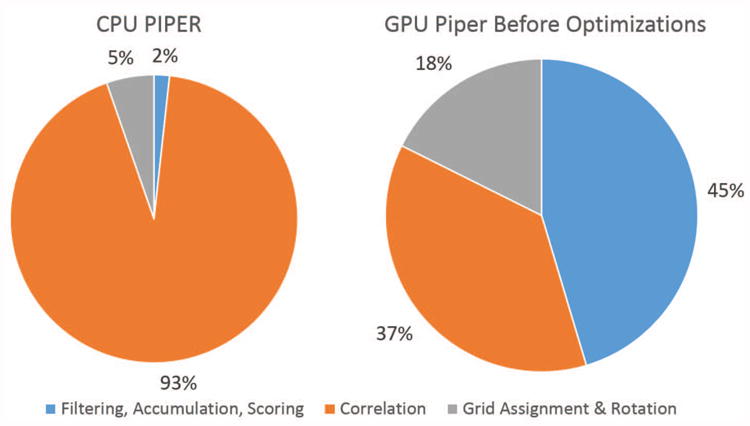
The work distribution for a single rotation in the CPU based version of PIPER, as is seen in the left panel of Figure 3, is dominated by correlation time.
Figure 3. CPU PIPER14 and GPU PIPER09 work distributions during a single rotation using contemporary computing platforms: an 8 core Intel Sandy Bridge CPU and an Nvidia K20c GPU.
2.3 GPU PIPER09
GPU PIPER09 follows an identical program flow as the CPU version. In Table 1 we show the timing results of the original CPU and GPU implementations of PIPER. One the CPU side we see that the correlations, mostly 3D FFTs, dominate. The primary optimization was therefore the migration of these computations to the GPU via the CUFFT library [10]. Following Amdahl's Law, the balance of the computation went from 11% of the cost to 42%. We therefore moved the accumulation, filter, and scoring steps to the GPU as well. This required substantial restructuring of that part of the code, which is described in [16]. We found that grid assignment was not worth moving to the GPU. There were several reasons: the marginal benefit was insufficient, the code is highly complex, and there was insufficient device memory.
Table 1. Original performance results for CPU and GPU PIPER09 implementations using 2008-era technology. CPU is a 4 core Intel Nehalem and the GPU is an Nvidia Tesla c1060.
| CPU 4 core | GPU | ||||
|---|---|---|---|---|---|
| time | percent | time | percent | speedup | |
| Grid assignment | 20ms | 2.0% | 20ms | 9.5% | 1× |
| Correlations | 900ms | 88.7% | 160ms | 75.8% | 5.6× |
| Acc., score, filter | 95ms | 9.4% | 31ms | 14.7% | 3.1× |
| Total | 1015ms | 100% | 211ms | 100% | 4.8× |
Figure 4 displays the program flow for the GPU version of PIPER with a few modifications relevant to the current work. All light green boxes are program segments which remain on the CPU, all dark green boxes are code segments that were moved to the GPU, and the light blue box is a code segment that was on the CPU in GPU PIPER09, but which is on the GPU in PIPER14.
Figure 4. The flow of the PIPER program. Light green boxes are on the CPU, dark green boxes are on the GPU, and light blue boxes are being moved to the GPU in the current work.
2.4 PIPER14 Baseline
In the last five years the CPU version of PIPER has advanced with many small algorithmic changes. Particularly significant for performance is moving the FFT computation from FFTW [1] to the Intel Math Kernel Library (MKL) [3]. We evaluated the latest PIPER (CPU PIPER14) and GPU PIPER09, both on contemporary computing platforms; the new work distributions are shown in Figure 3. Detailed results are presented in Section 4. We note:
The performance of GPU PIPER09, even running on a new GPU, is actually slower than CPU PIPER14 (see below).
Most significant is the difference in proportion of time spend on the correlation step. On the GPU, the proportion is actually even smaller than shown: the correlation time is completely hidden by the data transfer time.
Algorithmic and usage changes in PIPER have changed the proportion of the time spent on filtering. It has been reduced in the CPU version but increased in the GPU version.
These observations lead to the obvious conclusion that a successful GPU PIPER14 must address all non-correlation steps: filtering, grid assignment, and data transfer.
3. Optimizations
3.1 Filtering and Scoring Stage Optimizations
GPU PIPER09 uses a scoring and filtering kernel that finds the top scores for a rotation for all provided scoring coefficients at the same time. This method works the best when the maximum number of coefficient sets are provided at the same time, typically up to 8. In this case, the top score for each set of coefficients is calculated by a single SM. With 8 coefficient sets, 8 SMs are simultaneously occupied. Although this is only a fraction of the 30 SMs available on the Tesla c1060, the performance is substantially better that running this task on the CPU. As seen in Table 1, spending substantial effort improving this task was not warranted at the time.
Figure 3 shows, however, this is no longer the case. Besides changes in hardware and software libraries, PIPER use has also changed. Most docking runs now use only a single coefficient set, meaning only a single SM is used. Thus the goal of optimizing the GPU filtering kernel has changed from attempting to find the top score for all coefficient sets simultaneously, to quickly finding the top score for a single coefficient set and then repeating the process.
Filtering and scoring on the GPU now uses two kernels which are then repeated for every set of coefficients, as well as being repeated for the number of top scores desired by the user for each coefficient set. The two kernels partition the work into two stages so that the shared memory on the GPU is used for fast memory access, and so that work is distributed across all SMs.
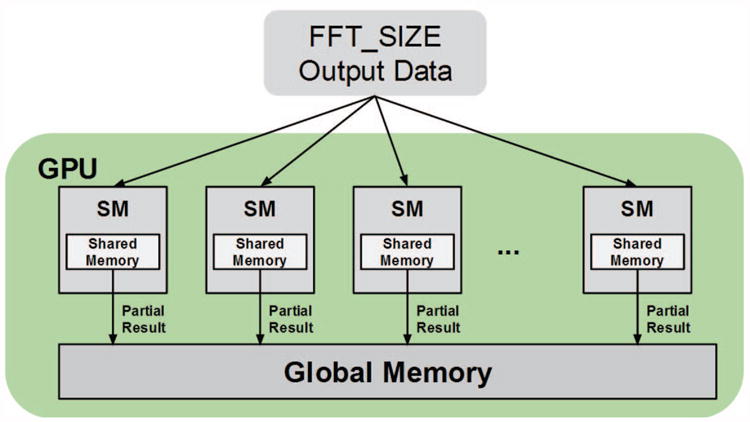
In the first kernel the output data, which is the size of the molecular grid volume, or equivalently the FFT size, is partitioned among all available SMs. This is done by launching the kernel with a sufficiently large number of blocks such that every SM has a suitable quantity of work. For reasons that will be explained later, the number of blocks must be a power of two. We found that a suitable number of blocks for the K20c was 32. For each block, each thread in the block accesses a subset of the output molecular grid data, calculates the score using the energy equations described in Section 2.1, finds the best score within the subset, and finally places this result in shared memory for the block. The subset accessed by the thread is not contiguous, but rather strided by the total number of threads launched on the GPU; this is done to properly coalesce the GPU memory transfers [9]. Once all threads in the block have found their partial best scores and written them to memory, they are synchronized. Then a single thread from each block finds the top score from the partial scores in shared memory, and writes this block partial score to global memory, letting the kernel finish. This first kernel uses shared memory optimally and so minimizes the time needed to find the best score out of the scores made available to this block. Figure 5 is a visualization of this work distribution across the SMs on a GPU.
Figure 5. Filtering Stage 1 kernel. Each SM may write multiple partial scores to global memory based on how many blocks were assigned to that SM.
The second kernel uses only a single block. The number of threads in this block is equal to the number of blocks used in stage 1. The reason for the power of two requirement from the prior stage lies in that, in this stage, a classic log step reduction of the partial scores in memory is used. At each step, the number of active threads is equal to half the number of partial scores remaining. Each thread compares two scores and writes the best to the lower half of memory. After every comparison, a synchronization is performed to ensure all threads are always operating on the same step and thus operating on the consistently updated memory. Eventually this results in a single top score. This best score is then marked in a separate array in global memory, indicating that it is a top score. The necessity for this arises in that PIPER may require multiple top scores per coefficient set, so previously chosen top scores must be marked so as to not be chosen again in later calls to the function. Along with marking the top score, positions in the molecular grid around this best score are also marked as being “top scores.” This ensures that when computing multiple top scores, the results are not all trapped in the same local minima for the molecular grid, a key feature in filtering and scoring for PIPER [4]. Figure 6 displays this second stage process.
Figure 6. Filtering Stage 2 kernel. A single SM performs the work of reducing the partial scores in global memory.

While this filtering stage no longer optimizes for all coefficient sets, we find that the GPU can be kept fully utilized regardless of how many coefficient sets are provided at runtime. This new version performs dramatically better than the original filtering and scoring kernel, and will be discussed in more detail in the following section.
3.2 GPU Idle Time Optimizations
The second major optimization is the elimination of the idle GPU time when the rotation and grid assignment steps are performed on the CPU. In the original version, CUDA streams were used in an attempt to overlap GPU work with grid assignment [16]. However, due to the result from filtering and scoring immediately being assigned to memory and moved around on the CPU, the GPU kernels were forced to execute filtering and synchronize before the CPU could prepare for the next rotation.
It follows that the grid data, since it was assigned on the CPU, must be copied to the GPU on each rotation. For the C2075 card, this data transfer is overlapped with the CUFFT calls for each grid and the data transfer latency are hidden. On the K20c, however, the data transfer is longer than the CUFFT execution time. This is due to a shortened FFT and modulation execution time as well as reduced bandwidth for the desired transfer size. In either case, the GPU core computations is now memory bound rather than compute bound. This is visible in the sample Nvidia Visual Profiler output shown in Figure 7: the top bar is the memory latency while the smaller boxes below are the kernels for the FFT and modulation stages of correlation.
Figure 7. NVProf output memory latency relative to correlation compute time on the K20c GPU. A longer bar indicates a longer execution time.

To solve both of these issues, we move all of the grid assignment arrays permanently to the GPU and perform grid assignment and ligand rotation directly on the GPU. There is then no need for transfers between the host system memory and GPU memory. For this to be feasible, the GPU must contain enough global memory for all of the input and output data. As discussed earlier, the number of energy grids used is P + 4, where P is the number of pairwise potential terms. In the original work it was assumed that up to 18 of these terms were used [16]. Since then, however, it has become known that for typical ClusPro Server operation, accurate results are obtained using only 4 pairwise terms. Thus it is only required that enough memory for 8 grid arrays is available across the entire docking analysis for the vast majority of docking cases.
With all ligand grids of suitable size fitting in GPU memory, the ligand grids are allocated on the GPU before any rotation steps. The functions for grid assignment for all energy terms, as well as the data for rotation and angle data, were also moved to the GPU.
For grid assignment, the functions are mapped as follows. Each grid assignment function iterates over all of the atoms in the protein and assigns values to the appropriate grid location based on a predetermined position and on state information for every type of energy and desolvation term. Thus, on the GPU, each atom is assigned to a single thread, and multiple blocks of threads are launched. However multiple atoms may affect the same element in the grid, and a race condition can occur if multiple threads attempt to update the same memory location. In order to alleviate this issue, we took advantage of a new feature introduced in the Fermi architecture: global memory floating point atomic operations [11]. Typically when using atomic operations on the GPU, it is with the understanding that serializing the operations will result in significant performance degradation. In the case of grid assignment, however, the number of threads which may interact with each other for each memory location is small.
4. Results
4.1 Target Hardware
For all PIPER GPU14 experiments, code was compiled using CUDA version 5.5 and g++ 4.4.7 and run on server nodes with Intel Xeon E5530 processors; each contained either a single Nvidia C2075 Fermi class card or a single Nvida K20c Kepler class card. For CPU runs, PIPER was compiled using gcc 4.4.7, OpenMPI version 1.6.4 and the Intel MKL FFT library version 11.1. CPU-only tests were run on server nodes with Intel Xeon E5-2680 Sandy Bridge CPUs. Details of the processors are in Table 2.
Table 2. Comparison of target hardware.
| Expermental Hardware | ||||||||
|---|---|---|---|---|---|---|---|---|
| Technology | Make | Model | Parallelism | Part# | Process | Frequency | Code | Release |
| CPU | Intel | Sandy Bridge | 8 Core | E5-2680 | 32 nm | 2.7 GHz | MPI+MKL | 2012/Q1 |
| GPU | Nvidia | Fermi | 448 SPs | Tesla C2075 | 40 nm | 1.15 GHz | CUDA | 2011/Q3 |
| GPU | Nvidia | Kepler | 2496 SPs | Tesla K20c | 28 nm | 0.73 GHz | CUDA | 2012/Q4 |
4.2 Test Cases, Validation
Protein complexes used during benchmarking were taken from the ZLab Protein Docking Benchmark [2]. Raw performance is related closely to complex size, but proportions and speedups change little. PIPER was configured to run with a single coefficient set and a single top score per run in order to isolate the improvements per program segment. PIPER molecular docking runs iterate over 70,000 rotations, and the results are an average over all of the rotations. We fully validated the results using methods standard in the molecular docking community, see [6] for details.
4.3 Optimization Results
Raw performance is shown in Table 3. The first thing to note is the change in performance of CPU PIPER between 2014 and 2009 (as shown in Table 1): the recent version is 9× faster. This is inspite of operating on larger complexes. Besides the difference in CPU, there are several reasons for this, among them: the new MKL FFT has nearly 3× the efficiency of the 2009 FFTW; also, scoring has been simplified. For the GPU, the Kepler version of PIPER09 is actually slower than that on the Tesla. This is largely due to three factors: the complexes are larger, we are running grid assignment on the CPU on only a single core, and the usage change makes the old filtering algorithm particularly inefficient. We also note that the Kepler version of PIPER09 is substantially slower than the updated CPU version. We believe this is an excellent example of how some optimizations are not scalable through generations of technology.
Table 3. Performance results for CPU and GPU PIPER implementations. Technologies are in Table 2. All times are in milliseconds.
| CPU 8 core | Kepler PIPER09 | Kepler PIPER14 | Fermi PIPER14 | ||||||||
|---|---|---|---|---|---|---|---|---|---|---|---|
| time | percent | time | percent | speedup | time | percent | speedup | time | percent | speedup | |
| Charge assignment | 6.3 | 1.7% | 42 | 17.6% | 0.15× | 1.2 | 3.4% | 5.2× | 1.4 | 2.5% | 4.5× |
| Correlations | 108.1 | 92.9% | 88 | 37.0% | 1.23× | 32.0 | 91.4% | 3.4× | 52.3 | 91.8% | 2.1× |
| Acc., score, filter | 2.0 | 5.3% | 108 | 45.4% | 0.02× | 1.0 | 2.9% | 2.0× | 1.0 | 1.8% | 2.0× |
| Miscellaneous | 0.0 | 0.0% | 0 | 0.0% | — - | 0.8 | 2.3% | — - | 2.3 | 4.0% | — - |
| Total per rotation | 116.4 | 100% | 238 | 100% | 0.49× | 35.0 | 100% | 3.3× | 57.0 | 100% | 2.0× |
Figure 8 shows graphically the results from two stages of optimization: filter only and all. Prior to optimization, GPU filtering took a large bulk of the computation. Once the new filtering kernels were introduced, their latency improved from 108 ms to only 1 ms, a multiple order of magnitude improvement. After applying the second optimization, leftover CPU code that is not hidden by the GPU-CPU overlap requires only 0.8 ms. Also, grid assignment and rotation, when done on the GPU, only require 1.2 ms. This is a 21× impovement over the original 42 ms required for grid assignment and rotation in the unoptimized version. An important observation is that when all the computations have been moved to the GPU, there is no longer a need for data transfer to overlap with CUFFT. Prior to the idle time optimizations, the GPU correlation time is actually the max of the memory transfer latency and the correlation time.
Figure 8. GPU runtime improvement with bar segments separating the different computations. Prior to the CPU idle time optimizations, the correlation time was actually hidden by the memory transfer time, as it was larger.
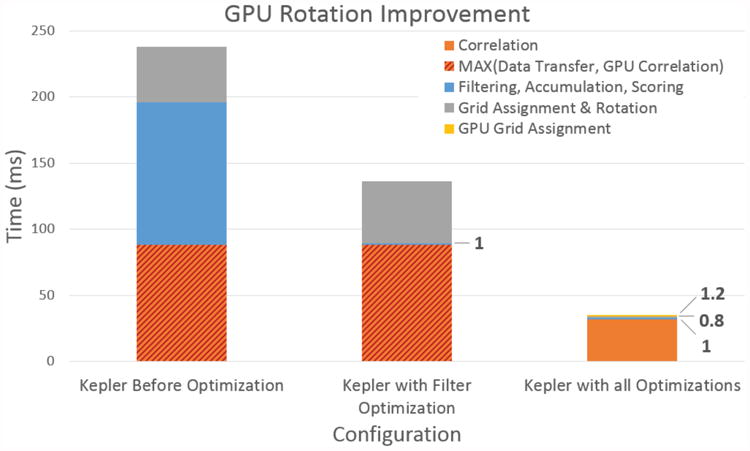
Figure 9 shows graphically the results in Table 3. It highlights the need to move the entire computation onto the GPU for the GPU version of PIPER14 to yield significant improvement.
Figure 9. Relative improvement for various configurations. The red bar is CPU PIPER, blue bars on Kepler HW, and the green bar is Fermi HW.
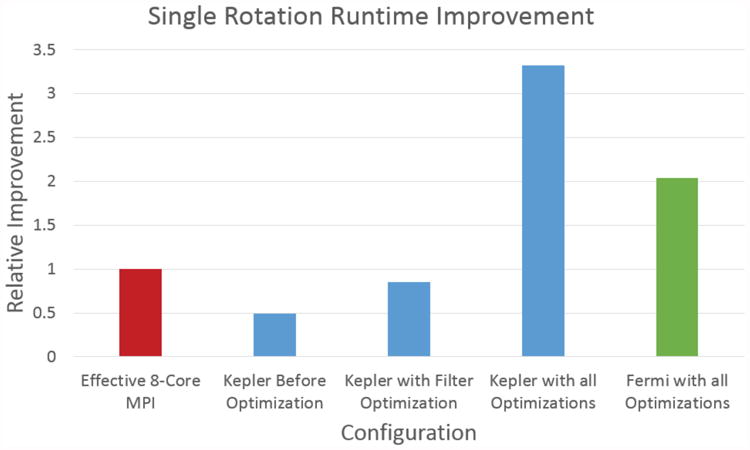
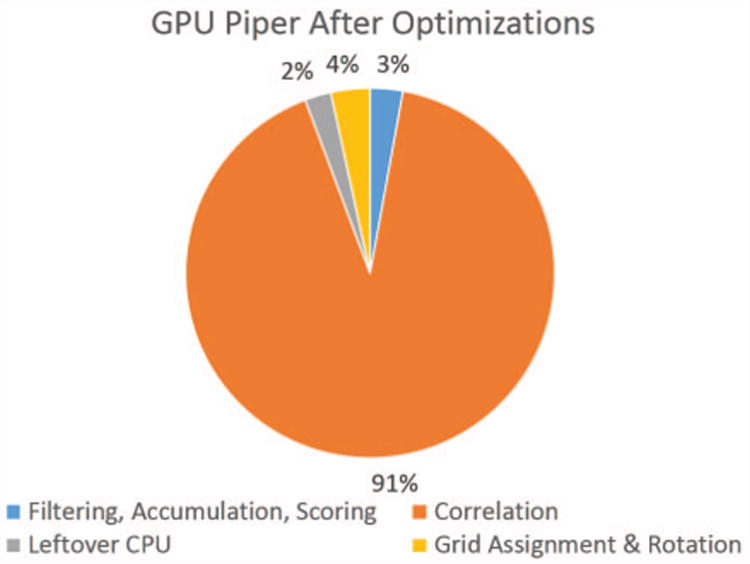
Figure 10 shows the profile of Kepler GPU PIPER14. We compare this with Figure 3 and note that the new proportions more closely resemble those of CPU rather than GPU PIPER09.
Figure 10. Portion of rotation step spent on various parts of the computation after optimizations.
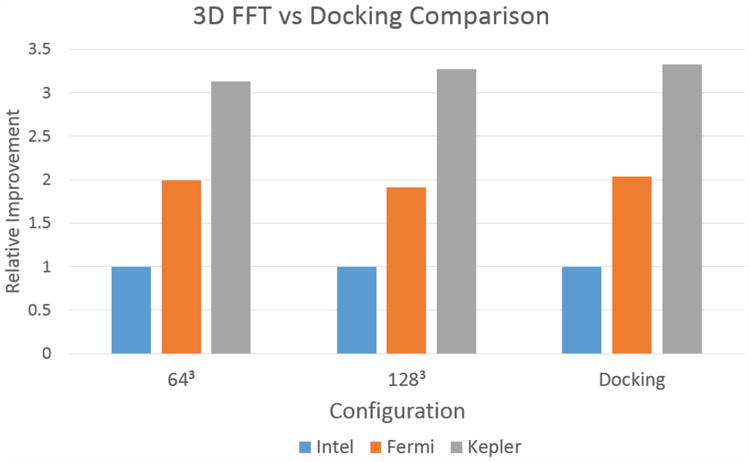
In particular, after all of the optimizations have been applied, the time complexity of the PIPER14 code for both CPU and GPU versions has been reduced to that of computing 3D FFTs. Since these are available through highly optimized vendor specific library functions, future performance improvements appear to be tied to improvements in the Nvidia CUFFT and Intel MKL libraries, respectively. Figure 11 illustrates this observation by comparing normalized CUFFT, MKL FFT, and PIPER14 run times on the same hardware. For both of the FFT sizes shown, the improvements demonstrated by the GPUs are 2× and 3.3× respectively, the same as for GPU PIPER14.
Figure 11. Comparison of the runtime for 3D FFTs with varying dimensions to that of PIPER docking for Intel, Fermi, and Kepler configurations.
5. Conclusion
In this paper we describe steps taken to maintain a high profile application through generations of processor and application changes. The starting point was finding that in five years “entropy” had reduced the original 5× speedup to a 2× slowdown. The updated version required changes in algorithm, and most significantly, that the entire computation be moved onto the GPU. Since this residual CPU code was complex (the reason we had not ported it originally) this required significantly more effort to implement than the original GPU code. The end result is a code that runs, chip versus chip, 3.3× faster on a GPU-accelerated node than on a CPU-only node. Since this is a throughput application, these results scale easily. GPU PIPER14 has been integrated into the ClusPro server where its performance makes it the version of choice for the user base.
We note that both CPU and GPU versions of PIPER14 are highly optimized with nearly all the visible (non-hidden) run time due to 3D FFTs. Since these are computed with highly tuned vendor libraries for both CPU and GPU we have reached the limit on performance improvement given the current application structure.
An interesting observation is the differences in computational efficiency (fraction achieved of peak single precision floating point capacity) of the 3D FFT between generations of CPUs and GPUs and between CPUs and GPUs of the current generation (see Table 4). These numbers were generated using the same testbeds as described earlier. We note that the range of differences in utilization, 2× to 7×, roughly match results published elsewhere [7].
Table 4. Fraction of peak single precision FLOPS achieved for 3D FFTs. Technology details same as in Table 2.
| Processor | Model | Year | Library | Utilization |
|---|---|---|---|---|
| CPU | Nehalem | 2009 | FFTW | 5.1% |
| GPU | Tesla | 2009 | cuFFT | 2.6% |
| CPU | Sandy Bridge | 2014 | MKL | 53.9% |
| GPU | Fermi | 2014 | cuFFT | 17.0% |
| GPU | Kepler | 2014 | cuFFT | 7.6% |
We are currently updating energy minimization, another modeling tool for predicting molecular interaction that is also part of the ClusPro server.
Footnotes
This work was supported in part by the NIH through award #R41-GM101907-01A1 and by the NSF through award #CNS-1205593. Web: www.bu.edu/caadlab. Email: {soptnrs|herbordt}@bu.edu.
References
- 1.FFTW. FFT Benchmark Results. [accessed 1/18/2014];2014 http://www.fftw.org/benchfft.
- 2.Hwang H, Vreven T, Janin J, Weng Z. Protein-protein docking benchmark version 4.0. Proteins. 2010 Nov;78(15):3111–3114. doi: 10.1002/prot.22830. [DOI] [PMC free article] [PubMed] [Google Scholar]
- 3.Intel. [Accessed: 2014-4-4];Intel Math Kernel Library. http://software.intel.com/en-us/intel-mkl.
- 4.Kozakov D, Brenke R, Comeau S, Vajda S. PIPER: an FFT-based protein docking program with pairwise potentials. Proteins: Structure, Function, and Genetics. 2006;65:392–406. doi: 10.1002/prot.21117. [DOI] [PubMed] [Google Scholar]
- 5.Kozakov D, Hall D, Beglov D, Brenke R, Comeau S, Shen Y, Li K, Zheng J, Vakili P, Paschalidis I, Vajda S. Achieving reliability and high accuracy in automated protein docking: ClusPro, PIPER, SDU, and stability analysis in CAPRI rounds 13-19. Proteins: Structure, Function, and Genetics. 2010 doi: 10.1002/prot.22835. [DOI] [PMC free article] [PubMed] [Google Scholar]
- 6.Landaverde R. Master's thesis. Department of Electrical and Computer Engineering; Boston University: 2014. GPU Optimizations for a Production Molecular Docking Code. [DOI] [PMC free article] [PubMed] [Google Scholar]
- 7.Lee VW, et al. Dubunking the 100× GPU vs. CPU myth: An evaluation of throughput computing on CPU and GPU. Proc Int Symp on Computer Architecture. 2010 [Google Scholar]
- 8.Lensink M, Wodak S. Docking, scoring, and affinity prediction in CAPRI. Proteins: Structure, Function, and Bioinformatics. 2013;81(12):2082–2095. doi: 10.1002/prot.24428. [DOI] [PubMed] [Google Scholar]
- 9.Nvidia. [Accessed: 2014-3-31];Cuda c programming guide. docs.nvidia.com/cuda/cuda-c-programming-guide/
- 10.Nvidia. [Accessed: 2014-3-31];Cufft user guide. http://docs.nvidia.com/cuda/cufft/index.html.
- 11.Nvidia. [Accessed: 2014-3-31];Nvidia fermi compute architecture whitepaper. 2009 www.nvidia.com/content/PDF/fermi$\_$white$\_$papers/
- 12.Pymol. 2008 http://pymol.sourceforge.net.
- 13.Ritchie D, V V. Ultra-fast FFT protein docking on graphics processors. Bioinformatics. 2010;26(19):2398–2405. doi: 10.1093/bioinformatics/btq444. [DOI] [PubMed] [Google Scholar]
- 14.Servat H, Gonzalez-Alvarez C, Aguilar X, Cabrera-Benitez D, Jimenez-Gonzalez D. Drug design issues on the Cell BE. Proc 3rd Int Conf on High Performance and Embedded Architectures and Compilers. 2008:176–190. [Google Scholar]
- 15.Sukhwani B, Herbordt M. Acceleration of a Production Rigid Molecule Docking Code. Proc IEEE Conf on Field Programmable Logic and Applications. 2008:341–346. [Google Scholar]
- 16.Sukhwani B, Herbordt M. GPU acceleration of a production molecular docking code. Proc General Purpose Computation Using GPUs. 2009 [Google Scholar]
- 17.Sukhwani B, Herbordt M. Fast Binding Site Mapping using GPUs and CUDA. Proc High Performance Computational Biology. 2010 [Google Scholar]
- 18.Sukhwani B, Herbordt M. FPGA Acceleration of Rigid Molecule Docking Codes. IET Computers and Digital Techniques. 2010;4(3):184–195. doi: 10.1049/iet-cdt.2009.0013. [DOI] [PMC free article] [PubMed] [Google Scholar]
- 19.Sukhwani B, Herbordt M. Increasing Parallelism and Reducing Thread Contentions in Mapping Localized N-body Simulations to GPUs. In: Kindratenko V, editor. Numerical Computations with GPUs. Springer Verlag; 2014. [Google Scholar]
- 20.VanCourt T, Gu Y, Herbordt M. FPGA acceleration of rigid molecule interactions (preliminary version) Proc IEEE Symp on Field Programmable Custom Computing Machines. 2004 [Google Scholar]
- 21.VanCourt T, Herbordt M. Rigid molecule docking: FPGA reconfiguration for alternative force laws. Journal on Applied Signal Processing v2006. 2006:1–10. [Google Scholar]


