Abstract
We have constructed and characterized a time-of-flight Positron Emission Tomography (TOF PET) camera called the Tachyon. The Tachyon is a single-ring Lutetium Oxyorthosilicate (LSO) based camera designed to obtain significantly better timing resolution than the ~ 550 ps found in present commercial TOF cameras, in order to quantify the benefit of improved TOF resolution for clinically relevant tasks. The Tachyon’s detector module is optimized for timing by coupling the 6.15 × 25 mm2 side of 6.15 × 6.15 × 25 mm3 LSO scintillator crystals onto a 1-inch diameter Hamamatsu R-9800 PMT with a super-bialkali photocathode. We characterized the camera according to the NEMA NU 2-2012 standard, measuring the energy resolution, timing resolution, spatial resolution, noise equivalent count rates and sensitivity. The Tachyon achieved a coincidence timing resolution of 314 ps +/− ps FWHM over all crystal-crystal combinations. Experiments were performed with the NEMA body phantom to assess the imaging performance improvement over non-TOF PET. The results show that at a matched contrast, incorporating 314 ps TOF reduces the standard deviation of the contrast by a factor of about 2.3.
Index Terms: Signal-to-noise ratio, time-of-flight, timing resolution
I. Introduction
Clinical pet usage is growing rapidly due to its ability to accurately diagnose and stage metastatic disease, which in turn reduces cost and improves the quality of life. Since accurate diagnosis depends on the signal-to-noise ratio (SNR) in the reconstructed image [1]–[3], improvement in the SNR in PET could have a large impact on national health care. Therefore, improving the SNR in PET images, especially if it is done without increasing patient dose or imaging time, is very worthwhile. Time-of-flight (TOF) PET can obtain these benefits. The SNR in PET is dominated by counting statistics (i.e., PET is starved for events), but incorporating the additional TOF information into the reconstruction increases the statistical quality of the acquired data. The increased statistical efficiency gained with TOF information can be used to decrease acquisition time, decrease injected dose, or improve image quality.
Enabled by the development of Lutetium Oxyorthosilicate (LSO), Philips introduced the first commercial TOF PET camera (the Gemini-TF) in 2006, which achieved 585 ps coincidence timing resolution [4]. Since then, both Siemens (Biograph mCT TOF) and GE (Discovery 690) have introduced Lutetium-based TOF PET cameras that achieve 528 and 559 ps FWHM timing resolution, respectively [5], [6]. The fact that these three manufacturers achieve nearly identical timing resolution is not a coincidence but a direct result of the similarities between their detector module designs. While the details are given in [7], timing resolution in block detector modules are primarily degraded due to the detector geometry, which causes path length variations among the optical photons as they propagate from the interaction point to the photodetector.
The scintillator crystals in standard PET cameras are long and thin (e.g., 6 × 6 × 22 mm3) and are coupled to the photomultiplier tube on the small end (e.g., a 6 × 6 mm2 face). This implies that the optical photons must travel a longer path (and so are subject to greater path length variations) than if the same scintillator crystal were coupled to a large face (6 × 22 mm2). During the design of the Tachyon system, Moses et al. [7], [8] found that such an LSO crystal coupled to a large face achieved a much better timing resolution (309 ps) than that coupled to a small face (543 ps).
The other effect that degrades timing resolution is the light sharing scheme that is used in block detectors to decode the crystals. This also introduces path length variations for the optical photons as they travel from the interaction point to the photodetector(s), causing timing variations in the light propagation. Thus, the fact that all three manufacturers use block detectors comprised of LSO scintillator crystals with similar dimensions leads to an average timing resolution of about 550 ps.
There have been attempts to improve TOF resolution beyond this range. One method is to use a scintillator with higher light output or shorter decay time. Few such scintillators exist (especially ones with appropriate PET qualities), but LaBr3 doped with 5% cerium [9] has two times higher light output and two times shorter decay time than LSO. This gives it exquisite timing properties, and Daube-Witherspoon et al. [10] (University of Pennsylvania) built a TOF PET camera with 4 × 4 × 30 mm3 crystals of LaBr3 in an 84 cm diameter, 25 cm axial extent ring. Their prototype detectors achieve 310–350 ps FWHM coincidence timing resolution (depending on the position) [11], [12]. The results from their camera show significant noise reduction, even though the measured timing for the camera is 375 ps FWHM [10]. This design promises excellent imaging performance [13], [14], although LaBr3 has lower efficiency and spatial resolution than LSO and it is hygroscopic.
In contrast, the approach used in this study was to improve the geometrical factors that degrade timing resolution by eliminating the block decoding and coupling to the large side of the LSO crystal. Based on this approach, the single-ring LSO-based Tachyon “demonstration” camera was built to achieve a timing resolution better than 550 ps.
In this paper, we report on our calibration of the Tachyon system–the time delay correction and time-to-digital converter (TDC) nonlinearity correction. We also describe our camera characterization in terms of energy resolution, timing resolution, spatial resolution, noise equivalent count rates and sensitivity using methods specified in the NEMA NU 2-2012 standard [15]. As NEMA NU 2-2012 does not specify methods particularly appropriate for evaluating image quality of TOF PET scanners, we also used a NEMA body phantom to demonstrate the imaging performance improvement afforded by improved system timing resolution.
II. Materials and Methods
A. System Description
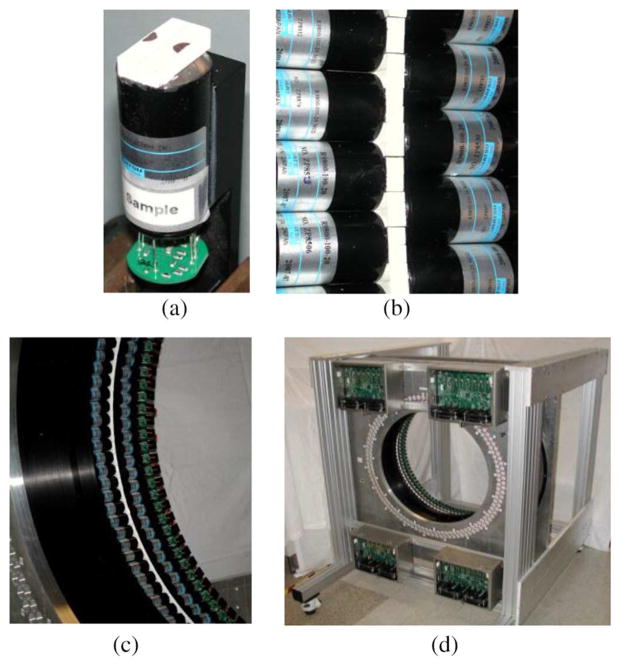
Our Tachyon camera is based on a TOF detector module (Fig. 1(a)) that consists of two 6.15 × 6.15 × 25 mm3 LSO scintillator crystals and a high-performance 25 mm diameter PMT (Hamamatsu R9800 with super-bialkali photocathode). On each crystal, the side opposite the PMT has a 6 mm diameter semicircular hole in the reflector. This module is used to construct a continuous, closely packed, single-ring PET camera as shown in Fig. 1. Details about the detector module and how to decode the individual scintillator crystals are reported in [8].
Fig. 1.
Pictures of the Tachyon Camera. (a) A single detector module, with two LSO crystals per PMT and a hole in the top reflector on each crystal. (b) Close-up of the crystal ring. The white region is the crystals covered with white spray paint reflector. The PMTs are on either side axially to couple with the large faces of the crystals. The small faces of the crystals point to the center of the ring. (c) About 20% of the detector ring. (d) Entire camera, also showing the four assemblies of the readout electronics. In order to see the detectors, neither the patient bed, the lead shielding, nor the light covers are installed.
As shown in Fig. 1, the camera ring has a 78.9 cm diameter and consists of 384 individual scintillator crystals placed with 6.75 mm between crystal centers. The axial extent is only one crystal width, which is 6.15 mm. The lead shielding has an adjustable gap, ranging from 6.15 mm to 15 cm. With the minimal gap, nearly background-free data (i.e., trues with almost no scatter or randoms) are collected. The wide gap yields the same shielding geometry as septaless cameras, so the scatter and randoms fractions are similar to that for 3-D PET. The camera includes an orbiting positron source for attenuation correction and calibration. “Rod windowing” [16] and the septa minimize scattered events and TOF information is used to reject random events [17], [18].
We have modified the Siemens/CTI Cardinal electronics, adding a more accurate timing chain (a constant fraction discriminator or CFD designed by LBNL [19] and the CERN High Performance Time to Digital Converter chip or HPTDC [20]) so that it achieves a system timing resolution of 79 ps FWHM with digital input signals. The system electronics consists of four assemblies of the readout electronics (shown in Fig. 1(d)), a coincidence processor (not shown in the figure), and a host PC. Each electronic assembly has 48 analog readout channels and serves one quarter of the detector modules. The 48 analog readout channels in each electronic assembly are divided into two groups. The field-programmable gate arrays (FPGA) in the electronic assemblies calculate the single event energies, decode the crystal locations and record the event timings in real time. The events with energies that fall within given windows, which are preset by the host PC software for each individual crystal, are sent to the coincidence processor. The coincidence processor detects valid coincidence events between all 8 groups of detector modules and sends list mode data to the host PC through an optical fiber cable.
B. System Calibration and Characterization
1) Energy Resolution
The energy resolution of the system was characterized using an orbiting 22Na point source. The spacing of the lead shields, which is not essential in this experiment, was set to about 10 mm. Using the limited light sharing method [8], we were able to decode all 384 scintillator crystals and measure their energy resolutions. We did not measure the decoding error for each crystal in this study.
2) HPTDC Nonlinearity Correction
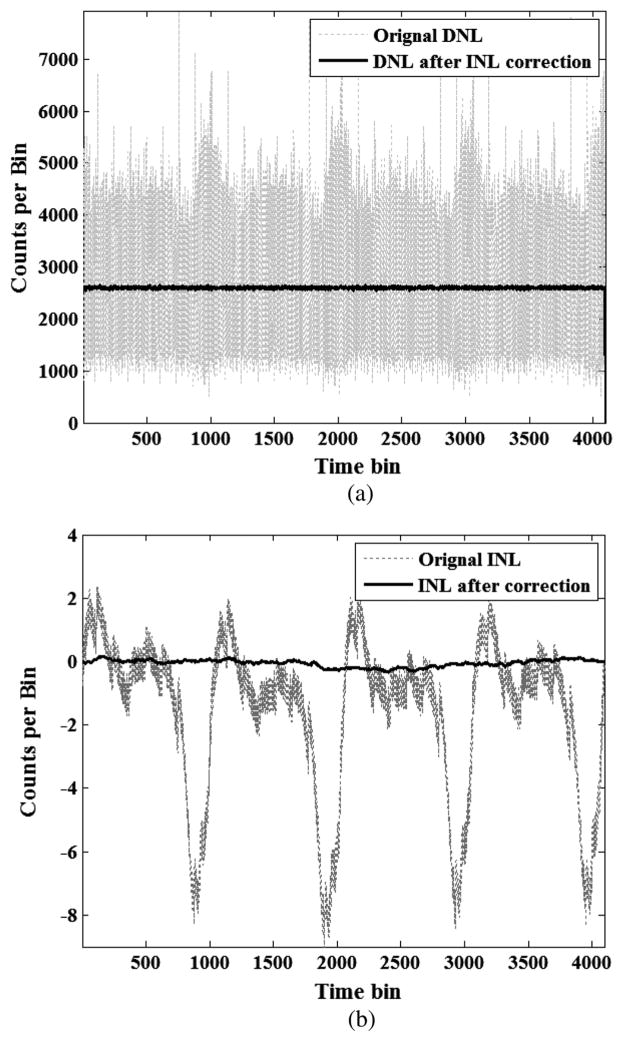
The HPTDC has some known issues in the power supply and substrate coupling that cause 40 MHz cross talk from the logic part to the time measurement part of the chip. Thus, there is a fixed pattern in the Integral Nonlinearity (INL) plot in the very high resolution mode [21]. The nonlinearity in HPTDCs was corrected to improve the timing resolution of the system.
To correct the INL of all 24 HPTDCs in our system, single event list mode data with timing information was collected using a 22Na point source placed at the center of the ring. The spacing of the lead shields was set to about 10 mm. No energy window was applied during data acquisition. About 12M single events with an event rate of 3.5 kcps were collected for each TDC channel.
The histograms of the time stamps of all the events were plotted to investigate the Differential Nonlinearity (DNL) of the TDCs. Ideally, all the time bins in a TDC channel should be uniform and the histogram of the time stamps (DNL plot) should be flat. However, time bins were not perfectly uniform because of the known issues in HPTDCs. Thus, the DNL plots were not perfectly flat. The INL plots derived by integrating the DNL plots were not perfectly flat either.
The HPTDC nonlinearity was corrected by adjusting the widths of the time bins according to the count numbers in each bin [22]. Both DNL plots and INL plots were expected to be flat after the nonlinearity correction.
3) Time Delay Correction
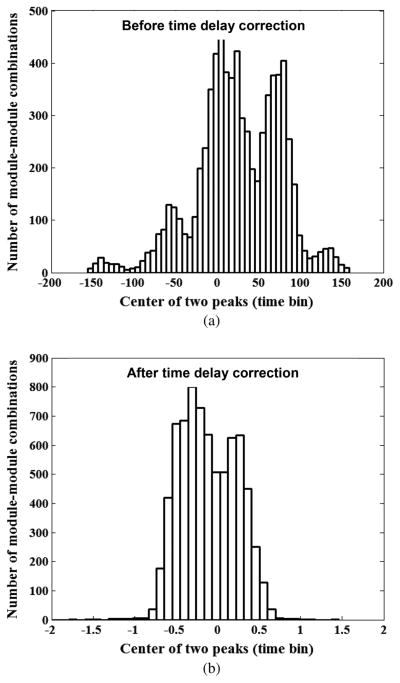
Because of the differences in PMT transit times, cable lengths and electronic delays, we needed to correct for the fixed module-to-module differences in time delay. We used an orbiting 22Na point source to identify and correct the time delay differences between all 192 detector modules. The spacing of the lead shields was set to 6.15 mm. List mode data with coincidence timing information were collected while the source was orbiting. The energy windows were set to about 1.5 times the FWHM of the photopeaks. About 80,000 coincidence events per valid module-module combination were collected.
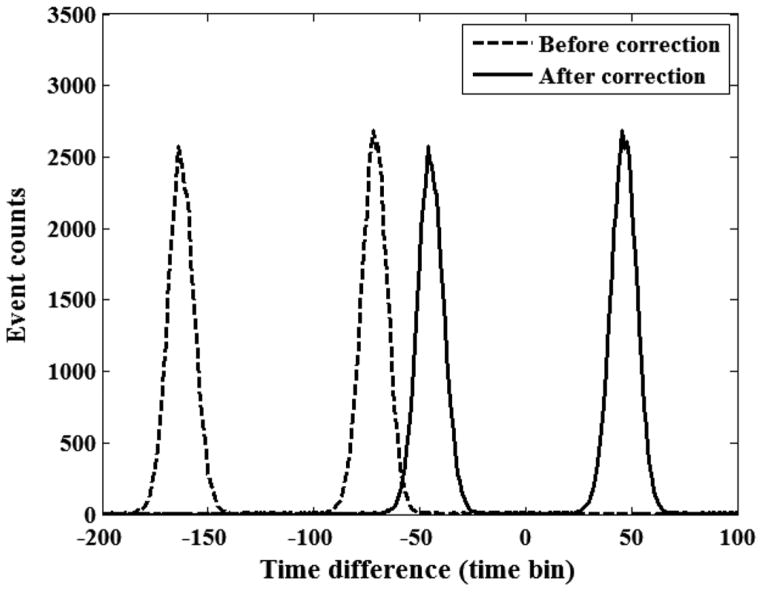
As shown in Fig. 2, the time difference spectrum of a valid module-module combination had two separate peaks corresponding to the two positions in which the source orbit intersects the lines of response (LOR). When the time delays were properly corrected, these two peaks were centered on zero time difference.
Fig. 2.
Representative spectrum of a valid module-module combination. The time delay correction moved the center of the two peaks to the zero position. The width of the time bin is 25 ps.
Using the time delay of module 0 as a reference, the centers of the two peaks (Ci,j) in combinations between module i and module j were specified as:
| (1) |
where d0 ~ d191 are the time delays of the 192 modules; ([0 … 1 … −1 … 0]) is a row vector with 191 elements; elements i and j are 1 and −1 respectively; and the remaining elements are all zero.
A simple Least Squares Estimation (LSE) method was then applied to estimate {di–d0, i = 1, …, 191} from the measured peak centers {Ci,j}.
4) Coincidence Timing Resolution
The coincidence timing resolution was calculated using the same data collected for the time delay correction (see Section II-d). Every valid module-module combination had two Gaussian peaks in its time difference spectrum (shown in Fig. 2). The FWHMs of the two peaks were averaged to calculate the coincidence timing resolution for each combination.
5) Spatial Resolution
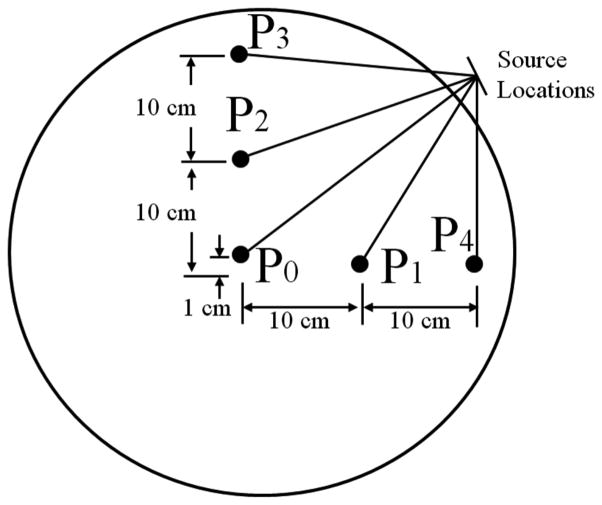
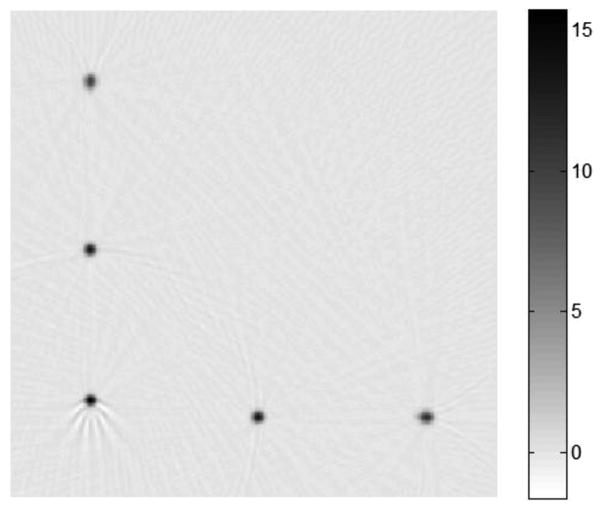
A NEMA NU 2-2012 resolution phantom with a geometry shown in Fig. 3 was built to measure the spatial resolution of the scanner. 319 μCi of 18F solution was injected into the phantom for the experiment. The spacing of the lead shields was set to 6.15 mm. The energy windows were set to about 1.5 times the FWHM of the photopeaks. The image was reconstructed using filtered back projection algorithm with no smoothing or apodization. Reconstructed pixel size was 1 mm. The radial and tangential resolutions (FWHM and FWTM) for a radius of 1 cm, 10 cm and 20 cm were calculated using the method specified in NEMA NU 2-2012.
Fig. 3.
The schematic drawing of the custom-built NEMA NU 2-2012 resolution phantom used in the spatial resolution measurement. The point sources each consisted of a small quantity of concentrated activity inside a capillary with an inside diameter of 1 mm and an outside diameter of 2 mm.
6) Noise Equivalent Count Rates (NECR)
A NEMA NU 2-2012 NECR phantom was used to measure the NECR of the scanner [23]. The phantom was a solid cylinder (203 mm in diameter, 700 mm in length) composed of polyethylene with a specific gravity of 0.96. A 6.4 mm hole was drilled parallel to the central axis of the cylinder at a radial distance of 54 mm. 42.72 mCi of 11C solution was injected into a plastic tube placed in the hole of the phantom in this experiment. The spacing of the lead shields was set to 6.15 mm, the minimal gap for nearly background-free data. The energy windows were set to about 1.5 times the FWHM of the photopeaks. The coincidence time window was set to 3 ns.
7) Sensitivity
A NEMA NU 2-2012 sensitivity phantom was used to measure the sensitivity of the scanner. The phantom consisted of a plastic tube (length: 1000 mm, inner diameter: 0.76 mm, outer diameter: 1.6 mm) and 5 aluminum outer tubes (length: 700 mm, wall thickness: 0.5 mm). The inner diameter of the 5 tubes were 3.9 mm, 7.0 mm, 10.2 mm, 13.4 mm and 16.6 mm, respectively. The phantom was suspended in the center of the transaxial FOV with a supporting mechanism external to the FOV. 431 μCi of 18F solution was injected into the plastic tube in the experiment. 300 seconds of coincidence data were collected with one, two, three, four and five aluminum tubes added to the plastic tube, respectively. The spacing of the lead shields was set to 6.15 mm. The energy windows were set to about 1.5 times the FWHM of the photopeaks. The coincidence time window was set to 100 ns.
The experiment was repeated at a 10 cm radial offset from the center of the transaxial FOV with 900 seconds of coincidence data collected for each measurement associated with each of the five aluminum tubes. The intrinsic random rate of the scanner was measured from the random coincidence data collected without a source in the scanner.
C. Imaging Performance
1) Experimental Settings
We used a NEMA body phantom to evaluate the gain in imaging performance using the TOF information. The NEMA phantom consists of a body phantom (volume of empty phantom: 9.7 liters), a central sphere (inner diameter: 22 mm) and six spheres with various sizes (inner diameter: 10 mm, 13 mm, 17 mm, 22 mm, 28 mm, and 37 mm). In the experiments, the body phantom, the central sphere and four of the spheres (10 mm, 13 mm, 17 mm, 22 mm spheres) were filled with FDG solution with 3 mCi total activity. The activity concentration in the spheres was 4 times higher than in the body phantom. The 28 mm and 37 mm spheres were filled with water with no activity.
In NEMA NU 2-2012, the imaging time is set to simulate a 30 minutes total body scan with 100 cm total axial imaging distance. That is not suitable for the single-ring Tachyon system with a 6.15 mm axial FOV. According to NEMA NU 2-2012, the imaging time would be 11 seconds so we would not acquire enough events to assess the imaging performance of the system. Thus, we increased the initial concentration of the background activity in the phantom from 0.14 μCi/cc, suggested by NEMA NU 2-2012, to 0.3 μCi/cc. The spacing of the lead shields was set to 6.15 mm. The energy windows were set to about 1.5 times the FWHM of the photopeaks. The coincidence time window was set to 3 ns. We scanned the phantom for 6 hours and acquired 3.87 million coincidence events.
2) Image Reconstruction
The 6 hours of list-mode data were divided into 16 independent, identically distributed datasets with an average of 242k events per dataset. Images were reconstructed for the 16 datasets and for the entire 6-hour data, with and without TOF information.
An iterative regularized maximum likelihood method with a preconditioned conjugate gradient was used for image reconstruction [24]. The system matrix was developed using a theoretical model of event detection based on multiple ray tracing between pairs of detectors [25] coupled with a Gaussian TOF kernel truncated at three standard deviations. All reconstructions were carried out with a sufficient number of iterations to result in convergence using a regularizing quadratic penalty based on nearest neighbor differences. It was observed that significant changes did not occur after 50 iterations. The time delay correction, TDC nonlinearity correction, detector efficiency normalization, and attenuation correction were incorporated into the system matrix. Scatter was not modeled or compensated for in this single-layer system. Randoms were minimal because of the relatively low data rates. Normalization and attenuation were accomplished using long acquisitions with a rotating source [16] so that smoothing was not necessary. The reconstructed pixel size was 3.37 mm × 3.37 mm.
3) Image Analysis
The percent contrast and percent background variability of the six spheres in all images were calculated using the methods described in NEMA NU 2-2012 [15].
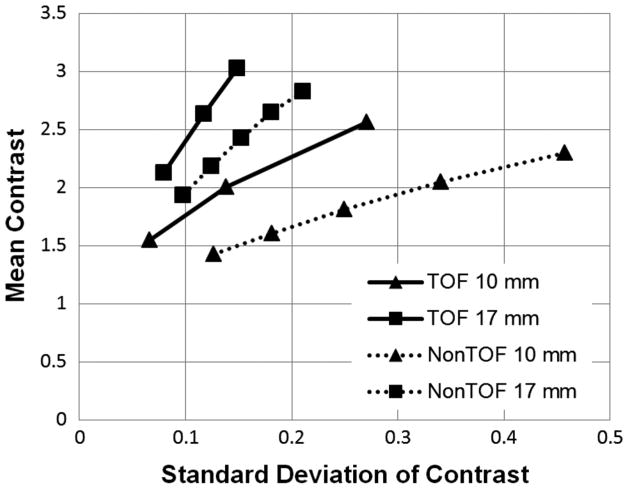
As NEMA NU 2-2012 does not specify methods particularly appropriate for evaluating image quality of TOF PET scanners, we used the following image analysis method to assess the TOF benefits. In the images reconstructed from the 16 datasets, four regions of interest were drawn for the four hot spheres and a background region away from the hot and cold spheres was drawn for contrast calculation. The contrast of each sphere was evaluated as the ratio between the mean activity within each hot sphere and the mean activity in the background region. The standard deviation of the contrast was calculated for each hot sphere from the 16 identically distributed realizations. The mean contrast versus the standard deviation curve was used to assess the TOF benefit.
III. Results
A. System Calibration and Characterization
1) Energy Resolution
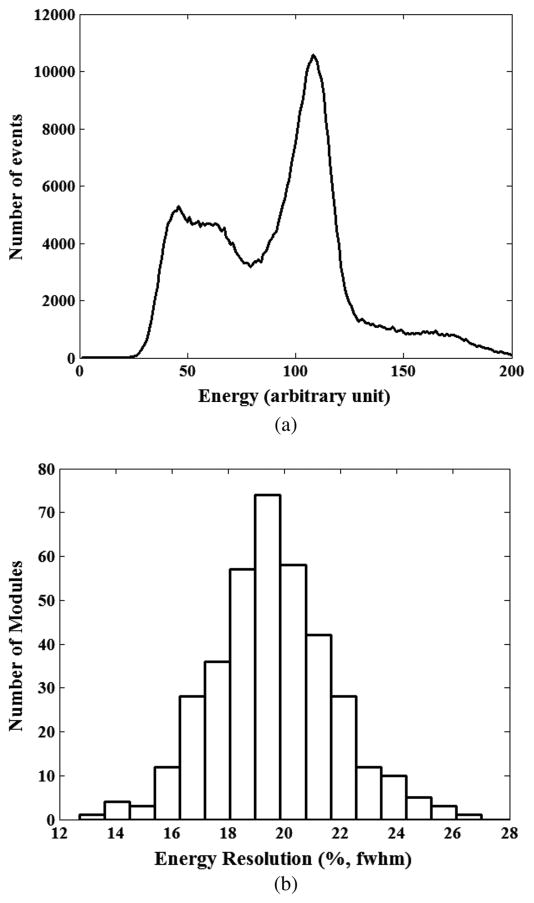
The average energy resolution of the system was 19.6% ± 2.3% (mean ± SD). Fig. 4(a) shows the pulse height spectrum of a representative scintillator crystal with 19% energy resolution, which was calculated using singles event data. Fig. 4(b) shows the distribution of the energy resolution of all 384 crystals in the camera.
Fig. 4.
Pulse height spectrum of a representative scintillator crystal, showing 19% FWHM energy resolution. (b) Distribution of the energy resolution of all 384 crystals in the camera.
2) HPTDC Nonlinearity Correction
Fig. 5 shows the representative DNL and INL curves, before and after calibration. The residual INL errors after the correction ranged from −8.5 ps to 4.5 ps, which was much less than one time bin (25 ps).
Fig. 5.
Representative (a) DNL and (b) INL curves. The dotted and solid curves are the DNL and INL curves before and after applying INL correction, respectively. The solid curves show that the residual DNL and INL errors are very small after the INL correction. The width of the time bin is 25 ps. Note that we used floating point numbers in the INL correction, so the residual INL errors were less than 1 bit (25 ps).
3) Time Delay Correction
Fig. 6 shows the results of the time delay correction. After the correction, the residual time delay errors were sufficiently small: −25 ps to 25 ps or in the least significant bit of the measurement, with a few outliers.
Fig. 6.
Spectra of the center positions of the two peaks (a) before and (b) after the time delay correction. The width of the time bin is 25 ps. Before the time delay correction, the center positions of the two peaks in all valid module-module combinations ranged from about −150 to 150 time bins. (b) After the time delay correction, the center positions range from −1 to 1 time bins with a few outliers. Note that we used floating point numbers in the time delay correction, so most of the residual time delay errors were less than 1 bit (25 ps).
4) Coincidence Timing Resolution
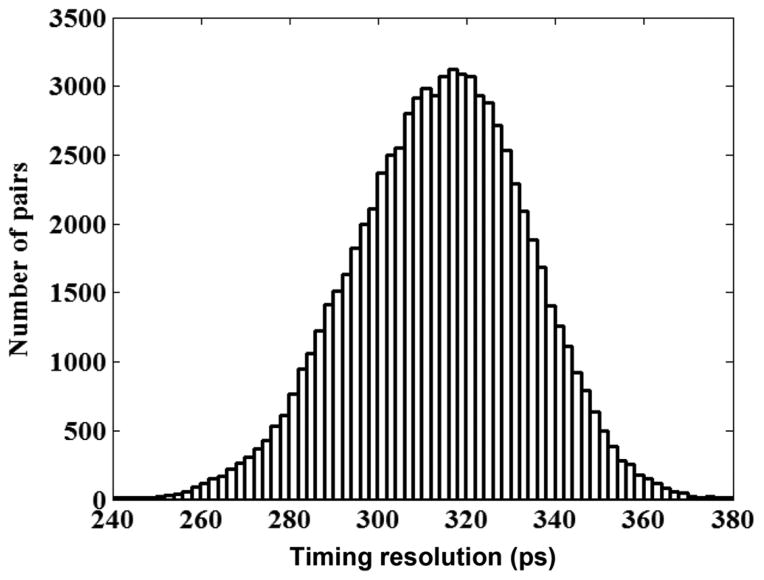
Using the data collected for the time delay correction, we also calculated the coincidence timing resolution of the system (defined as the average of the FWHM of each crystal-crystal combination) to be 314 ps ±20 ps FWHM. Fig. 7 shows the distribution of the timing resolution for each LOR in the system.
Fig. 7.
The distribution of the timing resolution of the coincidence pairs of the entire ring. The width of each bar in this plot is 2 ps.
5) Spatial Resolution
Fig. 8 shows the reconstructed image of the NEMA spatial resolution phantom. Table I reports the radial and tangential resolutions calculated using the method specified in NEMA NU 2-2012, reported as FWHM and FWTM. The spatial resolutions were as expected for a system using 6.15 × 6.15 × 25 mm3 scintillator crystals.
Fig. 8.
The reconstructed image of the NEMA spatial resolution phantom.
TABLE I.
Radial and Tangential Resolutions for Each Radius (1, 10 and 20 cm)
| Radius (cm) | Radial resolution (mm) | Tangential resolution (mm) | ||
|---|---|---|---|---|
| FWHM | FWTM | FWHM | FWTM | |
| 1 cm | 5.1 | 9.9 | 5.0 | 9.8 |
| 10 cm | 5.9 | 10.2 | 5.9 | 10.1 |
| 20 cm | 7.6 | 13.3 | 5.7 | 11.2 |
6) Noise Equivalent Count Rates (NECR)
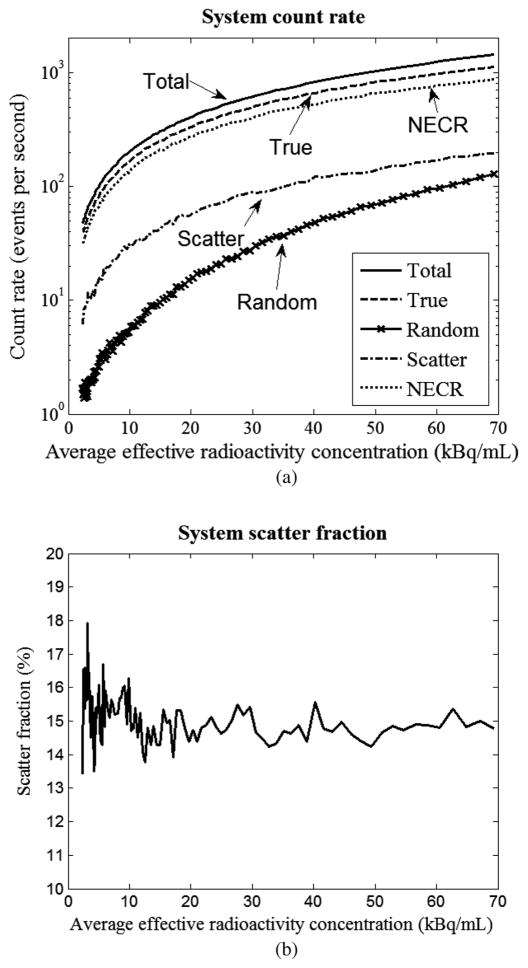
Fig. 9(a) and 9(b) show the count rates and scatter fractions of the system, respectively. Because of the small number of scintillator crystals in the system and in each module, no effects of dead time or saturation were observed. We measured a maximum NECR of 900 cps, which was obtained at 70 kBq/mL, the maximum radiotracer we were allowed to inject into the phantom. Thus, our measured maximum NECR was not limited by the Tachyon scanner.
Fig. 9.
(a) The count rates and (b) scatter fractions of the system. In (a), the total count rate, the true count rate, the random count rate, the scatter count rate and NECR are presented by the solid curve, the dashed curve, the solid curve with cross markers, the dash-dot curve and the dotted curve, respectively.
7) Sensitivity
We measured a system sensitivity of 9.22 × 10⁻³ counts/sec/kBq in the center of the transaxial FOV, and 8.74 × 10⁻³ counts/sec/kBq at 10 cm offset from the center. The intrinsic randoms rate was 77.5 cps. The sensitivity was as expected for a single-ring system with 6.15 mm of axial FOV.
B. Imaging Performance
1) Visual Image Quality Improvement
Fig. 10(a) and 10(b) show two sample images reconstructed from one of the 16 datasets with and without the TOF information at a matched contrast level for the smallest sphere (contrast = 2.0). The improvement provided by TOF is clearly visible. The smallest hot sphere is poorly visualized in the non-TOF image, with more than 30 different hot spots in the background having higher intensity than the maximum pixel in the smallest hot sphere. In comparison, the smallest sphere is visible in the TOF image, and none of the background pixels have higher intensity than its maximum pixel. Fig. 10(c) and 10(d) show the images reconstructed from the entire 6 hours of data with and without the TOF information. The improvement provided by TOF also is clearly visible in Fig. 10(c) and 10(d). Fig. 10(d) has much less background noise than Fig. 10(c).
Fig. 10.

Visual image quality improvement due to TOF. (a) A typical non-TOF image. and (b) a typical TOF image reconstructed from one of the 16 datasets. (c) The non-TOF image. and (d) the TOF image reconstructed from the entire 6 hours of data.
2) Percent Contrast and Percent Background Variability
Table II shows the percent contrast and percent background variability of each sphere in the reconstructed images averaged over the 16 datasets. Table III shows the results of the image reconstructed from the entire 6 hours of data. All the spheres in TOF images have higher percent contrasts and lower background variability than their counterparts in the non-TOF images.
TABLE II.
Percent Contrast and Percent Background Variability (Averages of 16 Datasets ± Standard Deviation)
| Sphere diameter (mm) | 10 | 13 | 17 | 22 | 28 | 37 | |
|---|---|---|---|---|---|---|---|
| Contrast (%) | Non-TOF | 24.1±8.9 | 38.9±7.7 | 47.9±5.8 | 53.7±3.7 | 65.3±8.0 | 73.5±3.3 |
| TOF | 24.6±3.9 | 39.1±5.2 | 48.3±3.8 | 56.2±2.4 | 70.0±3.4 | 76.6±4.3 | |
| Background Variability (%) | Non-TOF | 21.0±4.4 | 17.0±3.3 | 13.0±2.7 | 9.8±2.4 | 7.0±1.8 | 5.0±1.2 |
| TOF | 11.7±2.0 | 9.5±1.6 | 7.4±1.4 | 5.5±1.3 | 4.1±0.9 | 3.0±0.7 | |
TABLE III.
Percent Contrast and Percent Background Variability (The Entire 6 Hours of Data)
| Sphere diameter (mm) | 10 | 13 | 17 | 22 | 28 | 37 | |
|---|---|---|---|---|---|---|---|
| Contrast (%) | Non-TOF | 24.2 | 39.0 | 47.9 | 53.7 | 67.1 | 74.1 |
| TOF | 24.5 | 40.0 | 48.2 | 56.1 | 70.3 | 79.3 | |
| Background Variability (%) | Non-TOF | 6.4 | 6.1 | 5.4 | 4.5 | 3.1 | 2.5 |
| TOF | 3.6 | 3.4 | 2.8 | 2.3 | 1.9 | 1.7 | |
3) Mean Contrast Versus Standard Deviation
Fig. 11 plots the mean contrast versus standard deviation of the contrast curves of the smallest (D = 10 mm) and third smallest (D = 17 mm) spheres for the TOF and non-TOF reconstructions. Different points on each curve were obtained by varying the strength of the quadratic penalty function. For all hot spheres, we observed a substantial reduction in standard deviation of the contrast by using the TOF information. At a matched contrast level (contrast = 2.0) for the smallest sphere, the reduction in standard deviation is about a factor of 2.3, which is equivalent to a 5.4 times increase in sensitivity.
Fig. 11.
Comparison of the mean contrast versus standard deviation of the contrast curves between TOF and non-TOF reconstructions. TOF results are shown by solid lines, while non-TOF results are shown by dashed lines. Square symbols denote the 17-mm sphere and triangle symbols denote the 10–mm sphere.
IV. Discussion
The main purpose of the Tachyon camera is to provide future PET camera developers with accurate information on the performance gain that they can expect from improved time-of-flight based on a timing resolution on the order of 300 ps FWHM. The Tachyon achieved a 314 ps FWHM timing resolution, which is slightly worse than our expected value of 300 ps [8]. However, it is nearly a factor of 2 better than commercial TOF PET cameras and slightly better than the LaBr3 camera built by the University of Pennsylvania. The coincidence timing resolution of the LORs of the entire system had a large variability from 240 ps to 380 ps, which is probably caused by variations in the PMTs. The previous study showed that the R9800 PMTs have a fairly large timing resolution variability from 180 ps to 290 ps [23].
The Tachyon’s system energy resolution was 19.6%, which is not as good as that of conventional LSO based PET systems. That is probably caused by the light sharing window used for scintillator crystal decoding. The energy resolutions of the 384 individual crystals had a fairly large variability from 13% to 27%. This is most likely caused by non-uniform sensitivities across the PMT surface [26]. The materials used in the detector construction, such as the optical coupling grease and the white spray paint reflector [8], may have also contributed to the large variability.
The Tachyon was built to assess the performance improvement afforded by time-of-flight. TOF information reduces the statistical noise in the reconstructed image, but it doesn’t improve the spatial resolution. Thus, we built the Tachyon using 6.15 mm × 6.15 mm crystals, instead of using smaller ones. The Tachyon’s spatial resolution was not as good as those in some commercial systems with 4 mm × 4 mm or smaller crystals. But it was consistent with predictions and serves the purpose of assessing TOF-related performance improvements.
The Tachyon is a single-ring TOF PET with a very small axial FOV (6.15 mm). The sensitivity of the Tachyon system is 2 orders of magnitude lower than commercial PET scanners with a ~20 cm axial FOV. It is impractical to extend Tachyon to a scanner with a 15–25 cm (or longer) axial FOV. Firstly, the Tachyon uses a limited light sharing method that needs one PMT for every two discrete crystals. The conventional block detectors, commonly used in many commercial scanners, use four PMTs to read out 144 or more discrete crystals. Thus, the Tachyon’s limited light sharing method is very costly. Secondly, as shown in Fig. 1(b) and 1(c), the PMTs are mounted perpendicularly to the crystal ring in the Tachyon. Thus, it is not feasible to directly extend the Tachyon design to construct a system with multiple rings. One way to circumvent this roadblock is to use the SiPM-based multilayer detector module proposed in [8]. Nevertheless, the Tachyon serves the purpose of assessing TOF-related performance improvements.
The NEMA body phantom experiment demonstrated improved image quality due to TOF: a factor of 2.3 noise reduction in the NEMA phantom, which is close to the previous simulation result (3.0 SNR improvement for a TOF PET system with 300 ps coincidence timing resolution) [27]. However, the exact magnitude of the improvement depends on the object size and activity distribution, as well as the relative amount of true, scatter, and random events. Thus, direct comparison between the results of different experiments is difficult. In the near future, we will combine Monte Carlo simulation, measurements with phantoms and measurements with human subjects to quantify the performance improvement afforded by time-of-flight as a function of the coincidence timing resolution. This quantification will not only include measurement of noise variability, but also performance on the tasks of tumor localization and regional quantitation.
V. Conclusions
The Tachyon–a single-ring LSO-based scanner designed to quantify the benefit of TOF for clinically relevant tasks–has been constructed, calibrated and characterized. The Tachyon achieved 314 ps ±20 ps FWHM coincidence timing resolution. Phantom experiments were performed to assess the Tachyon’s imaging performance. The NEMA body phantom experiment showed that incorporating 314 ps TOF information improved image the signal-to-noise ratio by a factor of 2.3, and the improvement is clearly visible in the images. The excellent coincidence timing resolution of the Tachyon system allows us to proceed with further phantom and human studies to better understand and characterize the benefit of TOF for clinically relevant tasks.
Acknowledgments
This work was supported in part by the Director, Office of Science, Office of Biological and Environmental Research, Biological Systems Science Division, U.S. Department of Energy under contract DE-AC02-05CH11231, and in part by the National Institutes of Health, National Institute of Biomedical Imaging and Bioengineering, under Grants R01EB006085 and R21EB007081. Q. Peng and W. W. Moses designed and tested the detector module, the front-end electronics and the system electronics, assembled the system, performed the experiments to characterize its performance and analyzed the data.
Footnotes
W.-S. Choong and C. Vu contributed in the front-end electronics design. M. Janecek contributed in the detector module design. D. Wilson contributed in the mechanical gantry design. J. S. Huber contributed in the NEMA experiments. R. H. Huesman, J. Qi, and J. Zhou reconstructed the images and evaluated the resulting advantage realized from the addition of TOF information.
Color versions of one or more of the figures in this paper are available online at http://ieeexplore.ieee.org.
Contributor Information
Q. Peng, Email: qpeng@lbl.gov, Structural Biology and Imaging Department, Lawrence Berkeley National Laboratory, Berkeley, CA 94720 USA.
W.-S. Choong, Structural Biology and Imaging Department, Lawrence Berkeley National Laboratory, Berkeley, CA 94720 USA.
C. Vu, Structural Biology and Imaging Department, Lawrence Berkeley National Laboratory, Berkeley, CA 94720 USA
J. S. Huber, Structural Biology and Imaging Department, Lawrence Berkeley National Laboratory, Berkeley, CA 94720 USA.
M. Janecek, Structural Biology and Imaging Department, Lawrence Berkeley National Laboratory, Berkeley, CA 94720 USA.
D. Wilson, Structural Biology and Imaging Department, Lawrence Berkeley National Laboratory, Berkeley, CA 94720 USA
R. H. Huesman, Structural Biology and Imaging Department, Lawrence Berkeley National Laboratory, Berkeley, CA 94720 USA.
Jinyi Qi, Department of Biomedical Engineering, University of California, Davis, Davis, CA 95616 USA.
Jian Zhou, Department of Biomedical Engineering, University of California, Davis, Davis, CA 95616 USA.
W. W. Moses, Structural Biology and Imaging Department, Lawrence Berkeley National Laboratory, Berkeley, CA 94720 USA.
References
- 1.Swets JA, Picket RM. Evaluation of Diagnostic Systems. New York, NY, USA: Academic; 1992. [Google Scholar]
- 2.Metz CE. Basic principles of ROC analysis. Sem Nucl Med. 1978;4:283–298. doi: 10.1016/s0001-2998(78)80014-2. [DOI] [PubMed] [Google Scholar]
- 3.Metz CE. ROC methodology in radiologic imaging. Invest Radiol. 1986;21:720–733. doi: 10.1097/00004424-198609000-00009. [DOI] [PubMed] [Google Scholar]
- 4.Surti S, Kuhn A, Werner ME, Perkins AE, Kolthammer JA, Karp JS. Performance of Philips Gemini TF PET/CT scanner with special consideration for its time-of-flight imaging capabilities. J Nucl Med. 2007;48:471–480. [PubMed] [Google Scholar]
- 5.Jakoby BW, Bercier Y, Conti M, Casey ME, Bendriem B, Townsend DW. Physical and clinical performance of the mCT time-of-flight PET/CT scanner. Phys Med Biol. 2011;56:2375–2389. doi: 10.1088/0031-9155/56/8/004. [DOI] [PubMed] [Google Scholar]
- 6.Bettinardi V, Presotto L, Rapisarda E, Picchio M, Gianolli L, Gilardi MC. Physical performance of the new hybrid PETCT Discovery-690. Med Phys. 2011 Oct;38:5394–411. doi: 10.1118/1.3635220. [DOI] [PubMed] [Google Scholar]
- 7.Moses WW, Ullisch M. Factors influencing timing resolution in a commercial LSO PET camera. IEEE Trans Nucl Sci. 2006 Feb;53(1):78–85. [Google Scholar]
- 8.Janecek M, Moses WW. Simulating scintillator light collection using measured optical reflectance. IEEE Trans Nucl Sci. 2010 Jun;57(3):964–970. [Google Scholar]
- 9.van Loef EVD, Dorenbos P, van Eijk CWE, Kramer K, Gudel HU. High-energy-resolution scintillator: Ce3+ activated LaBr3. Appl Phys Lett. 2001;79:1573–1575. [Google Scholar]
- 10.Daube-Witherspoon ME, Surti S, Perkins A, Kyba CCM, Wiener R, Werner ME, et al. The imaging performance of a -based PET scanner. Phys Med Biol. 2010;55:45–64. doi: 10.1088/0031-9155/55/1/004. [DOI] [PMC free article] [PubMed] [Google Scholar]
- 11.Kuhn A, Surti S, Karp JS, Muehllehner G, Newcomer FM, VanBerg R. Performance assessment of pixellated LaBr3 detector modules for TOF PET. IEEE Trans Nucl Sci. 2006 Jun;53(3):1090–1095. [Google Scholar]
- 12.Kuhn A, Surti S, Karp JS, Raby PS, Shah KS, Perkins AE, et al. Design of a lanthanum bromide detector for time-of-flight PET. IEEE Trans Nucl Sci. 2004 Oct;51(5):2550–2557. [Google Scholar]
- 13.Surti S, Karp JS, Muehllehner G. Image quality assessment of LaBr3-based whole-body 3D PET scanners: A Monte Carlo evaluation. Phys Med Biol. 2004;19:4593–4610. doi: 10.1088/0031-9155/49/19/010. [DOI] [PubMed] [Google Scholar]
- 14.Surti S, Karp JS, Popescu LM, Daube-Witherspoon ME, Werner M. Investigation of time-of-flight benefit for fully 3-D PET. IEEE Trans Med Imag. 2006;25:529–538. doi: 10.1109/TMI.2006.871419. [DOI] [PubMed] [Google Scholar]
- 15.N. E. M. Association. NEMA Standards Publication NU 2-2012: Performance Measurements of Positron Emission Tomographs. National Electrical Manufacturers Association; Rosslyn, VA, USA: 2012. [Google Scholar]
- 16.Huesman RH, Derenzo SE, Cahoon JL, Geyer AB, Moses WW, Uber DC, et al. Orbiting transmission source for positron tomography. IEEE Trans Nucl Sci. 1988 Feb;NS-35(1):735–739. [Google Scholar]
- 17.Yamamoto M, Ficke DC, Ter-Pogossian MM. Effect of the software coincidence timing window in time-of-flight assisted positron emission tomography. IEEE Trans Nucl Sci. 1983 Feb;NS-30(pt. 1):711–714. [Google Scholar]
- 18.Moses WW. Time of flight in PET revisited. IEEE Trans Nucl Sci. 2003 Oct;50(5):1325–1330. [Google Scholar]
- 19.Turko BT. A precision timing discriminator for high density detector systems. IEEE Trans Nucl Sci. 1992 Oct;39(5):1311–1315. [Google Scholar]
- 20.Mota M, Christiansen J, Debieux S, Ryjov V, Moreira P, Marchioro A. A flexible multi-channel high-resolution time-to-digital converter ASIC. Proc. IEEE Nuclear Science Symp. and Medical Imaging Conf; Lyon, France. 2000. pp. 9/155–9/159. [Google Scholar]
- 21.Christiansen J. High performance time to digital converter [Online] Available: https://www.oka.ihep.ru/Members/semenovv/iii/hptdc_manual_ver2-2.pdf.
- 22.Liu SB, Feng CQ, Yan H, An Q. LUT-based non-linearity compensation for BES III TOF’s time measurement. Nucl Sci Technol. 2010 Feb;21:49–53. [Google Scholar]
- 23.Strother SC, Casey ME, Hoffman EJ. Measuring PET scanner sensitivity - relating countrates to image signal-to-noise ratios using noise equivalent counts. IEEE Trans Nucl Sci. 1990 Apr;37(2):783–788. [Google Scholar]
- 24.Qi JY, Leahy RM, Hsu CH, Farquhar TH, Cherry SR. Fully 3D Bayesian image reconstruction for the ECAT EXACT HR + IEEE Trans Nucl Sci. 1998 Jun;45(3):1096–1103. [Google Scholar]
- 25.Huesman RH, Klein GJ, Moses WW, Qi J, Reutter BW, Virador PR. List-mode maximum-likelihood reconstruction applied to positron emission mammography (PEM) with irregular sampling. IEEE Trans Med Imag. 2000 May;19:532–7. doi: 10.1109/42.870263. [DOI] [PubMed] [Google Scholar]
- 26.Peng QY, Choong WS, Moses WW. Evaluation of the timing properties of a high quantum efficiency photomultiplier tube. IEEE Trans Nucl Sci. 2013 Oct;60(5):3212–3219. doi: 10.1109/TNS.2013.2281176. [DOI] [PMC free article] [PubMed] [Google Scholar]
- 27.Conti M. Focus on time-of-flight PET: The benefits of improved time resolution. Eur J Nucl Med Mol Imag. 2011 Jun;38:1147–1157. doi: 10.1007/s00259-010-1711-y. [DOI] [PubMed] [Google Scholar]


