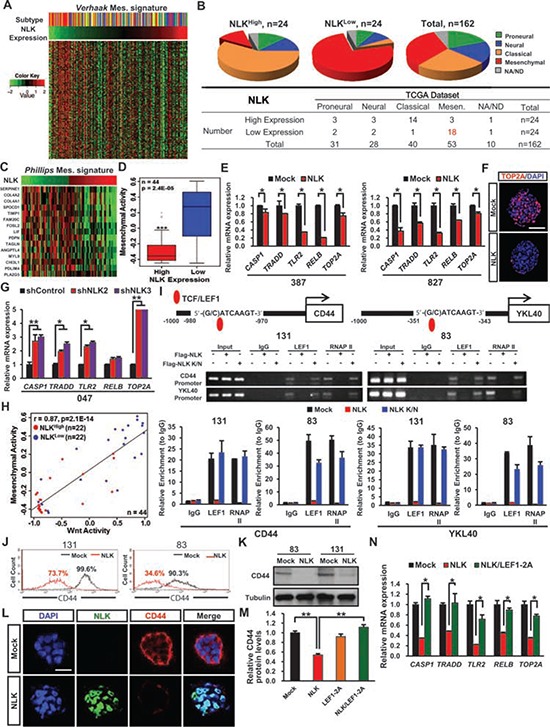
Figure 4. NLK influences on mesenchymal and Wnt activities.

A. Heatmap representation of Verhaak mesenchymal-associated gene signature profiles from the TCGA GBM RNA-seq samples according to NLK expression level. (n = 162). B. Pie-chart representation of Proneural, Neural, Classical, and Mesenchymal subtypes in TCGA GBM samples in correspondence with NLKhigh and NLKlow groups. C. Heatmap representation of Phillips Mesenchyaml-associated gene signature profiles. D. Rembrandt microarray data analysis for Mesenchymal activity in high NLK expressing GBM patients vs. low NLK expressing GBM patients. E. Real-time RT-PCR analysis to determine the mRNA expression levels of Mesenchymal associated genes (CASP1, TRADD, TLR2, RELB, and TOP2A). F. Representative confocal microcopy images of immunofluorescence (IF) staining of TOP2A in spheroids. Scale bar, 100 μm G. Real-time RT-PCR analysis of Mesenchymal associated genes. H. Co-expression of Mesenchymal and Wnt activities in high and low NLK expressing groups. (r = 0.87, p = 2.1 × 10⁻¹⁴, Pearson correlation test). I. Chromatin immunoprecipitation (ChIP) analysis of LEF1 on CD44 and YKL40 promoters. J. Flow cytometric analysis of CD44. Gates were drawn based on isotype negative-control staining (not shown). K. Immunoblots of CD44 in mock and NLK-WT GBM Cells. L. Representative confocal images of immunofluorescence (IF) staining of NLK and CD44 in spheroids. Scale bar, 50 μm. M. Relative CD44 protein levels derived from quantification of immunoblot analysis using ImageJ. N. Real-time RT-PCR analysis of Mesenchymal associated genes.
