

Abstract
Objective:
To evaluate the association between physical activity (PA) and multiple sclerosis (MS) disease activity, depression, and fatigue in a cohort of children with MS and monophasic acquired demyelinating syndrome (mono-ADS).
Methods:
In this cross-sectional study of consecutive patients attending a specialized pediatric MS clinic, we administered the PedsQL Multidimensional Fatigue Scale, Center for Epidemiological Studies Depression Scale, and Godin Leisure-Time Exercise Questionnaire. Quantitative MRI analysis was performed to obtain whole brain and T2 lesion volume in a subset of participants (n = 60).
Results:
A total of 110 patients (79 mono-ADS; 31 MS; 5–18 years; M:F 1:1.2) were included. Patients with MS reported less strenuous (33.21 ± 31.88 metabolic equivalents [METs] vs 15.97 ± 22.73 METs, p = 0.002) and total (44.48 ± 39.35 METs vs 67.28 ± 59.65 METs; p = 0.0291) PA than those with mono-ADS. Patients with MS who reported greater amounts of moderate PA METs had fewer sleep/rest fatigue symptoms (r = −0.4). Participation in strenuous PA was associated with smaller T2 lesion volumes (r = −0.66) and lower annualized relapse rate (r = −0.66). No associations were found between total brain volume and participation in PA.
Conclusions:
Children with MS are less physically active than children with mono-ADS. Reasons for this are unclear, but may be related to ongoing disease activity, perceived limitations, or symptoms such as depression or fatigue. Children with MS reporting higher levels of strenuous PA had lower T2 lesion volumes and lower relapse rates, suggesting a potential protective effect of strenuous PA in this population. Further longitudinal studies are needed to establish the relationship of PA to MS symptoms and disease activity in this population.
Up to three-quarters of children with multiple sclerosis (MS) have depression, fatigue, or cognitive impairment.1,2 Children with MS experience more active disease than adults with MS, as demonstrated by increased lesion burden on MRI,3 relapse frequency,4 and irreversible motor disability occurring in young adulthood.5 Little is known about behavioral approaches for managing these problems in pediatric MS, but multicomponent interventions involving physical activity (PA) have improved cognition, mathematics, and reading,6,7 and exercise interventions have improved depression,8 executive function, and cognition,9 in healthy children and individuals with chronic illnesses.
Several studies support relationships between PA and outcomes in adult MS. Studies have documented lower PA levels in patients with MS than healthy controls10,11; the level of premorbid PA predicts the trajectory of disability scores12; and an association has been demonstrated between increased PA and health-related quality of life13 and decreased relapse rate,14 and aerobic training has improved fatigue and depression.15,16 We are unaware of research on PA and symptomatic, clinical, and MRI pediatric MS outcomes.
Conditions stemming from sedentary lifestyles may lead to increased risk for pediatric MS. Adolescent obesity yields an odds ratio for MS or clinically isolated syndrome of 3.76 (1.54–9.16) in extremely obese as compared to healthy girls in California.17 Thus, a complex relationship likely exists between lifestyle and multifactorial diseases like MS. Such evidence indirectly supports the examination of PA and outcomes in pediatric MS.
We examine PA, fatigue, depression, relapse rate, and MRI metrics in children with MS and with monophasic acquired demyelinating syndrome (mono-ADS).
METHODS
Study design.
The study had a cross-sectional design. We enrolled consecutive patients with demyelinating disorders followed at the Pediatric MS and Demyelinating Disorders Center at the Hospital for Sick Children, Toronto, Canada, from June through December 2013. The inclusion criteria were age between 5 and 18 years, ability to understand and complete the questionnaires, and diagnosis of a demyelinating disorder (mono-ADS or MS). International Pediatric MS Study Group consensus criteria for the definition of pediatric demyelinating disorders were followed.18 Children with monophasic illnesses were chosen as a comparison group to establish differences between patients with relapsing-remitting MS and children without relapsing disease.
Clinical data were collected using a standardized case report form (SickKids Demyelinating Diseases Registry) on the same day as questionnaire administration. The questionnaires were completed by the participants with assistance from their parents or the study coordinator, as needed. Data collected included demographic information, Expanded Disability Status Scale (EDSS) score, disease duration, and annualized relapse rate (ARR). MRI scans were performed, as part of another research study,19 on a subset of patients within 6 months of the PA questionnaire.
PA measure.
The Godin Leisure-Time Exercise Questionnaire (GLTEQ) was used to evaluate PA.20 The GLTEQ has been found to be reliable and valid for use in the pediatric population21 and has also often been used in MS.22 Individuals are asked to report the frequency of strenuous (i.e., running or jogging), moderate (i.e., fast walking), and mild (i.e., easy, leisurely walking) PA performed for periods of 15 minutes or more during leisure time over a usual week. Total leisure activity score was calculated by using the following formula: (frequency of strenuous PA × 9 metabolic equivalents [METs]) + (frequency of moderate PA × 5 METs) + (frequency of mild PA × 3 METs).
Following Godin,23 a health contribution score (HCS) was calculated, as recently done in adults with MS.22 This calculation is based on work that has shown the highest correlation between fitness level and subjective reporting to be related to reports of strenuous activity in addition to other work suggesting correlations between the volume of PA and health benefits; cutoff points are for 3 categories: active, moderately active, and insufficiently active. The HCS is calculated using the following formula: (frequency of strenuous PA × 9 METs) + (frequency of moderate PA × 5 METs). The HCS are then subdivided into 3 categories: ≥24 units (approximately 14 kcal/kg/wk or more), active; 14–23 units (between 7 and 13.9 kcal/kg/wk), moderately active; and <14 units (less than 7 kcal/kg/wk), insufficiently active.23
Fatigue and depression metrics.
The Varni24 PedsQL Multidimensional Fatigue Scale (PedsQL MFS), found to be reliable and valid in the pediatric population, was used to assess fatigue.25 The 18-item, self-rated, symptom-oriented scale assesses 3 areas of fatigue (general, sleep/rest, and cognitive). It was scored as follows: general, sleep/rest, and cognitive fatigue = 12–17 (moderate), ≥18 (severe); total fatigue = 36–53 (moderate), ≥54 (severe).
Depression was evaluated using the Center for Epidemiological Studies Depression Scale for Children (CES-DC).26,27 The CES-DC scale is a 20-item, self-rated, symptom-oriented pediatric depression scale that has been found to be valid, reliable, and predictive of depression in individuals aged 6–12 years. Higher scores have been found to correlate strongly with clinical depression (>15 considered significant).
MRI measures.
Children (mono-ADS n = 47, MS n = 13) received MRI scans using a standardized research protocol on a single GE 1.5T Twin Speed Excite 12.0 scanner (GE Healthcare, Waukesha, WI).28 MRI variables collected included total brain volume (TBV), TBV z score,29 T1 lesion volume, and T2 lesion volume.30 TBV was computed using the brain extraction based on nonlocal segmentation technique.31 TBV z score was calculated using normative pediatric MRI brain volume data from the NIH-funded MRI Study of Normal Brain Development (NIHPD).29 The following calculation was performed for each brain volume: z score = (V−μ)/σ, where V is the participant brain volume, μ is the mean, and σ is the SD of the brain volumes of the subset of the NIHPD normal participants of same sex and age ± 6 months.30
Statistical analysis.
Statistical analyses were conducted using GraphPad Prism 6 (GraphPad Software Inc., San Diego, CA). Between-group comparisons were performed using Mann-Whitney U tests, t tests, and χ2/Fisher exact analyses, as appropriate. Spearman correlation analysis was performed on the variables in each sample. A cutoff of p < 0.05 was considered significant.
Standard protocol approvals, registrations, and patient consents.
The study was approved by the Research Ethics Board at the Hospital for Sick Children, Toronto, Canada.
RESULTS
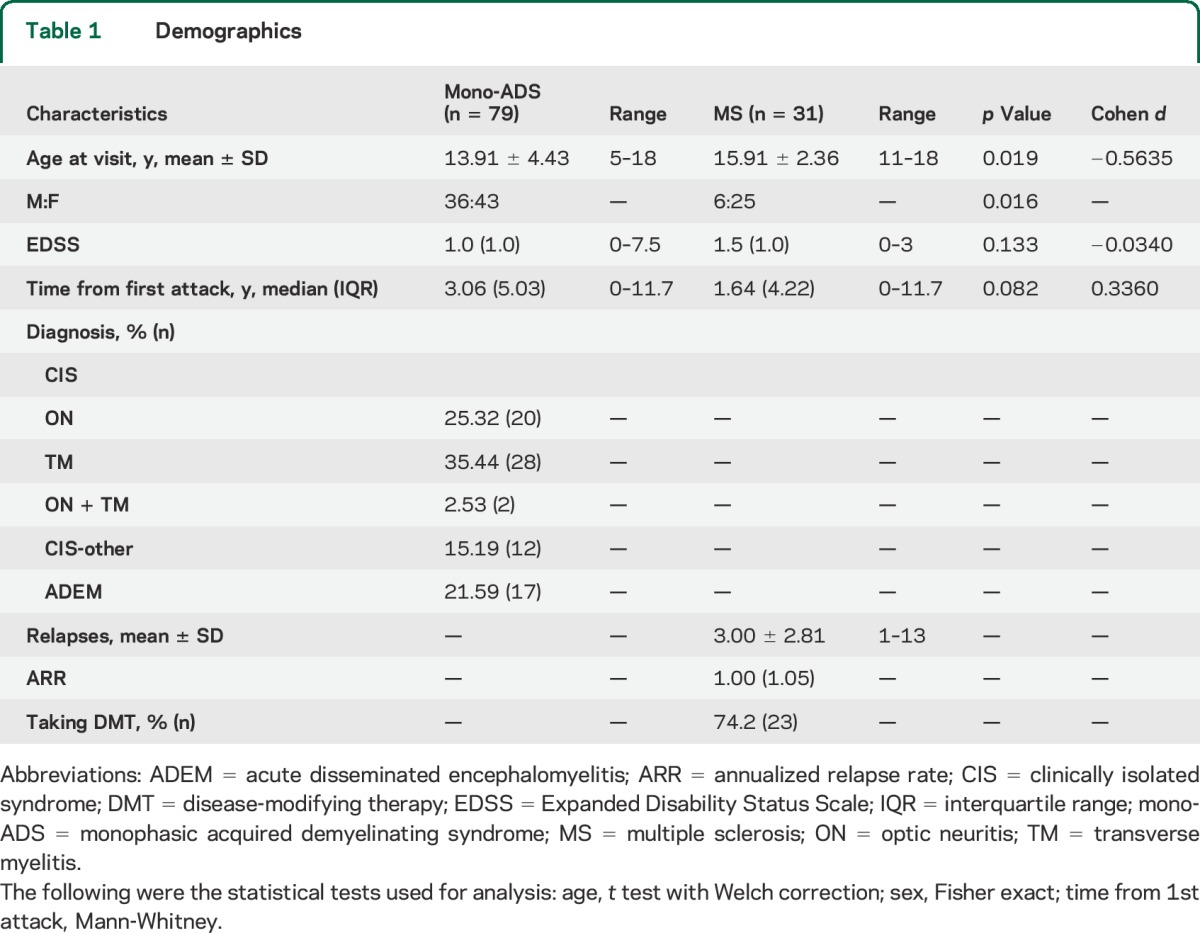
A total of 110 children and adolescents were included in the study (mono-ADS n = 79, MS n = 31). Patient demographics are shown in table 1. No differences were seen between the EDSS scores of the mono-ADS and MS groups; however, 5 patients with mono-ADS had an EDSS greater than or equal to 4 (representing motor disability severe enough to limit walking), whereas all of the patients with MS had an EDSS score less than 4.
Table 1.
Demographics
PA in pediatric MS.
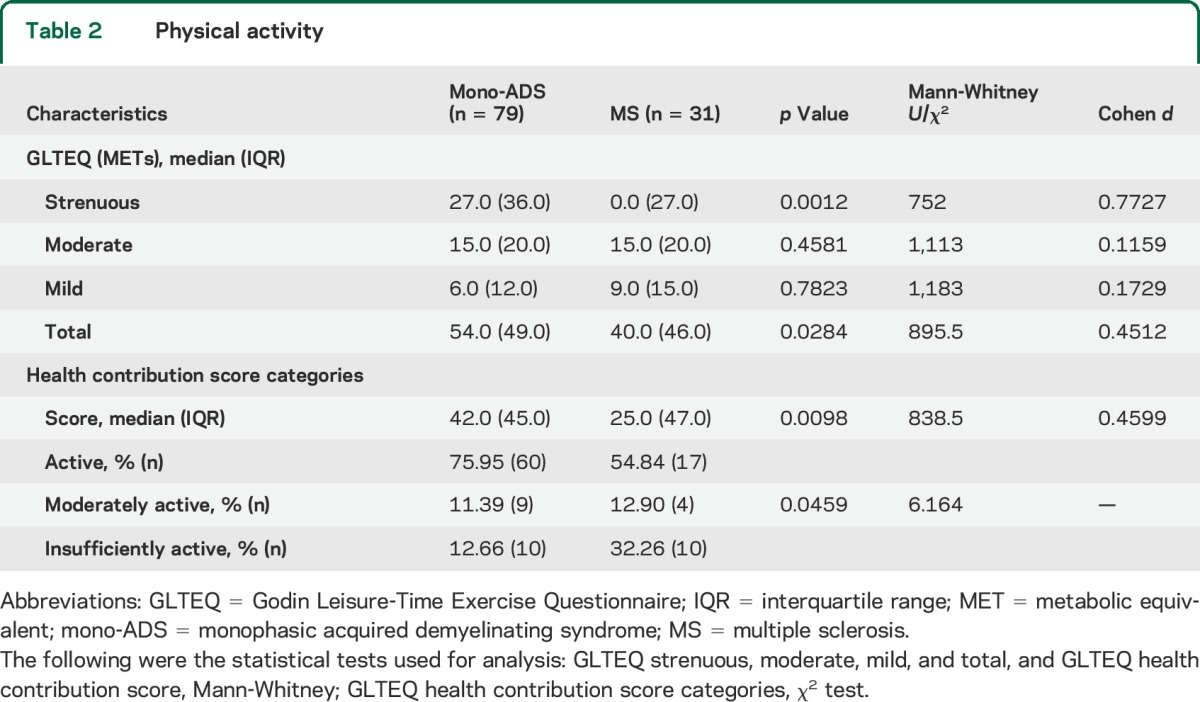
Pediatric patients with MS reported participating in less strenuous and total PA than those with mono-ADS (table 2). In addition, a lower proportion of the patients with MS reported participating in any strenuous PA (45.2%, 14/31) compared to those with mono-ADS (82.3%, 65/79, p = 0.0003). There were no differences between the groups in moderate or mild PA. Patients with MS had lower HCSs than the patients with mono-ADS (p = 0.01). In addition, analysis of HCSs indicated that fewer patients with MS than patients with mono-ADS were considered active. Conversely, HCS analysis suggested that a higher proportion of patients with MS than patients with mono-ADS were insufficiently active (p = 0.046) (table 2). When excluding patients with mono-ADS who had an EDSS ≥4, the same differences were found in strenuous and total PA in the HCS (table e-1 on the Neurology® Web site at Neurology.org).
Table 2.
Physical activity
Subgroup analyses focusing on age and sex were performed, yielding differences between girls and boys. Boys in the mono-ADS group reported participating in more moderate PA (median [interquartile range (IQR)]: 25 [25] METs) and total PA (66 [70] METs) than girls with mono-ADS (10 [20] METs, p = 0.008, and 46 [36] METs, p = 0.047, respectively). There were no differences between boys' and girls' participation in PA in the MS group. Analysis of the effect of age was performed. There were no patients with MS under 11 years of age. Girls who were 11 years old or older in the mono-ADS group (n = 34) reported participating in more strenuous PA (median [IQR]: 22.5 [27] METs) than the girls in the MS group (n = 25) (0 [27] METs, p = 0.01). No differences were seen between boys with MS and boys with mono-ADS 11 years old or older in strenuous (p = 0.34), moderate (p = 0.31), mild (p = 0.42), and total (p = 0.18) PA and HCS (p = 0.19). In the mono-ADS group, no differences were seen between preadolescents' (<11 years old) and adolescents' (≥11 years old) strenuous PA (p = 0.29).
Findings in the subgroup of patients with MRI scans were comparable to the larger group. Patients with MS in the MRI subgroup reported participating in less strenuous PA (median [IQR]: 0.0 METs [45.0 METs]) than those with mono-ADS (31.5 METs [36.0 METs], p = 0.028). There were no differences in moderate, mild, total, or HCS leisure activity scores between the groups in the MRI subpopulation.
Association of fatigue with PA and depression in patients with MS.
Patients with MS reported higher levels of general and total fatigue on the PedsQL MFS compared with the patients with mono-ADS. Levels of cognitive fatigue followed the same trend. A higher proportion of patients with MS had moderate to severe levels of general, sleep rest, and total fatigue than the patients with mono-ADS. Patients with MS also had higher depression scores on the CES-DC than did the patients with mono-ADS (table e-2).
For all the patients with MS in the study, the lower the sleep/rest fatigue scores, the higher the moderate PA METs, and, conversely, the higher the sleep/rest fatigue scores, the lower the reported moderate PA METs (r = −0.4). Similar results were found for patients with MS with MRI assessments. The lower the general fatigue scores, the higher the moderate PA METs, total PA METs, and HCS. Conversely, the higher the general fatigue scores, the lower the moderate PA METs, total PA METs, and HCS (r = −0.6, r = −0.5, and r = −0.6, respectively).
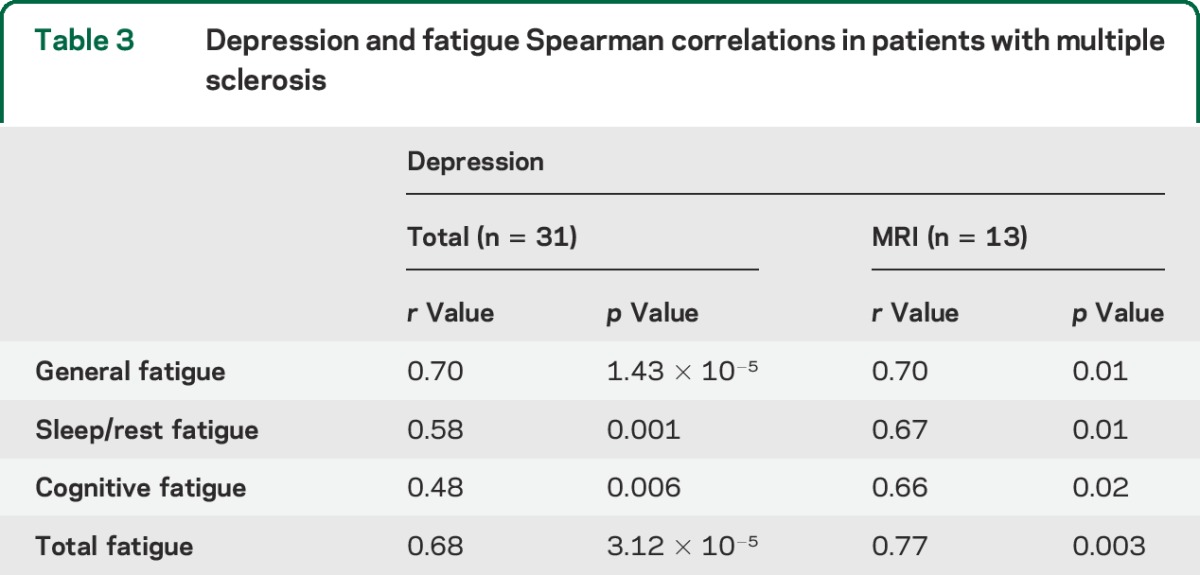
Among the patients with MS, we performed bivariate correlation analysis on the different categories of fatigue and depression and found that the higher the depression scores, the higher the fatigue scores, and the lower the depression scores, the lower the fatigue scores. These same associations were found in the MS subpopulation with MRI assessments (table 3). An analysis of questionnaire results controlling for disease-modifying therapy use revealed no difference between the results of the 2 groups (data not shown).
Table 3.
Depression and fatigue Spearman correlations in patients with multiple sclerosis
MRI and other metrics: Associations of PA with disease activity in MS.
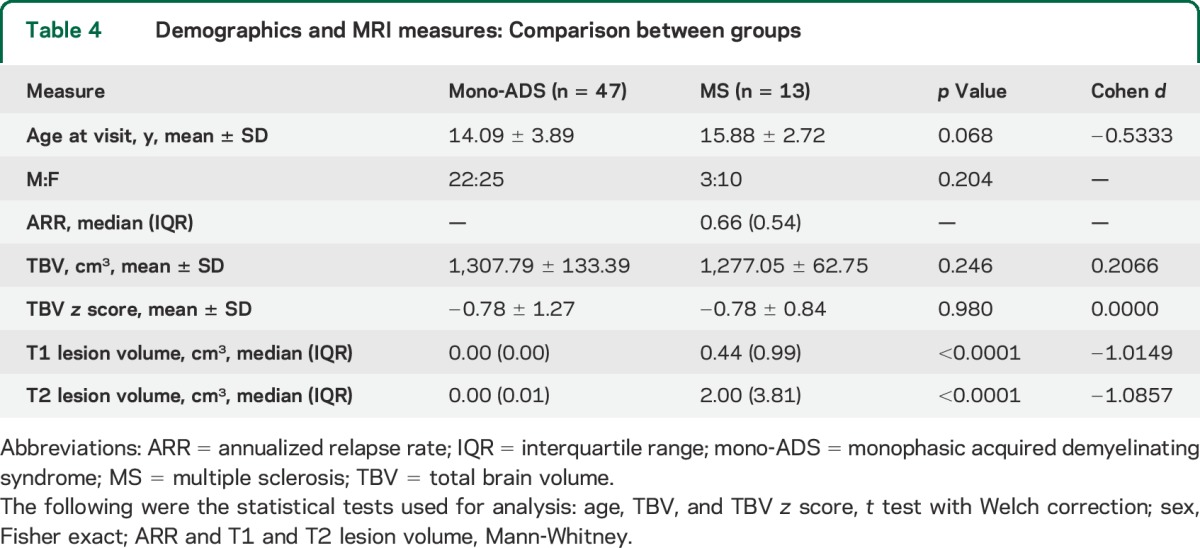
In the subpopulation of patients with MS and patients with mono-ADS with MRI assessment, age at the time of scan and sex were not different between groups. Patients were clinically stable between the clinical and MRI assessment. Consistent with previous studies, comparison of the mono-ADS and MS MRI total brain volume z scores with the expected 0.0 mean and 1.0 SD of the NIHPD population revealed lower z scores for both groups than the NIHPD population (t test: mono-ADS z score = −0.78 ± 1.27, p = 0.0001; MS z score = −0.78 ± 0.84, p = 0.0058). Thus, mean brain volumes were within the normal range for both patient groups, but the z scores of the patients were centered around lower means than the NIHPD group of healthy individuals. The total brain volumes and total brain volume z scores were normally distributed in both patient groups and there were no differences between the patients with MS and patients with mono-ADS (table 4). Patients with MS had greater T1 and T2 lesion volumes vs patients with mono-ADS (table 4).
Table 4.
Demographics and MRI measures: Comparison between groups
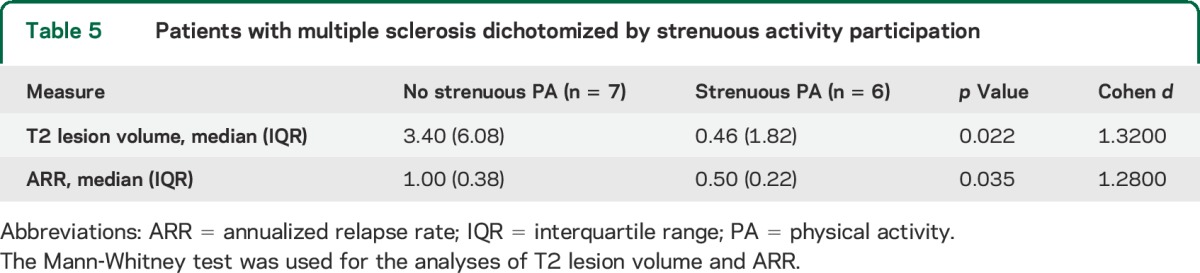
We performed bivariate correlations on data from the MS population and found that higher strenuous PA METs were associated with lower T2 (r = −0.66, p = 0.006) lesion volume and lower ARR (r = −0.66, p = 0.006). In order to validate the association between strenuous PA and T2 lesion volume and ARR, the MS patient sample was dichotomized by whether or not they participated in strenuous activity. In keeping with the associations found, the groups were different in their T2 lesion volume and ARR (table 5).
Table 5.
Patients with multiple sclerosis dichotomized by strenuous activity participation
DISCUSSION
We found lower levels of self-reported strenuous PA and overall activity in children with MS in comparison to children with mono-ADS.
Similar to other studies,32,33 we found higher levels of fatigue and depression in patients with MS than in children with monophasic demyelinating conditions. In the patients with MS, correlations were found between higher self-reported levels of PA and lower levels of sleep/rest and general fatigue. Lower levels of self-reported PA correlated with higher fatigue scores. This is in keeping with studies of adult MS, in which associations between both PA and exercise and fatigue and depression15,16 have been described. The cross-sectional nature of the study limits our ability to draw conclusions regarding the causal relationship between PA and fatigue in our population. Future studies should be oriented toward understanding factors that may influence the complex relationships between PA, depression, and fatigue. Certainly, multiple factors, such as sleep, pain, and disease activity, and psychological factors, such as self-efficacy,34 among others, may influence these outcomes.35,36
Within the MS cohort, sleep/rest fatigue levels were higher in patients who reported lower moderate PA participation. The same association held for general fatigue and moderate and overall PA, thus suggesting the potential for improvements in fatigue with increased levels of PA. Given the high correlation between fatigue and depression in our study, and high levels of depression in our patient population (approximately 1/5 of all patients), future studies should examine whether depression decreases through time in children who experience increases in PA. The robustness of these associations will be explored in the future in longitudinal and interventional studies.
An association was found between strenuous PA and lower T2 lesion volumes on MRI and lower ARR in patients with MS. Furthermore, we found a correlation between participation in strenuous PA had higher T2 lesion volumes and higher ARR. Although we could not determine the causal nature of this association in this cross-sectional study, others have shown associations between preservation of gray matter volumes and white matter integrity in patients with MS with high aerobic fitness, suggesting a beneficial effect of higher levels of PA on brain integrity.37
We acknowledge several limitations to our work. First, while consecutive children were recruited, the clinic itself is a specialized clinic at a tertiary care center, suggesting the possibility of patient selection bias. However, because the catchment area of the Hospital for Sick Children covers the entirety of the greater Toronto area, and most patients in the region with these disorders are captured by this clinic, the potential for selection bias is relatively small. Second, we did not have MRI scans available for volumetric analysis on all participants, suggesting the potential for selection bias with this subgroup. However, our analysis suggests that those with research scans did not differ substantially from those who did not have research scans (table e-3). Third, there are limitations to the use of 7-day recall questionnaires for documenting PA, although strong correlations have been found by others between an objective measure of PA (accelerometry) and the GLTEQ.38 Finally, our study is limited by its cross-sectional nature. The directionality of the association of decreased activity with higher lesion volume cannot be concluded from our study. Future studies should address these limitations by correlating questionnaire data with objective evaluations of fitness and PA and assessing patients longitudinally.
While we found an association between strenuous PA and lower brain T2 lesion volumes in this population, we were unable to explore gray matter volumes in this study as the analysis of gray matter volumes was outside the scope of the present work. Higher fitness in children has been associated with greater brain volumes, both overall and in the hippocampus and deep gray structures, including the putamen, caudate nucleus, and globus pallidus, as well as with higher performance on measures of cognitive control that involve working memory, inhibition, and cognitive flexibility.39,40 Future studies focusing on the association of PA with gray matter volume and deep gray structures in children with MS are needed.
Thus, our data suggest low levels of overall and strenuous PA in children with MS, and a possible link between PA and fatigue and MRI lesion volume and ARR in the pediatric MS population. Future studies should focus on establishing the causal nature of this relationship by investigating interventions to improve PA and examining associated consequences in this population. These future interventions have the potential to improve quality of life by attenuating symptoms such as depression and fatigue and potentially reducing the rate of disease progression.
Supplementary Material
ACKNOWLEDGMENT
The authors thank the staff involved with the Pediatric MS and Demyelinating Disorders Clinic, Hospital for Sick Children, for help and support; Ramnik Sekhon, Hospital for Sick Children, for collection of data; and Rozie Arnaoutelis, Montreal Neurological Institute, for help and organization with data collection.
GLOSSARY
- ARR
annualized relapse rate
- CES-DC
Center for Epidemiological Studies Depression Scale for Children
- EDSS
Expanded Disability Status Scale
- GLTEQ
Godin Leisure-Time Exercise Questionnaire
- HCS
health contribution score
- IQR
interquartile range
- MET
metabolic equivalent
- mono-ADS
monophasic acquired demyelinating syndrome
- MS
multiple sclerosis
- NIHPD
NIH-funded MRI Study of Normal Brain Development
- PA
physical activity
- PedsQL MFS
PedsQL Multidimensional Fatigue Scale
- TBV
total brain volume
Footnotes
Editorial, page 1644
Supplemental data at Neurology.org
AUTHOR CONTRIBUTIONS
S.A. Grover helped to design and conceptualize the study, performed analysis and interpretation of the data, and drafted the manuscript. B. Aubert-Broche helped with the analysis/interpretation of the MRI data and revision of the manuscript for intellectual content. D. Fetco helped with the analysis/interpretation of the MRI data. D.L. Collins, D.L. Arnold, M. Finlayson, B.L. Banwell, and R.W. Motl helped revise the manuscript for intellectual content. R.W. Motl also helped to design the study. E.A. Yeh helped to design and conceptualize the study, interpret the data, and drafted and revised the manuscript.
STUDY FUNDING
Supported by funds from the MS Society of Canada, Canadian MS Scientific Research Foundation, and SickKids Foundation, Toronto, Canada.
DISCLOSURE
S. Grover, B. Aubert-Broche, and D. Fetco report no disclosures relevant to the manuscript. D. Collins has consulted for NeuroRX and is the cofounder of True Positive Medial Devices Inc. D. Arnold and M. Finlayson report no disclosures relevant to the manuscript. B. Banwell is an advisor to Biogen Idec, Novartis, Eli Lilly, and Sanofi-Aventis. She is also a chief editor for Multiple Sclerosis and Related Disorders and is on the editorial board for Neurology®. R. Motl receives funding from Biogen, Acorda, NMSS, and CMSS. He receives honoraria from EMD Serono. E. Yeh reports no disclosures relevant to the manuscript. Go to Neurology.org for full disclosures.
REFERENCES
- 1.Amato MP, Goretti B, Ghezzi A, et al. Cognitive and psychosocial features in childhood and juvenile MS: two-year follow-up. Neurology 2010;75:1134–1140. [DOI] [PubMed] [Google Scholar]
- 2.Parrish JB, Weinstock-Guttman B, Smerbeck A, Benedict RH, Yeh EA. Fatigue and depression in children with demyelinating disorders. J Child Neurol 2013;28:713–718. [DOI] [PubMed] [Google Scholar]
- 3.Yeh EA, Weinstock-Guttman B, Ramanathan M, et al. Magnetic resonance imaging characteristics of children and adults with paediatric-onset multiple sclerosis. Brain 2009;132:3392–3400. [DOI] [PubMed] [Google Scholar]
- 4.Gorman MP, Healy BC, Polgar-Turcsanyi M, Chitnis T. Increased relapse rate in pediatric-onset compared with adult-onset multiple sclerosis. Arch Neurol 2009;66:54–59. [DOI] [PubMed] [Google Scholar]
- 5.Renoux C, Vukusic S, Mikaeloff Y, et al. Natural history of multiple sclerosis with childhood onset. N Engl J Med 2007;356:2603–2613. [DOI] [PubMed] [Google Scholar]
- 6.Nansel TR, Huang TT, Rovner AJ, Sanders-Butler Y. Association of school performance indicators with implementation of the Healthy Kids, Smart Kids programme: case study. Public Health Nutr 2010;13:116–122. [DOI] [PMC free article] [PubMed] [Google Scholar]
- 7.Shilts MK, Lamp C, Horowitz M, Townsend MS. Pilot study: EatFit impacts sixth graders' academic performance on achievement of mathematics and English education standards. J Nutr Educ Behav 2009;41:127–131. [DOI] [PubMed] [Google Scholar]
- 8.Herring MP, Puetz TW, O'Connor PJ, Dishman RK. Effect of exercise training on depressive symptoms among patients with a chronic illness: a systematic review and meta-analysis of randomized controlled trials. Arch Intern Med 2012;172:101–111. [DOI] [PubMed] [Google Scholar]
- 9.Davis CL, Tomporowski PD, McDowell JE, et al. Exercise improves executive function and achievement and alters brain activation in overweight children: a randomized, controlled trial. Health Psychol 2011;30:91–98. [DOI] [PMC free article] [PubMed] [Google Scholar]
- 10.Motl RW, McAuley E, Snook EM. Physical activity and multiple sclerosis: a meta-analysis. Mult Scler 2005;11:459–463. [DOI] [PubMed] [Google Scholar]
- 11.Ploughman M, Beaulieu S, Harris C, et al. The Canadian survey of health, lifestyle and ageing with multiple sclerosis: methodology and initial results. BMJ Open 2014;4:e005718. [DOI] [PMC free article] [PubMed] [Google Scholar]
- 12.Motl RW, Dlugonski D, Pilutti L, Sandroff B, McAuley E. Premorbid physical activity predicts disability progression in relapsing-remitting multiple sclerosis. J Neurol Sci 2012;323:123–127. [DOI] [PubMed] [Google Scholar]
- 13.Motl RW, Gosney JL. Effect of exercise training on quality of life in multiple sclerosis: a meta-analysis. Mult Scler 2008;14:129–135. [DOI] [PubMed] [Google Scholar]
- 14.Pilutti LA, Platta ME, Motl RW, Latimer-Cheung AE. The safety of exercise training in multiple sclerosis: a systematic review. J Neurol Sci 2014;343:3–7. [DOI] [PubMed] [Google Scholar]
- 15.Pilutti LA, Greenlee TA, Motl RW, Nickrent MS, Petruzzello SJ. Effects of exercise training on fatigue in multiple sclerosis: a meta-analysis. Psychosom Med 2013;75:575–580. [DOI] [PubMed] [Google Scholar]
- 16.Ensari I, Motl RW, Pilutti LA. Exercise training improves depressive symptoms in people with multiple sclerosis: results of a meta-analysis. J Psychosom Res 2014;76:465–471. [DOI] [PubMed] [Google Scholar]
- 17.Langer-Gould A, Brara SM, Beaber BE, Koebnick C. Childhood obesity and risk of pediatric multiple sclerosis and clinically isolated syndrome. Neurology 2013;80:548–552. [DOI] [PMC free article] [PubMed] [Google Scholar]
- 18.Krupp LB, Tardieu M, Amato MP, et al. International Pediatric Multiple Sclerosis Study Group criteria for pediatric multiple sclerosis and immune-mediated central nervous system demyelinating disorders: revisions to the 2007 definitions. Mult Scler 2013;19:1261–1267. [DOI] [PubMed] [Google Scholar]
- 19.Banwell B, Bar-Or A, Arnold DL, et al. Clinical, environmental, and genetic determinants of multiple sclerosis in children with acute demyelination: a prospective national cohort study. Lancet Neurol 2011;10:436–445. [DOI] [PubMed] [Google Scholar]
- 20.Godin G, Shephard RJ. A simple method to assess exercise behavior in the community. Can J Appl Sport Sci 1985;10:141–146. [PubMed] [Google Scholar]
- 21.Sallis JF, Buono MJ, Roby JJ, Micale FG, Nelson JA. Seven-day recall and other physical activity self-reports in children and adolescents. Med Sci Sports Exerc 1993;25:99–108. [DOI] [PubMed] [Google Scholar]
- 22.Motl RW, McAuley E, Sandroff BM, Hubbard EA. Descriptive epidemiology of physical activity rates in multiple sclerosis. Acta Neurol Scand 2015;131:422–425. [DOI] [PubMed] [Google Scholar]
- 23.Godin G. Commentary: the Godin-Shephard Leisure-Time Physical Activity Questionnaire. Health Fitness J Canada 2011;4:18–22. [Google Scholar]
- 24.Varni JW. The PedsQL Measurement Model for the Pediatric Quality of Life Inventory [online]. Available at: http://www.pedsql.org. Accessed April 17, 2015. [DOI] [PubMed] [Google Scholar]
- 25.Varni JW, Seid M, Kurtin PS. PedsQL 4.0: reliability and validity of the Pediatric quality of life inventory version 4.0 generic core scales in healthy and patient populations. Med Care 2001;39:800–812. [DOI] [PubMed] [Google Scholar]
- 26.Fendrich M, Weissman MM, Warner V. Screening for depressive disorder in children and adolescents: validating the Center for Epidemiologic Studies Depression Scale for Children. Am J Epidemiol 1990;131:538–551. [DOI] [PubMed] [Google Scholar]
- 27.Faulstich ME, Carey MP, Ruggiero L, Enyart P, Gresham F. Assessment of depression in childhood and adolescence: an evaluation of the Center for Epidemiological Studies Depression Scale for Children (CES-DC). Am J Psychiatry 1986;143:1024–1027. [DOI] [PubMed] [Google Scholar]
- 28.Verhey LH, Branson HM, Shroff MM, et al. MRI parameters for prediction of multiple sclerosis diagnosis in children with acute CNS demyelination: a prospective national cohort study. Lancet Neurol 2011;10:1065–1073. [DOI] [PubMed] [Google Scholar]
- 29.Evans AC; Brain Development Cooperative G. The NIH MRI study of normal brain development. Neuroimage 2006;30:184–202. [DOI] [PubMed] [Google Scholar]
- 30.Aubert-Broche B, Fonov V, Ghassemi R, et al. Regional brain atrophy in children with multiple sclerosis. Neuroimage 2011;58:409–415. [DOI] [PubMed] [Google Scholar]
- 31.Eskildsen SF, Coupe P, Fonov V, et al. BEaST: brain extraction based on nonlocal segmentation technique. Neuroimage 2012;59:2362–2373. [DOI] [PubMed] [Google Scholar]
- 32.Goretti B, Portaccio E, Ghezzi A, et al. Fatigue and its relationships with cognitive functioning and depression in paediatric multiple sclerosis. Mult Scler 2012;18:329–334. [DOI] [PubMed] [Google Scholar]
- 33.MacAllister WS, Christodoulou C, Troxell R, et al. Fatigue and quality of life in pediatric multiple sclerosis. Mult Scler 2009;15:1502–1508. [DOI] [PubMed] [Google Scholar]
- 34.Smith CM, Fitzgerald HJ, Whitehead L. How fatigue influences exercise participation in men with multiple sclerosis. Qual Health Res 2015;25:179–188. [DOI] [PubMed] [Google Scholar]
- 35.Patrick E, Christodoulou C, Krupp LB; New York State MSC. Longitudinal correlates of fatigue in multiple sclerosis. Mult Scler 2009;15:258–261. [DOI] [PubMed] [Google Scholar]
- 36.Penner IK, Bechtel N, Raselli C, et al. Fatigue in multiple sclerosis: relation to depression, physical impairment, personality and action control. Mult Scler 2007;13:1161–1167. [DOI] [PubMed] [Google Scholar]
- 37.Prakash R, Snook E, Motl R, Kramer A. Aerobic fitness is associated with gray matter volume and white matter integrity in multiple sclerosis. Brain Res 2010;1341:41–51. [DOI] [PMC free article] [PubMed] [Google Scholar]
- 38.Motl RW, McAuley E, Klaren R. Reliability of physical-activity measures over six months in adults with multiple sclerosis: implications for designing behavioral interventions. Behav Med 2014;40:29–33. [DOI] [PubMed] [Google Scholar]
- 39.Chaddock L, Erickson KI, Prakash RS, et al. A neuroimaging investigation of the association between aerobic fitness, hippocampal volume, and memory performance in preadolescent children. Brain Res 2010;1358:172–183. [DOI] [PMC free article] [PubMed] [Google Scholar]
- 40.Chaddock L, Erickson KI, Prakash RS, et al. Basal ganglia volume is associated with aerobic fitness in preadolescent children. Dev Neurosci 2010;32:249–256. [DOI] [PMC free article] [PubMed] [Google Scholar]
Associated Data
This section collects any data citations, data availability statements, or supplementary materials included in this article.