

Abstract
Objectives:
Using quantitative T2* 7-tesla (7T) MRI as a marker of demyelination and iron loss, we investigated, in patients with relapsing-remitting multiple sclerosis (RRMS) and secondary progressive multiple sclerosis (SPMS), spatial and tissue intrinsic characteristics of cortical lesion(s) (CL) types, and structural integrity of perilesional normal-appearing cortical gray matter (NACGM) as a function of distance from lesions.
Methods:
Patients with MS (18 RRMS, 11 SPMS), showing at least 2 CL, underwent 7T T2* imaging to obtain (1) magnitude images for segmenting focal intracortical lesion(s) (ICL) and leukocortical lesion(s) (LCL), and (2) cortical T2* maps. Anatomical scans were collected at 3T for cortical surface reconstruction using FreeSurfer. Seventeen age-matched healthy participants served as controls.
Results:
ICL were predominantly located in sulci of frontal, parietal, and cingulate cortex; LCL distribution was more random. In MS, T2* was higher in both ICL and LCL, indicating myelin and iron loss, than in NACGM (p < 0.00003) irrespective of CL subtype and MS phenotype. T2* was increased in perilesional cortex, tapering away from CL toward NACGM, the wider changes being for LCL in SPMS. NACGM T2* was higher in SPMS relative to RRMS (p = 0.006) and healthy cortex (p = 0.02).
Conclusions:
CL had the same degree of demyelination and iron loss regardless of lesion subtype and disease stage. Cortical damage expanded beyond visible CL, close to lesions in RRMS, and more diffusely in SPMS. Evaluation of NACGM integrity, beyond focal CL, could represent a surrogate marker of MS progression.
Demyelinating cortical lesion(s) (CL) are thought to contribute to disease progression in multiple sclerosis (MS).1–3 Seven-tesla (T) T2* gradient-echo imaging has shown increased sensitivity (approximately 50%–90%) to detect MS CL.4–6 Ex vivo MRI studies demonstrated increased T2* in MS CL, pathologically related to demyelination and iron loss.5,6 Histopathologic–MRI correlations suggested that MRI-visible CL may represent the tip of the iceberg7 underlying a more diffuse demyelinating cortical process.
We previously demonstrated in vivo T2* increase at different depths of the cortical width throughout stages of MS, associated with worsening disability.8 Quantitative T2* changes were not confined to focal CL but were also found globally in the normal-appearing cortical gray matter (NACGM) in secondary progressive MS (SPMS). The relationship between pathology in NACGM and in focal CL at different MS stages is unclear: NACGM abnormalities could either reflect a diffuse degenerative process or abnormalities in normal cortex surrounding CL. Because CL may underlie different pathologic processes including endogenous remyelination depending on their location across the cortical/subcortical width,9 their extent on surrounding NACGM may vary according to CL subtype.
In a heterogeneous MS cohort, we used 7T quantitative T2* MRI to (1) map the spatial distribution and frequency of CL subtypes, (2) assess whether the degree of tissue pathology within CL varies depending on disease stage, and (3) quantify perilesional pathology in CL subtypes as a function of distance from lesions. We hypothesized that patients with SPMS had more severe pathology within focal CL and perilesional cortex.
METHODS
Standard protocol approvals, registrations, and patient consents.
The institutional review board of our institution approved all study procedures, and participants provided written informed consent to participate in the study.
Participants.
Twenty-nine patients (20 women; mean age 44.1 years ±9.2 SD) with a diagnosis of MS10 and who displayed at least 2 focal intracortical lesion(s) (ICL) or leukocortical lesion(s) (LCL) on 7T scans were retrospectively selected from a cohort of 41 patients with MS participating in a prospective study assessing cortical pathology at 7T.8 ICL included lesions originating from the pial surface and extending at different depths throughout the cortical width (type III–IV lesions), and type II lesions8,11; LCL were defined as extending through gray matter (GM)/white matter (WM) without reaching the pial surface. Seventeen age-matched healthy individuals (9 women, mean age 39.3 years ±8.8 SD) served as controls.
Clinical course of patients included RRMS (n = 18) and SPMS (n = 11). Twenty-two of 29 patients were receiving stable treatment (at least 6 months) with disease-modifying therapies (interferon beta or glatiramer acetate: 6 RRMS, 5 SPMS; BG-12: 1 RRMS; natalizumab: 6 RRMS, 3 SPMS; rituximab: 1 SPMS). Neurologic disability was assessed using the Expanded Disability Status Scale (EDSS)12 within a week from MRI scans. Disease severity was evaluated using the Multiple Sclerosis Severity Score.13
General exclusion criteria included significant psychiatric and/or neurologic disease (other than MS for patients), major medical comorbidity, pregnancy, and contraindications for MRI.
MRI data acquisition.
All study participants underwent 2 imaging sessions at 7T and 3T (Siemens scanners) using 32-channel coils. The 7T protocol included acquisition of (1) multiecho 2-dimensional (2D) fast low-angle shot (FLASH) T2*-weighted spoiled gradient-echo (GRE) images with repetition time (TR) = 2,210 milliseconds (ms), echo time (TE) = 6.44 + 3.32n [n = 0, …, 11] ms, flip angle = 55°, 2 slabs of 40 slices each to cover the supratentorial brain, resolution = 0.33 × 0.33 × 1 mm3 (25% gap), and acquisition time (TA) for each slab = approximately 10 minutes; (2) a T1-weighted 3D magnetization-prepared rapid acquisition gradient echo sequence (TR/inversion time/TE = 2,600/1,100/3.26 ms, flip angle = 9°, resolution = 0.60 × 0.60 × 1.5 mm3, TA = 5.5 minutes) for coregistration of 7T GRE data with cortical surfaces; and (3) a single-echo 2D FLASH T2*-weighted spoiled GRE pulse sequence (TR/TE = 1,700/21.8 ms; the other parameters were identical to the multiecho 2D FLASH T2* sequence).
During the 3T session, a structural scan with a 3D magnetization-prepared rapid acquisition with multiple gradient echoes (MEMPR) (TR/inversion time = 2,530/1,200 ms, TE = 1.7, 3.6, 5.4, 7.3 ms, resolution = 0.9 × 0.9 × 0.9 mm3, TA = approximately 6.5 minutes) was obtained for cortical surface reconstruction and coregistration with 7T data.
MRI data processing.
WM lesion volume.
WM lesions were segmented on magnitude images from 7T single-echo FLASH T2* scans with a semiautomated method implemented in 3D Slicer version 4.2.0 (http://www.slicer.org). WM lesion volume was computed using fslstats, part of FSL (FMRIB Software Library, http://fsl.fmrib.ox.ac.uk/fsl/fslwiki/FSL).
Cortical surface reconstruction.
Reconstruction of pial and WM surfaces was performed using the software FreeSurfer, version 5.3.0 (http://surfer.nmr.mgh.harvard.edu/), according to a multistep procedure that calculates the GM/WM border and the CSF/GM (pial) border in the 3D MEMPR volume,14 currently the recommended anatomical sequence for FreeSurfer pipeline.15 Topologic defects in cortical surfaces due to WM and LCL were corrected using a semiautomated procedure with lesions filling.
Mean cortical thickness (mm) was measured in each participant as previously described15 and used as covariate of no interest in statistical analyses.
Quantitative T2* maps.
Quantitative T2* maps were generated from 7T multiecho T2* scans in each participant as previously described.8,16,17 Briefly, T2* signal, corrected for susceptibility-induced through-slice dephasing, was fitted vs TE voxel-wise using a Levenberg–Marquardt nonlinear regression model. R2 goodness of fit was measured, and voxels with poor goodness of fit (R2 < 0.8) were excluded from further analyses. T2* maps were registered onto the corresponding 3T cortical surfaces using a 2-step procedure, as previously described.16,17 The registered data were then concatenated into a whole brain volume using FreeSurfer tools and resampled at 0.33 × 0.33 × 0.33 mm3 isotropic voxels.
Cortical lesion segmentation, count, and volume.
Focal ICL and LCL that appeared as focal cortical hyperintensities and extended for at least 3 voxels and across 2 consecutive slices on magnitude images from 7T single-echo FLASH T2* were segmented by consensus by 2 experienced raters (C.M., C. Louapre) using Slicer.
In each participant, single-echo T2* images, ICL, LCL, and NACGM masks were registered onto the corresponding 3T cortical surfaces using a 2-step procedure based on boundary-based registration18 as previously described.16,17 ICL and LCL count and volume were computed using FreeSurfer and FSL tools (mri_volcluster and fslstats, respectively).
Cortical lesion spatial analysis and probability distribution map.
Using FreeSurfer tools, individual ICL and LCL masks were projected on each participant's cortical surface resulting in 2D lesional masks. Using the cortex curvature map, we then quantified the total area of cortical lesions belonging to sulci (displaying positive curvature values) and to gyri (displaying negative curvature values).
Subsequently, 2D cortical lesion masks were normalized to a common surface template, “fsaverage,” using FreeSurfer. Lesion probability maps were then generated by averaging individual ICL and LCL normalized masks. Peaks of lesion probability were localized using the Desikan atlas in FreeSurfer.
Quantitative T2* analysis of lesional, perilesional, and normal-appearing cortex.
In each participant, we computed mean T2* (ms) in ICL, LCL, and NACGM masks previously coregistered to the corresponding cortical surfaces. Given that the focus of the study was the cortex, for LCL, T2* was measured only in the intracortical portion of the mask (i.e., the intersection between the LCL mask and the FreeSurfer cortical ribbon mask).
We further analyzed the extent of ICL and LCL pathology toward perilesional cortex. Because of the thin and circumvolved geometry of the cortex, the analysis was performed on individual 2D ICL and LCL masks. T2* relaxation time was then mapped at 50% depth from the pial surface and computed as a function of distance from the ICL, and mapped at 75% depth from the pial surface and computed as a function of distance from the LCL; 0% depth was the pial surface and 100% depth was the WM/GM boundary.
Each vertex on the participant's cortical surface was assigned its geodesic distance from the lesions, the geodesic distance being the number of edges in the shortest path connecting a given vertex to a lesion (figure e-1 on the Neurology® Web site at Neurology.org). For each participant, we calculated T2*(N), the average of T2* values over all vertices being at a given geodesic distance N of the lesions. As previously observed,16,17 T2* values varied across the cortex, and accordingly, T2* within lesions is dependent on lesion location in individual participants. Therefore, to analyze T2* decay surrounding lesions across the whole MS group, we subtracted T2*(N) by its baseline value defined as the minimum over a range of 10 < N < 20.
Statistics.
Demographic and/or imaging metrics were compared between patients and controls, and between RRMS and SPMS using a Mann–Whitney U test or Student t test as appropriate and a χ2 test for sex repartition.
In the whole MS group, each patient's ratio of ICL and LCL area in sulci relative to the total lesional area was compared to its ratio of sulci surface relative to the total cortical surface using a paired t test.
Mean T2* in NACGM in each MS group and cortical T2* in controls were compared by linear regression using age and cortical thickness as nuisance factors. Mean T2* in each lesion mask was compared with NACGM T2* in each patient group by paired t test, and with cortical T2* in controls by linear regression using age and mean cortical thickness as nuisance factors.
Finally, we determined the geodesic distance up to which T2*(N) was significantly different from distant NACGM (N = 20) using paired t test.
All statistical analyses were performed with R software (version 2.13.1), and p values <0.05 were considered statistically significant. A false discovery rate method was applied to correct for multiple comparisons when comparing different cortical tissue compartments within and across groups.
RESULTS
Demographics.
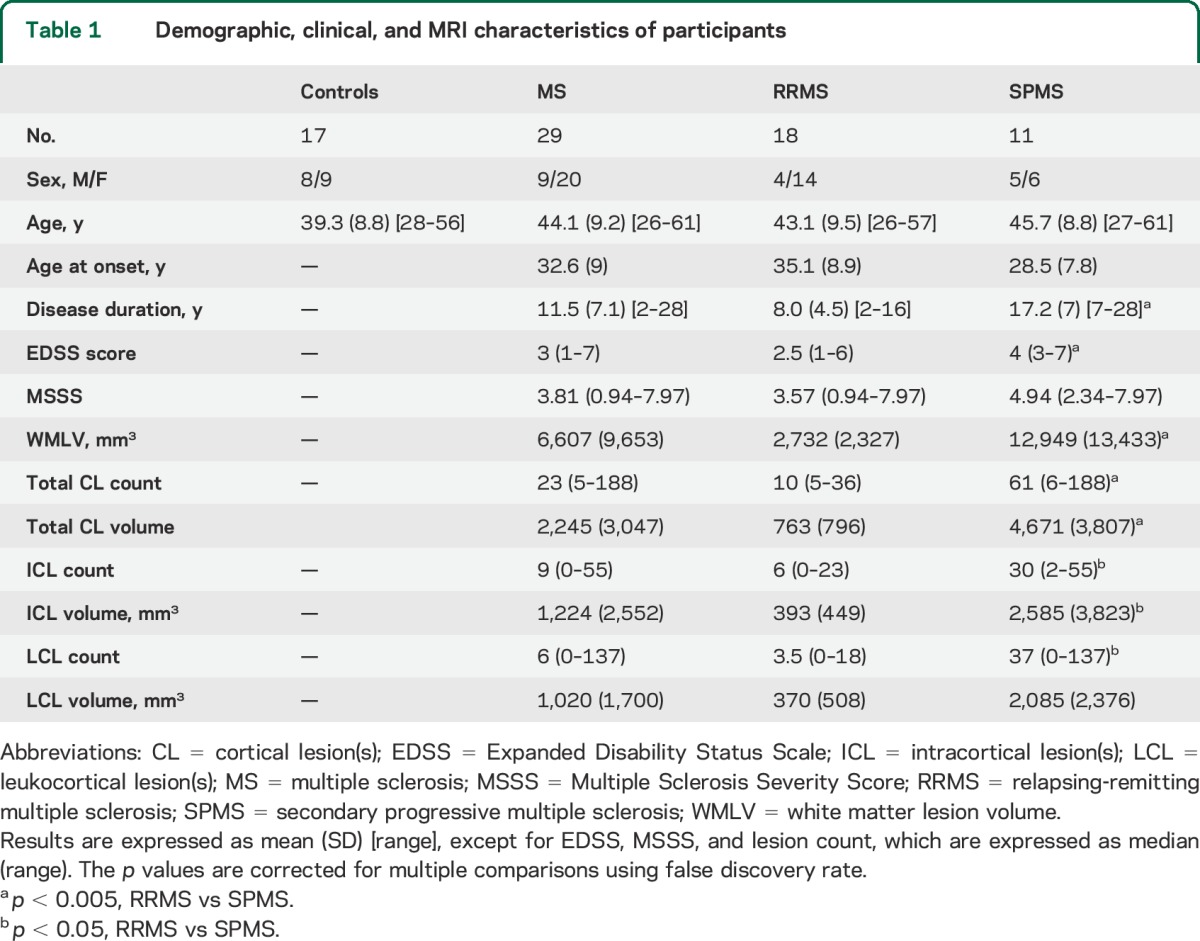
Participants' demographic, clinical, and MRI variables are reported in table 1. Disease duration, EDSS scores, and WM lesion volume were higher in SPMS relative to RRMS (p < 0.005). Age at disease onset tended to be younger in SPMS than in RRMS (p = 0.06). ICL count, ICL volume, and LCL volume were also higher in SPMS relative to RRMS (p < 0.05).
Table 1.
Demographic, clinical, and MRI characteristics of participants
Spatial distribution of focal cortical lesions.
In the entire MS cohort, the highest distribution of ICL was in superior, middle frontal areas and central sulcus, followed by parietal, cingulate, and temporal cortex (table 2, figure 1). LCL distribution was more random. There were fewer ICL in RRMS than in SPMS and they were mainly distributed in the central sulcus, frontal areas, and cingulate cortex (figure e-2).
Table 2.
Location of clusters exhibiting the highest spatial distribution for ICL and LCL in the entire MS group
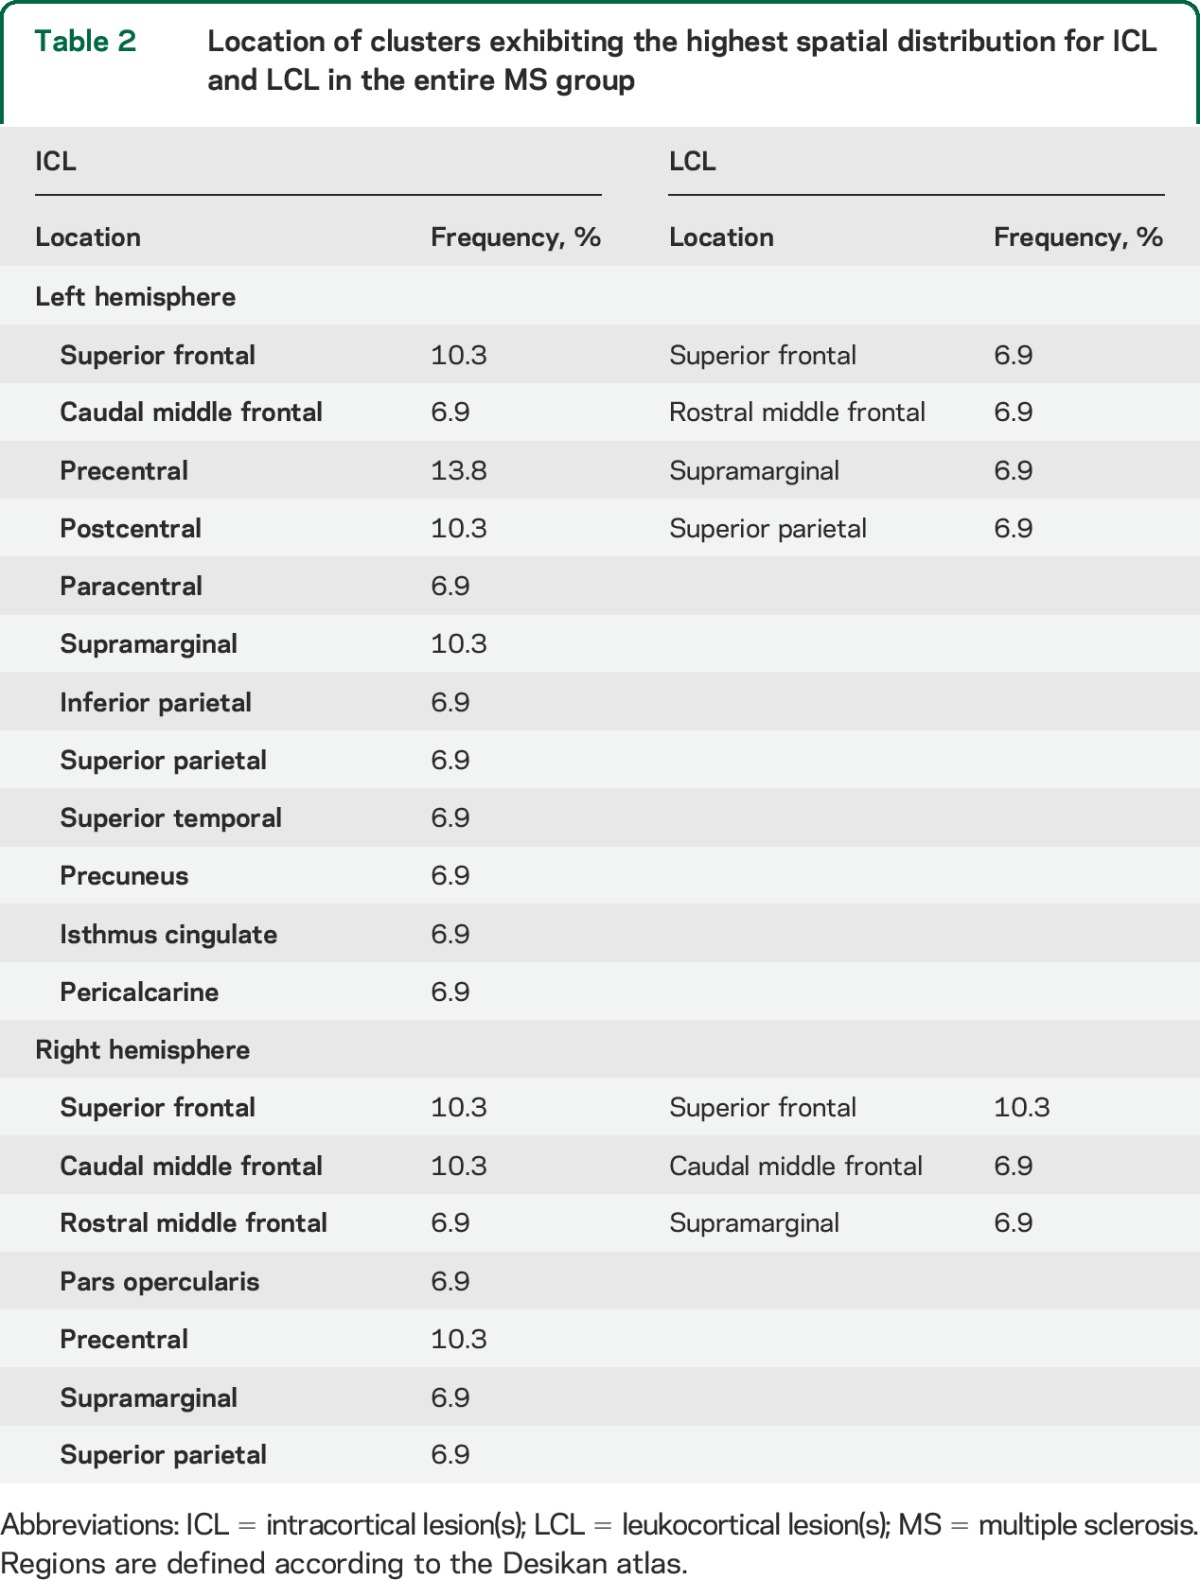
Figure 1. Overlay on “fsaverage” template of cortical lesion probability maps in patients with multiple sclerosis.

The color overlay represents the vertex-wise frequency of cortical lesion occurrence. ICL = intracortical lesion(s); lat. = lateral; LCL = leukocortical lesion(s); LH = left hemisphere; med. = medial; RH = right hemisphere.
In each patient, both ICL and LCL were predominantly identified in cortical sulci, with an average 84% of ICL area and 64% of LCL area in sulci in the entire group. This was higher than the ratio of sulci surface to total cortical surface, representing 47% in mean (p = 10−15 for ICL and p = 10−2 for LCL).
Quantitative T2* in lesional and normal-appearing cortex.
As previously reported,8 in our MS cohort, mean T2* in ICL (41 ± 4.6 ms) and LCL (41.1 ± 3.4 ms) was higher than mean NACGM T2* (p < 10−9 by paired t test for ICL and LCL) and than mean cortical T2* in controls (p < 10−6 and p < 10−7 by linear regression using age and cortical thickness as nuisance factor).
In both RRMS and SPMS subgroups, ICL and LCL had longer T2* relative to NACGM T2* and to cortical T2* in controls. There was no difference in ICL and LCL T2* between RRMS and SPMS (figure 2).
Figure 2. Boxplots of T2* relaxation time (ms) in cortical tissue compartments in controls (green), RRMS (pink), and SPMS (red).

SPMS showed higher NACGM T2* relative to cortical T2* in controls (p = 0.01) and NACGM T2* in RRMS (p = 0.005), by linear regression including age and cortical thickness as nuisance factors. In RRMS and SPMS, T2* within cortical lesions (ICL and LCL) was higher than NACGM T2* and than control cortex T2*. aStatistical significance (p value) of T2* difference between lesional and NACGM within each MS group, by paired t test. bStatistical significance (p value) of T2* difference between lesional cortex from patients with MS and cortex from controls, by linear regression including age and cortical thickness as nuisance factor. All p values are corrected for multiple comparisons using false discovery rate. ICL = intracortical lesion(s); LCL = leukocortical lesion(s); MS = multiple sclerosis; NACGM = normal-appearing cortical gray matter; RRMS = relapsing-remitting multiple sclerosis; SPMS = secondary progressive multiple sclerosis.
NACGM T2* in patients with MS (34 ± 2.4 ms) was not different from mean cortical T2* (33.03 ± 1.6 ms) in controls. When looking at subgroups, in patients with SPMS only, mean NACGM T2* was higher than mean cortical T2* in controls, and than mean NACGM T2* in RRMS (figure 2).
Extent of ICL and LCL pathology toward perilesional cortex.
Figure 3A displays a visual example of geodesic contours surrounding an ICL mask projected on the cortical surface in a patient with RRMS.
Figure 3. T2* in cortical lesions and perilesional cortex.

(A) Example of the geodesic distance contour surrounding lesional cortex overlaid on the left hemisphere cortical surface of a patient with RRMS. Binary mask of ICL was projected on the cortical surface, providing a 2-dimensional ICL mask (in red). Perilesional vertices were identified using their geodesic distance from the lesions, each value (1–20) being assigned a different color for visualization purposes. Each cortical lesion mask was analyzed as a whole for each participant, implying that there was no ambiguity when calculating the geodesic distance to lesions that were close to each other as figured in this example. (B) Boxplots of T2* relaxation time (ms) as a function of the geodesic distance from the lesions in all patients with MS, patients with RRMS, and patients with SPMS. T2* is expressed relative to its baseline value in each participant (see methods section). Boxplots in red indicate that there is a difference between mean T2* of the given geodesic distance and mean T2* far from the lesions (geodesic distance of 20) for the specified group of participants. ***p < 0.001, **p < 0.01, *p < 0.05. ICL = intracortical lesion(s); MS = multiple sclerosis; RRMS = relapsing-remitting multiple sclerosis; SPMS = secondary progressive multiple sclerosis.
In the entire MS cohort, T2* relaxation time was maximum within ICL and LCL (geodesic distance of 0). It remained longer compared with distant perilesional cortex (geodesic distance of 20) up to a geodesic distance of 4 for ICL and 10 for LCL (figure 3B). The actual physical distance between 2 vertices depends on the curvature of the surface. For reference, mean intervertex distance across the whole cortical surface in our population was 0.85 mm (±0.02 SD).
T2* relaxation time surrounding ICL did not differ between RRMS and SPMS, as T2* was still higher up to the same geodesic distance for both groups. However, T2* surrounding LCL decreased closer to lesions in the RRMS group compared with the SPMS group.
DISCUSSION
We used quantitative T2* MRI at 7T in RRMS and SPMS to characterize spatial and intrinsic tissue characteristics of visible focal CL and NACGM.
ICL, as opposed to LCL, had a preferential pattern of distribution in frontal and parietal lobe, including precuneus, temporal and cingulate cortex, as reported post mortem.19 A previous in vivo study based on 3T double inversion recovery (DIR) scans on RRMS and primary progressive MS found that CL were preferentially distributed in the frontal lobe, mainly in motor cortex, in the temporal lobe, and anterior cingulate cortex.20 The authors, however, highlighted that the resolution of their scans did not allow accurate distinction of purely ICL from LCL and juxtacortical lesions. Using ultra-high-resolution scans at 7T (voxel size approximately 0.11 mm3) to localize CL according to their location across the cortical width, we found that LCL were more randomly distributed than ICL and were mainly localized in frontal and parietal cortex.
The differential distribution pattern between ICL and LCL may reflect, at least in part, different pathogenetic mechanisms underlying ICL and LCL development. Some neuropathologic studies observed that CL, particularly subpial lesions originating from outer cortical layers (defined here as ICL), were located close to foci of meningeal inflammation,21–23 which suggests that subpial demyelination may be triggered by soluble inflammatory factors originating from the meninges. Lack of association between the 2 processes, however, has also been reported.24 LCL extend across cortex and WM, and it could be speculated that both inflammatory processes occurring in the meninges and in underlying normal-appearing WM (NAWM) could be at the origin of LCL formation. This could translate into a more widespread distribution pattern, as observed in our cohort. Very little is known about the origin of purely (type II) ICL. Independently from the triggering events that lead to ICL and LCL development, which are still unknown, it is also possible that differences in distribution patterns between CL subtypes underlie different susceptibilities to pathology and/or to remyelination across cortical laminae.9
The striking preferential distribution of ICL, and to a lesser extent of LCL, in cortical sulci was observed in some neuropathologic examinations of MS brains.25 We previously found in patients at different stages of MS diffuse cortical damage as measured by longer T2* and mainly involving cortical sulci. However, the ratio of areas displaying abnormal T2* in sulci relative to gyri ranged from 1 to 2, while in this study, the ratio of focal ICL area belonging to sulci relative to gyri was greater than 5. This emphasizes that focal CL themselves may only partly explain the diffuse cortical abnormalities observed in MS.
Although SPMS cases had higher number and volume of CL than RRMS cases, the degree of tissue pathology within CL, as evidenced by longer T2*, was similar throughout MS stages for both lesion subtypes. In contrast, NACGM was diffusively pathologic in SPMS only, although tissue abnormalities occurred in NACGM surrounding focal ICL and LCL in both relapsing-remitting and secondary progressive disease stages. A previous work found global NACGM abnormalities in RRMS, as evidenced by increase in diffusion tensor imaging fractional anisotropy, which correlated with disability.26 The suboptimal detection of subpial lesions by 3T DIR imaging compared with 7T GRE T2* scans, and the different biological substrates underlying T2* and diffusion metrics abnormalities in the cortex could, at least in part, explain discrepancies between our and previous DIR findings.
Previous imaging studies reported abnormalities surrounding WM lesions, tapering away from lesions toward the NAWM,27,28 but diffuse NAWM pathology has also been observed independently of focal WM lesions, particularly in progressive MS.29 We used a surface-based approach to compute quantitative T2* in the cortex as a function of distance from the lesions, using the vertex geometry of the cortical surface in each participant. This method, compared to 3D volume-based approaches, has the advantage of taking into account the circumvolved nature of the cortex, minimizing partial volume effects. We found a gradient of T2*, decreasing from the CL border toward NACGM. Of note, this gradient was larger for LCL than ICL, mainly in SPMS, suggesting that SPMS LCL tend to have a broader destructive pathology surrounding lesions. These findings also suggest that the laminar pathology previously observed throughout stages of MS8 might be an expression of a more diffuse degenerative process in chronic disease as evidenced postmortem.7,30 In RRMS, the lack of significant diffuse T2* changes in global NACGM and perilesional cortex (with the exception of cortex in close CL proximity) suggests that cortical pathology mainly resides within focal CL. Since neuropathologic studies tend to skew tissue samples toward late-stage MS, knowledge of cortical pathology in earlier stages is limited and needs further investigation.
In our study, patients with RRMS and SPMS, while matched for age, differed in disease duration because patients with SPMS were younger at disease onset. A previous neuropathologic study22 found that SPMS cases exhibiting aggressive cortical pathology associated with meningeal inflammation had younger age at disease onset compared with SPMS cases with milder cortical disease. Evidence of meningeal inflammation in MS, however, is still debated. Future studies combining our methods and recent developments to image leptomeningeal inflammation, including postcontrast FLAIR MRI,31 could help to unravel in vivo the link between meningeal inflammation and different CL subtypes.
Overall, our findings show that cortical demyelination expands beyond focal CL in MS, in close proximity to the lesional compartment in RRMS, and more diffusely, far from lesions, in SPMS. Even if ultra-high-resolution 7T MRI was used for detecting CL, it is possible that the determination of CL borders was not as accurate as in ex vivo assessments, and that some CL were missed at visual inspection of scans. Nevertheless, our data suggest that quantitative measures of global cortical integrity outside visible CL could be a potential biomarker of disease severity and progression in MS. Since it has been observed that the pathologic substrates underlying MRI changes in NAWM vary based on the distance from WM lesions,32 further studies could also determine whether NACGM T2* abnormalities observed in our cohort reflect different pathologic processes based on distance from lesions.
Supplementary Material
GLOSSARY
- CL
cortical lesion(s)
- DIR
double inversion recovery
- EDSS
Expanded Disability Status Scale
- FLASH
fast low-angle shot
- GM
gray matter
- GRE
gradient echo
- ICL
intracortical lesion(s)
- LCL
leukocortical lesion(s)
- MEMPR
magnetization-prepared rapid acquisition with multiple gradient echoes
- MS
multiple sclerosis
- NACGM
normal-appearing cortical gray matter
- NAWM
normal-appearing white matter
- RRMS
relapsing-remitting multiple sclerosis
- SPMS
secondary progressive multiple sclerosis
- TA
acquisition time
- TE
echo time
- TR
repetition time
- WM
white matter
Footnotes
Supplemental data at Neurology.org
AUTHOR CONTRIBUTIONS
C. Louapre has contributed to acquisition of data, analysis or interpretation of the data, statistical analysis, and drafting/revising the manuscript for content. S.T.G. has contributed to acquisition of data and analysis or interpretation of the data. C.G. has contributed to acquisition of data and analysis or interpretation of the data. C. Langkammer has contributed to analysis or interpretation of the data and drafting/revising the manuscript for content. J.A.S. has contributed to study concept or design and analysis or interpretation of the data. R.P.K. has contributed to study concept or design, analysis or interpretation of the data, and drafting/revising the manuscript for content. C.M. has contributed to study concept or design, acquisition of data, analysis or interpretation of the data, and drafting/revising the manuscript for content.
STUDY FUNDING
This work was supported by grants from the National MS Society (NMSS 4281-RG-A1 and NMSS RG 4729A2/1), the Claflin Award, and partly by NIH R01NS078322-01-A1, US Army W81XWH-13-1-0122, Shared Instrumentation Grant 1S10RR023043, and National Center for Research Resources (NCRR P41-RR14075).
DISCLOSURE
C. Louapre was supported by a fellowship from ARSEP. S. Govindarajan reports no disclosures relevant to the manuscript. C. Giannì was supported by FISM training fellowship 2012/B/4. C. Langkammer and J. Sloane report no disclosures relevant to the manuscript. R. Kinkel reports personal fees from Genzyme, a Sanofi corp., Biogen Idec, Novartis, and grants from Accelerated Cure Project, outside the present work. C. Mainero reports no disclosures relevant to the manuscript. Go to Neurology.org for full disclosures.
REFERENCES
- 1.Calabrese M, Poretto V, Favaretto A, et al. Cortical lesion load associates with progression of disability in multiple sclerosis. Brain 2012;135:2952–2961. [DOI] [PubMed] [Google Scholar]
- 2.Nielsen AS, Kinkel RP, Madigan N, Tinelli E, Benner T, Mainero C. Contribution of cortical lesion subtypes at 7T MRI to physical and cognitive performance in MS. Neurology 2013;81:641–649. [DOI] [PMC free article] [PubMed] [Google Scholar]
- 3.Roosendaal SD, Moraal B, Pouwels PJ, et al. Accumulation of cortical lesions in MS: relation with cognitive impairment. Mult Scler 2009;15:708–714. [DOI] [PubMed] [Google Scholar]
- 4.Mainero C, Benner T, Radding A, et al. In vivo imaging of cortical pathology in multiple sclerosis using ultra-high field MRI. Neurology 2009;73:941–948. [DOI] [PMC free article] [PubMed] [Google Scholar]
- 5.Pitt D, Boster A, Pei W, et al. Imaging cortical lesions in multiple sclerosis with ultra-high-field magnetic resonance imaging. Arch Neurol 2010;67:812–818. [DOI] [PubMed] [Google Scholar]
- 6.Yao B, Hametner S, van Gelderen P, et al. 7 Tesla magnetic resonance imaging to detect cortical pathology in multiple sclerosis. PLoS One 2014;9:e108863. [DOI] [PMC free article] [PubMed] [Google Scholar]
- 7.Seewann A, Vrenken H, Kooi EJ, et al. Imaging the tip of the iceberg: visualization of cortical lesions in multiple sclerosis. Mult Scler 2011;17:1202–1210. [DOI] [PubMed] [Google Scholar]
- 8.Mainero C, Louapre C, Govindarajan ST, et al. A gradient in cortical pathology in multiple sclerosis by in vivo quantitative 7 T imaging. Brain 2015;138:932–945. [DOI] [PMC free article] [PubMed] [Google Scholar]
- 9.Chang A, Staugaitis SM, Dutta R, et al. Cortical remyelination: a new target for repair therapies in multiple sclerosis. Ann Neurol 2012;72:918–926. [DOI] [PMC free article] [PubMed] [Google Scholar]
- 10.Polman CH, Reingold SC, Banwell B, et al. Diagnostic criteria for multiple sclerosis: 2010 revisions to the McDonald criteria. Ann Neurol 2011;69:292–302. [DOI] [PMC free article] [PubMed] [Google Scholar]
- 11.Bo L, Vedeler CA, Nyland HI, Trapp BD, Mork SJ. Subpial demyelination in the cerebral cortex of multiple sclerosis patients. J Neuropathol Exp Neurol 2003;62:723–732. [DOI] [PubMed] [Google Scholar]
- 12.Kurtzke JF. Rating neurologic impairment in multiple sclerosis: an Expanded Disability Status Scale (EDSS). Neurology 1983;33:1444–1452. [DOI] [PubMed] [Google Scholar]
- 13.Roxburgh RH, Seaman SR, Masterman T, et al. Multiple Sclerosis Severity Score: using disability and disease duration to rate disease severity. Neurology 2005;64:1144–1151. [DOI] [PubMed] [Google Scholar]
- 14.Dale AM, Fischl B, Sereno MI. Cortical surface-based analysis: I: segmentation and surface reconstruction. Neuroimage 1999;9:179–194. [DOI] [PubMed] [Google Scholar]
- 15.Fischl B, Dale AM. Measuring the thickness of the human cerebral cortex from magnetic resonance images. Proc Natl Acad Sci USA 2000;97:11050–11055. [DOI] [PMC free article] [PubMed] [Google Scholar]
- 16.Cohen-Adad J, Polimeni JR, Helmer KG, et al. T(2)* mapping and B(0) orientation-dependence at 7 T reveal cyto- and myeloarchitecture organization of the human cortex. Neuroimage 2012;60:1006–1014. [DOI] [PMC free article] [PubMed] [Google Scholar]
- 17.Govindarajan ST, Cohen-Adad J, Sormani MP, Fan AP, Louapre C, Mainero C. Reproducibility of T2* mapping in the human cerebral cortex in vivo at 7 tesla MRI. J Magn Reson Imaging 2015;42:290–296. [DOI] [PMC free article] [PubMed] [Google Scholar]
- 18.Greve DN, Fischl B. Accurate and robust brain image alignment using boundary-based registration. Neuroimage 2009;48:63–72. [DOI] [PMC free article] [PubMed] [Google Scholar]
- 19.Kutzelnigg A, Lassmann H. Cortical demyelination in multiple sclerosis: a substrate for cognitive deficits? J Neurol Sci 2006;245:123–126. [DOI] [PubMed] [Google Scholar]
- 20.Calabrese M, Battaglini M, Giorgio A, et al. Imaging distribution and frequency of cortical lesions in patients with multiple sclerosis. Neurology 2010;75:1234–1240. [DOI] [PubMed] [Google Scholar]
- 21.Lucchinetti CF, Popescu BF, Bunyan RF, et al. Inflammatory cortical demyelination in early multiple sclerosis. N Engl J Med 2011;365:2188–2197. [DOI] [PMC free article] [PubMed] [Google Scholar]
- 22.Magliozzi R, Howell O, Vora A, et al. Meningeal B-cell follicles in secondary progressive multiple sclerosis associate with early onset of disease and severe cortical pathology. Brain 2007;130:1089–1104. [DOI] [PubMed] [Google Scholar]
- 23.Magliozzi R, Howell OW, Reeves C, et al. A gradient of neuronal loss and meningeal inflammation in multiple sclerosis. Ann Neurol 2010;68:477–493. [DOI] [PubMed] [Google Scholar]
- 24.Kooi EJ, Geurts JJ, van Horssen J, Bo L, van der Valk P. Meningeal inflammation is not associated with cortical demyelination in chronic multiple sclerosis. J Neuropathol Exp Neurol 2009;68:1021–1028. [DOI] [PubMed] [Google Scholar]
- 25.Howell OW, Reeves CA, Nicholas R, et al. Meningeal inflammation is widespread and linked to cortical pathology in multiple sclerosis. Brain 2011;134:2755–2771. [DOI] [PubMed] [Google Scholar]
- 26.Calabrese M, Rinaldi F, Seppi D, et al. Cortical diffusion-tensor imaging abnormalities in multiple sclerosis: a 3-year longitudinal study. Radiology 2011;261:891–898. [DOI] [PubMed] [Google Scholar]
- 27.Vrenken H, Geurts JJ, Knol DL, et al. Normal-appearing white matter changes vary with distance to lesions in multiple sclerosis. AJNR Am J Neuroradiol 2006;27:2005–2011. [PMC free article] [PubMed] [Google Scholar]
- 28.Zhang Y, Moore GR, Laule C, et al. Pathological correlates of magnetic resonance imaging texture heterogeneity in multiple sclerosis. Ann Neurol 2013;74:91–99. [DOI] [PubMed] [Google Scholar]
- 29.Kutzelnigg A, Lucchinetti CF, Stadelmann C, et al. Cortical demyelination and diffuse white matter injury in multiple sclerosis. Brain 2005;128:2705–2712. [DOI] [PubMed] [Google Scholar]
- 30.Klaver R, Popescu V, Voorn P, et al. Neuronal and axonal loss in normal-appearing gray matter and subpial lesions in multiple sclerosis. J Neuropathol Exp Neurol 2015;74:453–458. [DOI] [PubMed] [Google Scholar]
- 31.Absinta M, Vuolo L, Rao A, et al. Gadolinium-based MRI characterization of leptomeningeal inflammation in multiple sclerosis. Neurology 2015;85:18–28. [DOI] [PMC free article] [PubMed] [Google Scholar]
- 32.Moll NM, Rietsch AM, Thomas S, et al. Multiple sclerosis normal-appearing white matter: pathology-imaging correlations. Ann Neurol 2011;70:764–773. [DOI] [PMC free article] [PubMed] [Google Scholar]
Associated Data
This section collects any data citations, data availability statements, or supplementary materials included in this article.