

Abstract
Objective:
To understand the neuropsychological basis of dementia risk among persons in the spectrum including cognitive normality and mild cognitive impairment.
Methods:
We quantitated risk of progression to dementia in elderly persons without dementia from 2 population-based studies, the Framingham Heart Study (FHS) and Mayo Clinic Study of Aging (MCSA), aged 70 to 89 years at enrollment. Baseline cognitive status was defined by performance in 4 domains derived from batteries of neuropsychological tests (that were similar but not identical for FHS and MCSA) at cut scores corresponding to SDs of ≤−0.5, −1, −1.5, and −2 from normative means. Participants were characterized as having no cognitive impairment (reference group), or single or multiple amnestic or nonamnestic profiles at each cut score. Incident dementia over the following 6 years was determined by consensus committee at each study separately.
Results:
The pattern of hazard ratios for incident dementia, rates of incident dementia and positive predictive values across cognitive test cut scores, and number of affected domains was similar although not identical across the FHS and MCSA. Dementia risks were higher for amnestic profiles than for nonamnestic profiles, and for multidomain compared with single-domain profiles.
Conclusions:
Cognitive domain subtypes, defined by neuropsychologically derived cut scores and number of low-performing domains, differ substantially in prognosis in a conceptually logical manner that was consistent between FHS and MCSA. Neuropsychological characterization of elderly persons without dementia provides valuable information about prognosis. The heterogeneity of risk of dementia cannot be captured concisely with one test or a single definition or cutpoint.
The wide variation in cognitive function in aging, both in levels of performance and rates of change over time, forces clinicians and lay people to focus on categorical descriptions. Labels such as cognitively normal, mild cognitive impairment (MCI), and dementia are applied as if they were discrete entities, but it is accepted that these terms represent demarcations of convenience along the continuum of cognition. MCI occupies a central location in the spectrum of cognitive aging, and its use as a diagnostic term has been criticized because of the heterogeneity of its prognosis.1–18 There are many reasons for the wide range of dementia risk in persons designated as MCI, but perhaps the most important one is that cognitive functioning that falls between the designations of “typical cognitive aging” and “definitely demented” is remarkably diverse. Changes in memory, attention, executive, language, and visuospatial domains, as well as the magnitude of those changes, have distinct implications for prognosis. The existing studies suggested to us that the diversity of affected domains and cutpoints, rather than a weakness, had an underappreciated logic to it for predicting future risk of dementia. We used the Framingham Heart Study (FHS) and Mayo Clinic Study of Aging (MCSA) to address issues of thresholds and subtypes of cognitive impairment based on neuropsychological testing for predicting the subsequent development of dementia. By using 2 large, independent, population-based elderly cohorts with extensive longitudinal observations, we were able to study risk of future dementia across a range of performance that included individuals whose clinical diagnoses ranged from normal to MCI.
METHODS
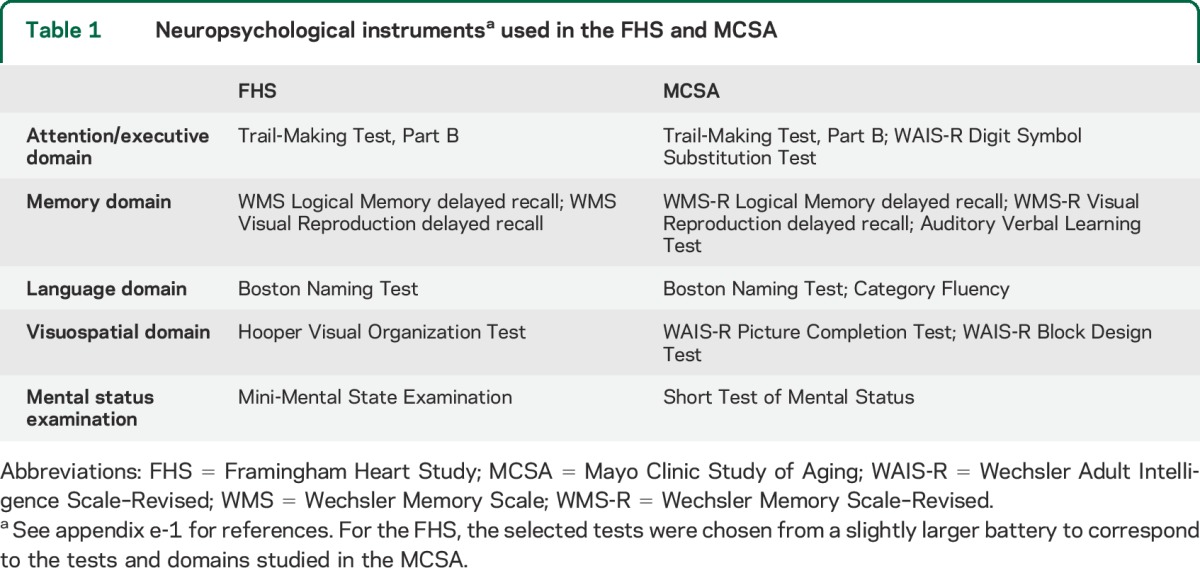
The FHS and MCSA are both longitudinal, population-based studies of cognitive aging including MCI. A detailed description of the participants and study methodologies from the 2 studies is contained in appendix e-1 on the Neurology® Web site at Neurology.org. The analyses described here include dementia-free FHS participants who underwent neuropsychological testing between 1999 and 2005 and the initial dementia-free MCSA cohort who underwent neuropsychological testing between 2004 and 2006. The neuropsychological test batteries of the MCSA19 and the FHS20 were similar but not identical, and are shown in table 1. To match the MCSA, the FHS cohort was limited to those between the ages of 70 and 89 years at baseline. A Clinical Dementia Rating21 was also completed at each site. Consensus diagnoses of cognitive normality, MCI, and dementia were determined by the teams at each site. For the current analyses, only those persons dementia-free at baseline were considered for analysis. For both FHS and MCSA, the DSM-IV criteria for dementia22 and the Key Symposium Working Group on Mild Cognitive Impairment criteria for MCI23,24 were used.
Table 1.
Neuropsychological instrumentsa used in the FHS and MCSA
In both studies, regular, periodic follow-up occurred, every 2 to 4 years in FHS and every 15 months in MCSA. At each subsequent visit, participants were examined clinically and neuropsychologically. In the FHS, neurologic and neuropsychological assessments could be triggered at and between visits by history from the informants, including at periodic health status updates and ancillary study visits, through ongoing surveillance of participant medical records or a low score on a screening mental status examination; such “flagged” participants subsequently had annual neurologic and neuropsychological assessments. In the MCSA, all participants underwent clinical and neuropsychological assessments at each follow-up visit. The diagnostic status of each participant was reviewed after each follow-up visit by the consensus committee of each site. Prior diagnoses remain blinded for the MCSA consensus committee, whereas in FHS, the consensus committee members were aware of prior diagnoses. In the MCSA, the date of diagnosis of dementia was the midpoint between the visit at which the dementia diagnosis was made and the prior visit, whereas in FHS, a date of onset of dementia was determined based on all available information and was allowed to be at any time between consecutive FHS assessments. The primary outcome measure in the present analyses was dementia by DSM-IV criteria as determined by consensus committee.
The ability to perform the same outcome analyses in FHS and MCSA was not preplanned at the initiation of either study, but rather, was made possible by the generally similar methodologies that the 2 studies had independently adopted. The studies had sufficiently different designs so that combining the data from the 2 studies was deemed less informative than presenting analyses of them in parallel.
Standard protocol approvals and patient consents.
Both study protocols were approved by the respective institutional review boards, either Mayo and Olmsted Medical Center for the MCSA, or Boston University Medical Center for the FHS. All participants at both sites provided signed informed consent.
Analyses.
The primary analyses of progression to incident dementia were conducted in MCSA and FHS participants who were dementia-free (cognitively normal or MCI) by consensus diagnosis at baseline. The primary predictors in our analyses were the 4 cognitive domain scores generated from the neuropsychological tests (table 1) administered at the baseline visit. The 4 cognitive domains were attention/executive, memory, visuospatial, and language. For each individual test, scores were normalized within each cohort using the baseline dementia-free participants with complete neuropsychological test score data (n = 1,598 for MCSA and n = 773 for FHS). We transformed scores from tests where the distributions were skewed: Trail Making Test, Part B, for both FHS and MCSA, and Boston Naming Test and Hooper Visual Organization in FHS. A z score was generated for each test, and that z score, or the average of the z scores for tests within each cognitive domain (rescaled to a mean of 0 and an SD of 1), represented the domain z score for each participant. A global z score was also constructed for descriptive purposes; it was created in the same manner as the individual domain scores.
Although MCI is the diagnostic term for the starting point of these analyses, our inclusion of persons who were considered cognitively normal meant that our study group was more inclusive. Thus, instead of using “cognitive impairment” to describe a profile of cognitive performance, we will avoid the word “impairment” and instead refer to cognitive profiles. In the current analyses, neuropsychologically defined low cognitive performance was defined in the same manner in both cohorts by the z score in each of the 4 cognitive domains for each participant. Cut scores of ≤−0.5, −1, −1.5, and −2, corresponding to SDs from the normative mean based on the study-specific baseline values, were evaluated. In addition to evaluating each cognitive domain separately, we also created an amnestic profile group based on scores below cutpoints in the memory domain without (single domain) or with low scores in other domains (multidomain), and a nonamnestic profile of low performance group based on low scores in one (single domain) or more nonmemory domains (multidomain), and without low scores in the memory domain.
We did not examine more severe z score cutpoints because most individuals who were in that range, and indeed some in the <−2.0 cutpoint range, would have been classified with dementia at baseline and therefore excluded from the current analytic datasets.
We defined FHS- or MCSA-specific common reference groups as those individuals whose z scores were >−0.5 for all domains. This reference group corresponded to a cognitively normal group, although it was defined differently than the consensus normal group.
We calculated incidence rates for dementia based on baseline cognitive performance groupings. We also calculated hazard ratios (HRs) and 95% confidence intervals (CIs) using Cox proportional hazards models with age as the time scale. We report HRs that were not adjusted for sex or education. Additional analyses showed that sex and education adjustment had a negligible effect on the results; equating the number of tests per domain between FHS and MCSA also had little effect. Positive predictive values (PPVs) were also calculated using data obtained up to 45 months after baseline evaluations for both cohorts. We selected the 45 months point to maximize the number of participants available for analysis.
RESULTS
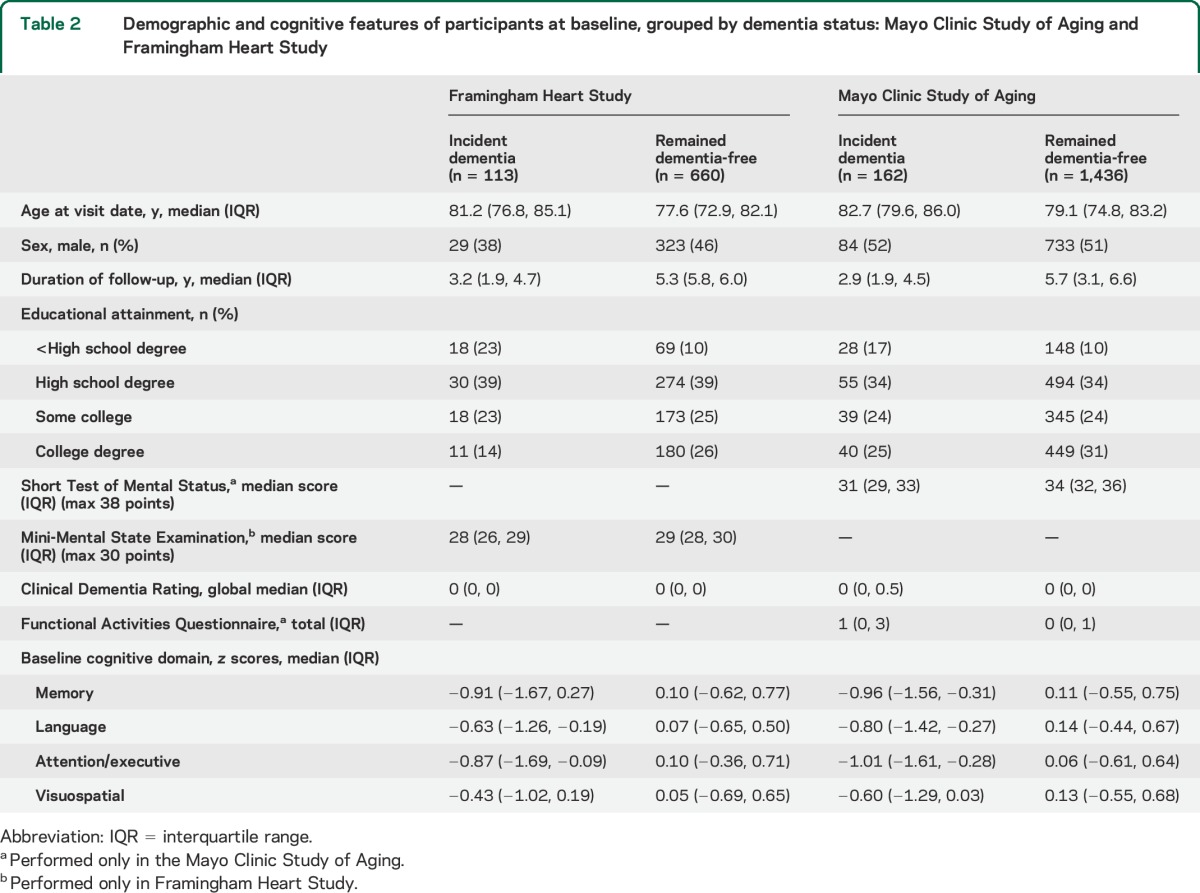
The 2 cohorts are described in table 2. By design, the age range of both was 70 to 89 years. The MCSA cohort included 1,969 initially dementia-free individuals, of whom 1,598 were in the analytic cohort because they had at least one follow-up assessment as well as information on all 4 domain scores. The FHS cohort included 915 participants, of whom 142 were excluded because of incomplete follow-up or missing neuropsychological data, leaving 773 in the analytic cohort. To match to the MCSA, the duration of follow-up in FHS was truncated to 6 years. Both cohorts demonstrated a narrow range of the Clinical Dementia Rating and brief mental status examination scores (Mini-Mental State Examination in FHS and the Short Test of Mental Status in MCSA). The overall rate of incident dementia was slightly higher in the FHS (19.7, 95% CI 15.3–24.1, per 1,000 person-years) compared with the MCSA (15.9, 95% CI 12.9–19.5, per 1,000 person-years).
Table 2.
Demographic and cognitive features of participants at baseline, grouped by dementia status: Mayo Clinic Study of Aging and Framingham Heart Study
The percentages of participants who were within the different scoring ranges using a global z score were very similar across the cut scores for FHS and MCSA: ≤−0.5 (59% and 54%), −1.0 (35% and 35%), −1.5 (18% and 19%), and −2.0 (9% and 8%). Table e-1 shows the composition of different subtypes at the −1.5 cut score.
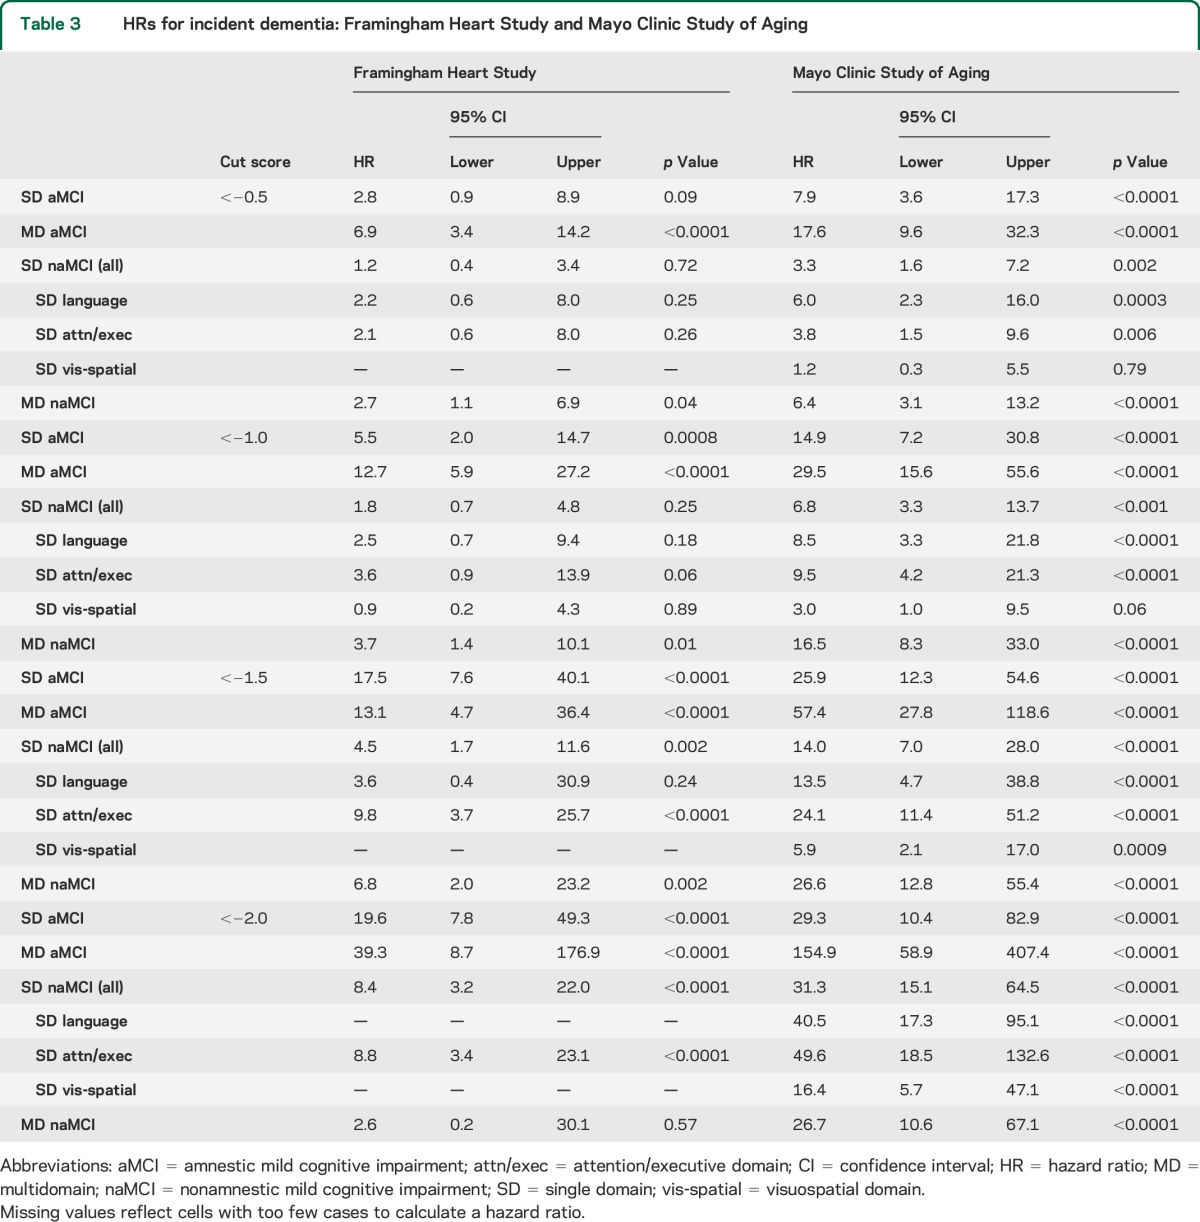
Table 3 gives the HRs for incident dementia from Cox proportional hazards modeling for each cohort. The pattern of HRs across domain-specific subtypes and across different cut scores was similar but not identical between the 2 studies. HRs in the MCSA were systematically higher than those of the FHS, which corresponds to the difference in dementia incidence rates (per 1,000 person-years) in the reference groups of the FHS (6.4, 95% CI 2.2–10.5) vs MCSA (2.8, 95% CI 1.5–5.3). HRs at the most stringent cutpoint should be viewed with caution because many individuals with scores worse than that cut score were considered to have prevalent dementia at baseline.
Table 3.
HRs for incident dementia: Framingham Heart Study and Mayo Clinic Study of Aging
The pattern of dementia incidence rates was also similar between FHS and MCSA (table 4). For example, at a cut score of −1.0 or −1.5, the highest incidence rates occurred with the amnestic multidomain profile (between 50.4 and 148.6 per 1,000 person-years) while much lower rates were seen with a single-domain nonamnestic (visuospatial and language) profile (between 3.4 and 32.2 per 1,000 person-years). The multidomain, nonamnestic profile of domain scores showed values in between. PPVs for incident dementia at 45 months post baseline (figure) were also similar across the 2 cohorts. Numbers of participants in each diagnostic group and numbers of participants with incident dementia are given in table e-2. The numbers of persons with some definitions of low cognition at baseline or incident dementia were very small, even with the overall large sample sizes of FHS and MCSA, thus accounting for wide CIs of some estimates.
Table 4.
Rates of incident dementia (per 1,000 person-years): Framingham Heart Study and Mayo Clinic Study of Aging
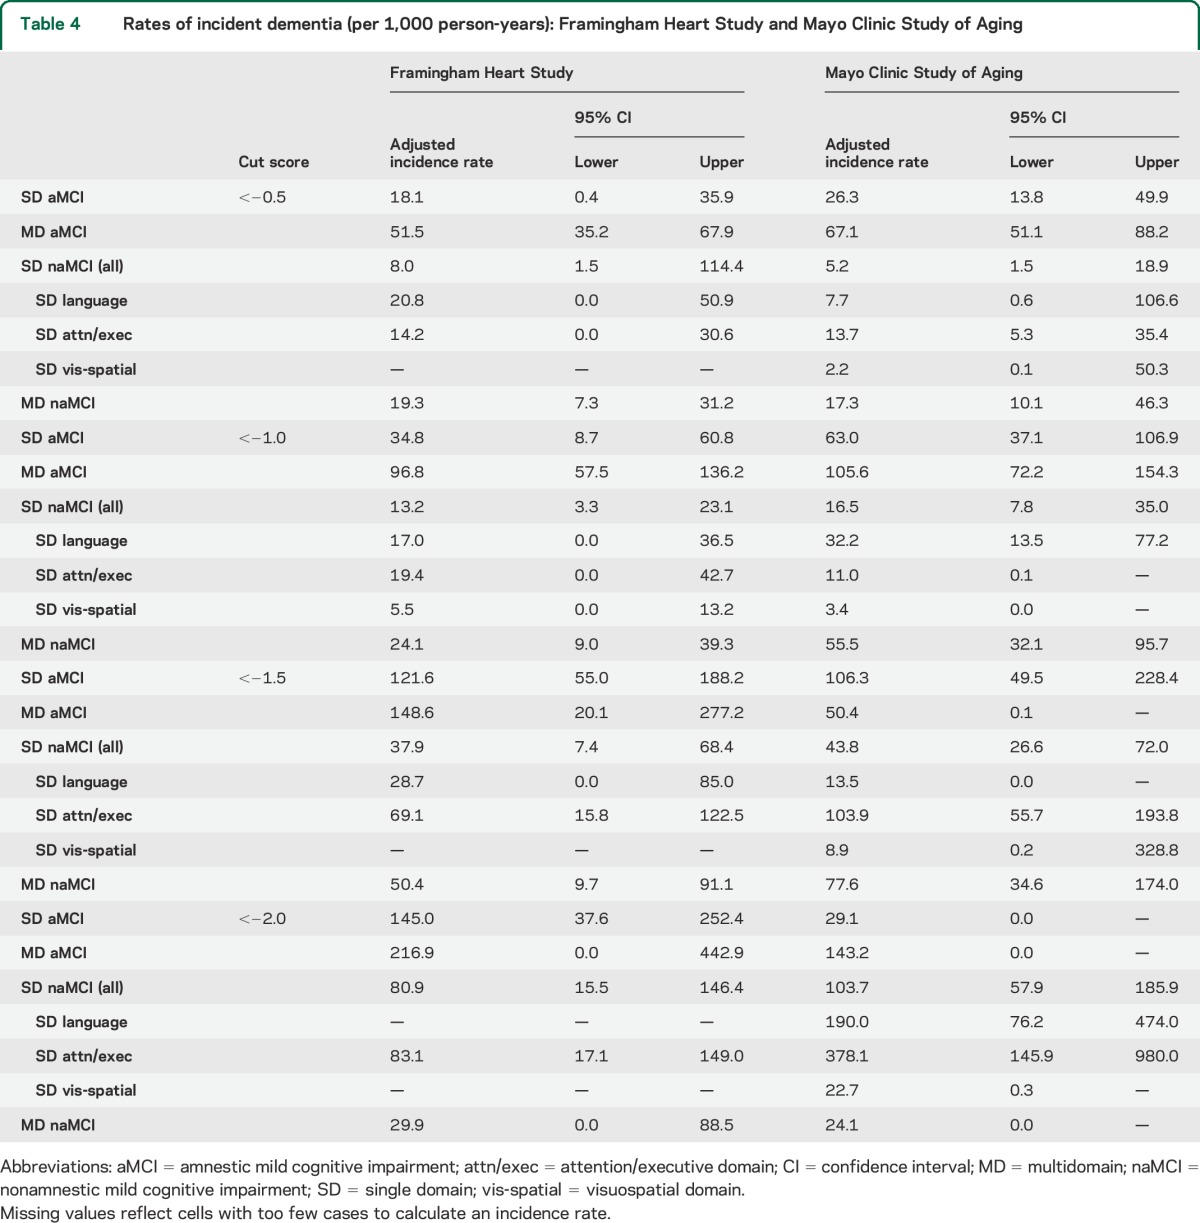
Figure. PPVs for incident dementia at 45 months post baseline.

PPVs (in percent) for incident dementia at 45 months post baseline for FHS (red bars) and MCSA (blue bars). PPVs are shown for amnestic MCI (A) and nonamnestic MCI (B) SD (lighter color) and MD (darker color) at the cutpoints of −0.5, −1.0, −1.5, and −2.0. FHS = Framingham Heart Study; MCI = mild cognitive impairment; MCSA = Mayo Clinic Study of Aging; MD = multidomain; PPV = positive predictive value; SD = single domain.
There are several generalizations that can be made based on common patterns of dementia risk in FHS and MCSA participants. HRs and rates of incident dementia generally increased with more stringent cut scores. Amnestic profiles had higher HRs than nonamnestic. Multidomain low score profiles had higher HRs than single domain. Within any cut score level, the lowest rates of incident dementia occurred with the single-domain nonamnestic profile in the visuospatial domain. The single-domain nonamnestic profile in the executive domain generally had a comparable prognosis to the single-domain amnestic profile. The highest HRs, incidence rates, and PPVs occurred with multidomain amnestic profiles. For example, the multidomain amnestic pattern at a cut score of <−1.5 had a PPV for incident dementia by 45 months of 65% in the MCSA and 46% in the FHS. In contrast, a single-domain amnestic profile at a cut score of <−1.0 had a PPV of only 25% for the MCSA and 14% for the FHS. The single-domain nonamnestic profile at a cut score of <−1.0 had even lower PPVs of 5% in FHS and 17% in MCSA (see the figure).
DISCUSSION
Our evaluation of different formulations of cognitive profiles among individuals without dementia in 2 independent cohorts demonstrated the same heterogeneity of prevalences and dementia outcomes as observed in prior studies of more narrowly defined MCI.1–9,14,18,25 We eliminated 2 other common sources of variation in MCI outcomes26 by utilizing elderly cohorts that had been recruited randomly from defined geographical regions. We assert that the breadth and depth of low cognitive performance across different neuropsychologically defined domains ordered the risk for future dementia in a rational and biologically meaningful way. Involvement of multiple cognitive domains implies more widespread cerebral abnormalities, which in turn would be expected to more often produce progression of cognitive decline over time. Single-domain involvement, in general, represents more circumscribed dysfunction, and should have a more favorable prognosis. Amnestic involvement, reflecting the dominant role of Alzheimer disease (AD) and its typical anatomical predilection for the medial temporal lobe,27 carried a worse prognosis than nonamnestic involvement. Nevertheless, among those with particularly low performance in nonamnestic domains, future dementia was a considerable risk. These clinical-anatomical-prognostic associations are not novel, but they are obscured when overly simplistic definitions of MCI are used.
The similarity of the pattern of HRs, rates of incident dementia, and PPV at 45 months between MCSA and FHS across amnestic and nonamnestic MCI and across different cut scores suggests that the estimates and ordering of risk may be generalizable to elderly, middle-class North American populations with average educational attainment. The similar results are particularly gratifying since the FHS and MCSA neuropsychological test batteries were not identical and there were other differences in how participants were diagnosed and followed, and how time to onset of dementia was calculated between the 2 studies as described in the methods section.
Neuropsychological characterization by the use of multiple tests in different domains is superior to a single brief instrument that allows MCI to be diagnosed only as “present vs absent.” However, traditional pencil and paper neuropsychological assessments are impractical for many reasons, including cost and lack of access to neuropsychological assessment skills in many settings. Moreover, some cautions are needed in using neuropsychological profiles. The use of deviation from normative means as a way of defining cognitive performance guarantees that a certain fraction of the population being studied will be classified as abnormal. Our data show that the approach provides meaningful assessment of risk when applied to an elderly population. However, in individuals younger than 65 years who have a 10-fold-lower rate of incident dementia than individuals aged 80 years,28,29 a cut score of z < −1.0 or z < −1.5 would have a far lower PPV. Second, because of the emphasis on amnestic domain deficits, nonamnestic domains are sometimes grouped together. Because there may be multiple nonamnestic domains (3 in the current analyses), the number of individuals labeled as having nonamnestic cognitive impairment will invariably be larger than those labeled amnestic. Nonamnestic MCI involving the executive domain was the most informative nonamnestic type, emphasizing that impairments in the nonamnestic domains themselves have divergent outcomes.
Our domain-based approach utilizes a widely accepted model of cognitive function in the dementia spectrum that is used in recent diagnostic criteria.30,31 The domains of memory, attention/executive, language, and visuospatial cognition also have established clinical–anatomical correlations that are widely accepted and understood.32 However, while some form of a continuous function involving neuropsychological test scores avoids assumptions about relationships between tests and domains, results of latent profile33 or cluster34,35 analyses identify similar cognitive constructs to the ones we used. We acknowledge that alternative ways of defining cognitive domains might be able to demonstrate the same wide variation in risk of future dementia in a more efficient manner, but the point of this exercise was to demonstrate that the risk of future dementia is logically related to the depth and breadth of cognitive functioning in individuals without dementia.
The popularly used cutoff score for MCI of −1.5 SD below the mean represents a reasonable compromise for making the categorical diagnosis of MCI clinically meaningful. There will never be a perfect set of cut scores; the heterogeneity of the range between cognitive normality and dementia ensures that any cut score, including this one, will have imperfect precision.
Our analyses differ from most prior reports on MCI because we included individuals who were diagnosed clinically as cognitively normal, in order to explore the full range of cognitive performance in the nondementia spectrum. Our results should also make clear that there is an equal amount of heterogeneity in outcomes within the categorical diagnosis of cognitive normality. This reality is embodied in the criteria for preclinical AD that acknowledges there are persons considered cognitively normal who score lower than their peers and therefore are at higher risk of experiencing cognitive decline.36 Consistent with that view, even when a neuropsychological domain cut score of <−0.5 was used, there was increased risk of incident dementia. To be sure, the incidence rates at cut scores of <−0.5 were very low, but at least for amnestic multidomain patterns, the HRs were significant.
Neuropsychological test score cutpoints are important and central to identifying dementia-free persons who are at risk of cognitive decline. There are other features that are also relevant that we were not able to consider in our analyses. The role of biomarkers in determining risk of progression in MCI is being actively explored,37,38 but biomarkers relate to etiology, and our focus here was on the cognitive spectrum. Because cognitive performance is an intrinsic component of dementia, and because biomarkers share variance with cognitive performance, it is not surprising that cognitive outcomes are often more powerful than biomarkers when they are entered into the same prediction models.39 We could have explored the interaction between cognition and functional impairment,17 but it was not feasible for several reasons. We lacked a common instrument between FHS and MCSA, and furthermore, our focus was on the role of domain-specific cognitive impairment. We also could have included the role of subjective cognitive complaints,40 but all of these additional features would have detracted from our focus on neuropsychological characterization.
A limitation of our analyses was the censoring of individuals diagnosed with prevalent dementia at baseline. The impact of the censoring by dementia was reflected in the smaller than expected number of participants with scores at the z < −2.0 level. The distinction between MCI and dementia is based on degree of impairment in activities of daily living,30,41 but our observation of the high risk of incident dementia in persons with multidomain amnestic MCI at cut scores of <−1.5 demonstrates the inevitable continuity with dementia.
MCI as a segment of the spectrum of cognitive impairment short of dementia is a powerful construct permitting risk stratification in a variety of research contexts in individuals without dementia. Similar to the concept of “hypertension,” it is useful as a categorical label, but it should not obscure the continuous nature of the risk function. Risk of dementia does not begin and end at one cutpoint, and low cognitive performance has domain-specific risks that are logically related to the complex biology of AD and the other major diseases that cause late-life dementia.
Supplementary Material
ACKNOWLEDGMENT
The investigators of both studies thank the loyal participants and clinic staff members, whose efforts made these analyses possible.
GLOSSARY
- AD
Alzheimer disease
- CI
confidence interval
- DSM-IV
Diagnostic and Statistical Manual of Mental Disorders (Fourth Edition)
- FHS
Framingham Heart Study
- MCI
mild cognitive impairment
- MCSA
Mayo Clinic Study of Aging
- PPV
positive predictive value
Footnotes
Editorial, page 1646
Supplemental data at Neurology.org
AUTHOR CONTRIBUTIONS
David S. Knopman: drafting/revising the manuscript, study concept or design, analysis or interpretation of data, accepts responsibility for conduct of research and will give final approval, acquisition of data. Alexa Beiser: drafting/revising the manuscript, analysis or interpretation of data, accepts responsibility for conduct of research and will give final approval, acquisition of data, statistical analysis. Mary M. Machulda: drafting/revising the manuscript, accepts responsibility for conduct of research and will give final approval, acquisition of data. Julie Fields: drafting/revising the manuscript, accepts responsibility for conduct of research and will give final approval. Rosebud O. Roberts: drafting/revising the manuscript, accepts responsibility for conduct of research and will give final approval, acquisition of data, obtaining funding. V. Shane Pankratz: drafting/revising the manuscript, analysis or interpretation of data, accepts responsibility for conduct of research and will give final approval, statistical analysis. Jeremiah Aakre: drafting/revising the manuscript, analysis or interpretation of data, accepts responsibility for conduct of research and will give final approval, statistical analysis. Ruth H. Cha: analysis or interpretation of data, accepts responsibility for conduct of research and will give final approval, statistical analysis. Walter A. Rocca: drafting/revising the manuscript, analysis or interpretation of data, accepts responsibility for conduct of research and will give final approval, statistical analysis. Michelle M. Mielke: drafting/revising the manuscript, analysis or interpretation of data, accepts responsibility for conduct of research and will give final approval. Bradley F. Boeve: drafting/revising the manuscript, analysis or interpretation of data, accepts responsibility for conduct of research and will give final approval. Sherral Devine: study concept or design, accepts responsibility for conduct of research and will give final approval, acquisition of data, study supervision. Robert J. Ivnik: drafting/revising the manuscript, analysis or interpretation of data, accepts responsibility for conduct of research and will give final approval, acquisition of data, study supervision. Rhoda Au: drafting/revising the manuscript, accepts responsibility for conduct of research and will give final approval, acquisition of data, study supervision, obtaining funding. Sanford Auerbach: drafting/revising the manuscript, accepts responsibility for conduct of research and will give final approval, acquisition of data. Philip A. Wolf: study concept or design, accepts responsibility for conduct of research and will give final approval, study supervision, obtaining funding. Sudha Seshadri: drafting/revising the manuscript, study concept or design, analysis or interpretation of data, accepts responsibility for conduct of research and will give final approval, acquisition of data, study supervision, obtaining funding. Ronald C. Petersen: drafting/revising the manuscript, accepts responsibility for conduct of research and will give final approval, obtaining funding.
STUDY FUNDING
The Mayo Clinic Study of Aging was supported by NIH grants R01 AG 041851, U01 AG006786, and P50 AG016574, the Robert H. and Clarice Smith and Abigail Van Buren Alzheimer's Disease Research Program, and was made possible by the Rochester Epidemiology Project (AG034676). The Framingham Heart Study is supported by a contract from the NHLBI (N01-HC-25195) and by NIH grants NS17950, AG016495, and AG008122.
DISCLOSURE
D. Knopman served as deputy editor for Neurology®; serves on a data safety monitoring board for Lundbeck Pharmaceuticals and for the DIAN study; is an investigator in clinical trials sponsored by TauRx Pharmaceuticals, Lilly Pharmaceuticals, and the Alzheimer's Disease Cooperative Study; serves as a consultant to the Bluefield Project to Cure Frontotemporal Dementia; and receives research support from the NIH. A. Beiser receives research support from the NIH. M. Machulda receives research support from the NIH. J. Fields receives research support from the NIH. R. Roberts receives research support from the NIH, AbbVie Health Economics and Outcomes Research, and from the Driskill Foundation. V. Pankratz receives research support from the NIH. Jeremiah Aakre receives research support from the NIH. R. Cha reports no disclosures relevant to the manuscript. W. Rocca receives research support from the NIH. M. Mielke receives research support from the NIH and the Driskill Foundation. B. Boeve receives publishing royalties for The Behavioral Neurology of Dementia (Cambridge University Press, 2009) and research support from Cephalon, Inc., Allon Therapeutics, Inc., GE Healthcare, the NIH, and the Mangurian Foundation. S. Devine receives research support from the NIH. R. Ivnik serves on the editorial boards of The Clinical Neuropsychologist and Aging, Neuropsychology, and Cognition; receives publishing royalties for Clinical Interpretation of the WAIS-III and WMS-III (Academic Press, 2003); and research support from the NIH. R. Au receives research support from the NIH, Alzheimer's Association, and the National Parkinson Foundation. S. Auerbach receives research support from the NIH. P. Wolf receives research support from the NIH. S. Seshadri receives research support from the NIH. R. Petersen serves on data monitoring committees for Pfizer, Inc. and Janssen Alzheimer Immunotherapy, is a consultant for Roche, Inc., Merck, Inc., and Genentech, Inc., receives publishing royalties from Mild Cognitive Impairment (Oxford University Press, 2003), and receives research support from the NIH. Go to Neurology.org for full disclosures.
REFERENCES
- 1.Manly JJ, Tang MX, Schupf N, et al. Frequency and course of mild cognitive impairment in a multiethnic community. Ann Neurol 2008;63:494–506. [DOI] [PMC free article] [PubMed] [Google Scholar]
- 2.Busse A, Hensel A, Guhne U, Angermeyer MC, Riedel-Heller SG. Mild cognitive impairment: long-term course of four clinical subtypes. Neurology 2006;67:2176–2185. [DOI] [PubMed] [Google Scholar]
- 3.Lopez OL, Kuller LH, Becker JT, et al. Incidence of dementia in mild cognitive impairment in the Cardiovascular Health Study Cognition Study. Arch Neurol 2007;64:416–420. [DOI] [PubMed] [Google Scholar]
- 4.Lopez OL, Becker JT, Chang YF, et al. Incidence of mild cognitive impairment in the Pittsburgh Cardiovascular Health Study–Cognition Study. Neurology 2012;79:1599–1606. [DOI] [PMC free article] [PubMed] [Google Scholar]
- 5.Koepsell TD, Monsell SE. Reversion from mild cognitive impairment to normal or near-normal cognition: risk factors and prognosis. Neurology 2012;79:1591–1598. [DOI] [PMC free article] [PubMed] [Google Scholar]
- 6.Ganguli M, Snitz BE, Saxton JA, et al. Outcomes of mild cognitive impairment by definition: a population study. Arch Neurol 2011;68:761–767. [DOI] [PMC free article] [PubMed] [Google Scholar]
- 7.Fischer P, Jungwirth S, Zehetmayer S, et al. Conversion from subtypes of mild cognitive impairment to Alzheimer dementia. Neurology 2007;68:288–291. [DOI] [PubMed] [Google Scholar]
- 8.Saxton J, Snitz BE, Lopez OL, et al. Functional and cognitive criteria produce different rates of mild cognitive impairment and conversion to dementia. J Neurol Neurosurg Psychiatry 2009;80:737–743. [DOI] [PMC free article] [PubMed] [Google Scholar]
- 9.Ritchie LJ, Tuokko H. Clinical decision trees for predicting conversion from cognitive impairment no dementia (CIND) to dementia in a longitudinal population-based study. Arch Clin Neuropsychol 2011;26:16–25. [DOI] [PubMed] [Google Scholar]
- 10.Ravaglia G, Forti P, Montesi F, et al. Mild cognitive impairment: epidemiology and dementia risk in an elderly Italian population. J Am Geriatr Soc 2008;56:51–58. [DOI] [PubMed] [Google Scholar]
- 11.Plassman BL, Langa KM, Fisher GG, et al. Prevalence of cognitive impairment without dementia in the United States. Ann Intern Med 2008;148:427–434. [DOI] [PMC free article] [PubMed] [Google Scholar]
- 12.Solfrizzi V, Panza F, Colacicco AM, et al. Vascular risk factors, incidence of MCI, and rates of progression to dementia. Neurology 2004;63:1882–1891. [DOI] [PubMed] [Google Scholar]
- 13.Palmer K, Backman L, Winblad B, Fratiglioni L. Mild cognitive impairment in the general population: occurrence and progression to Alzheimer disease. Am J Geriatr Psychiatry 2008;16:603–611. [DOI] [PubMed] [Google Scholar]
- 14.Han JW, Kim TH, Lee SB, et al. Predictive validity and diagnostic stability of mild cognitive impairment subtypes. Alzheimers Dement 2012;8:553–559. [DOI] [PubMed] [Google Scholar]
- 15.Peters ME, Rosenberg PB, Steinberg M, et al. Neuropsychiatric symptoms as risk factors for progression from CIND to dementia: the Cache County Study. Am J Geriatr Psychiatry 2013;21:1116–1124. [DOI] [PMC free article] [PubMed] [Google Scholar]
- 16.Larrieu S, Letenneur L, Orgogozo JM, et al. Incidence and outcome of mild cognitive impairment in a population-based prospective cohort. Neurology 2002;59:1594–1599. [DOI] [PubMed] [Google Scholar]
- 17.Luck T, Luppa M, Wiese B, et al. Prediction of incident dementia: impact of impairment in instrumental activities of daily living and mild cognitive impairment—results from the German Study on Ageing, Cognition, and Dementia in Primary Care Patients. Am J Geriatr Psychiatry 2012;20:943–954. [DOI] [PubMed] [Google Scholar]
- 18.Di Carlo A, Lamassa M, Baldereschi M, et al. CIND and MCI in the Italian elderly: frequency, vascular risk factors, progression to dementia. Neurology 2007;68:1909–1916. [DOI] [PubMed] [Google Scholar]
- 19.Roberts RO, Geda YE, Knopman D, et al. The Mayo Clinic Study of Aging: design and sampling, participation, baseline measures and sample characteristics. Neuroepidemiology 2008;30:58–69. [DOI] [PMC free article] [PubMed] [Google Scholar]
- 20.Au R, Seshadri S, Wolf PA, et al. New norms for a new generation: cognitive performance in the Framingham offspring cohort. Exp Aging Res 2004;30:333–358. [DOI] [PubMed] [Google Scholar]
- 21.Morris JC. The Clinical Dementia Rating (CDR): current version and scoring rules. Neurology 1993;43:2412–2414. [DOI] [PubMed] [Google Scholar]
- 22.American Psychiatric Association. Diagnostic and Statistical Manual of Mental Disorders: DSM-IV. Washington, DC: American Psychiatric Association; 1994. [Google Scholar]
- 23.Winblad B, Palmer K, Kivipelto M, et al. Mild cognitive impairment: beyond controversies, towards a consensus: report of the International Working Group on Mild Cognitive Impairment. J Intern Med 2004;256:240–246. [DOI] [PubMed] [Google Scholar]
- 24.Petersen RC. Mild cognitive impairment as a diagnostic entity. J Intern Med 2004;256:183–194. [DOI] [PubMed] [Google Scholar]
- 25.Roberts RO, Knopman DS, Mielke MM, et al. Higher risk of progression to dementia in mild cognitive impairment cases who revert to normal. Neurology 2014;82:317–325. [DOI] [PMC free article] [PubMed] [Google Scholar]
- 26.Petersen RC, Caracciolo B, Brayne C, et al. Mild cognitive impairment: a concept in evolution. J Intern Med 2014;275:214–228. [DOI] [PMC free article] [PubMed] [Google Scholar]
- 27.Murray ME, Graff-Radford NR, Ross OA, et al. Neuropathologically defined subtypes of Alzheimer's disease with distinct clinical characteristics: a retrospective study. Lancet Neurol 2011;10:785–796. [DOI] [PMC free article] [PubMed] [Google Scholar]
- 28.Knopman DS, Petersen RC, Cha RH, Edland SD, Rocca WA. Incidence and causes of nondegenerative nonvascular dementia: a population-based study. Arch Neurol 2006;63:218–221. [DOI] [PubMed] [Google Scholar]
- 29.Bachman DL, Wolf PA, Linn RT, et al. Incidence of dementia and probable Alzheimer's disease in a general population: the Framingham Study. Neurology 1993;43:515–519. [DOI] [PubMed] [Google Scholar]
- 30.McKhann GM, Knopman DS, Chertkow H, et al. The diagnosis of dementia due to Alzheimer's disease: recommendations from the National Institute on Aging–Alzheimer's Association workgroups on diagnostic guidelines for Alzheimer's disease. Alzheimers Dement 2011;7:263–269. [DOI] [PMC free article] [PubMed] [Google Scholar]
- 31.American Psychiatric Association. Diagnostic and Statistical Manual of Mental Disorders: DSM-V. Washington, DC: American Psychiatric Association; 2013. [Google Scholar]
- 32.Weintraub S, Mesulam MM. Four neuropsychological profiles of dementia. In: Boller F, Grafman J, editors. Handbook of Neuropsychology. Amsterdam: Elsevier; 1993. [Google Scholar]
- 33.Kohler S, Hamel R, Sistermans N, et al. Progression to dementia in memory clinic patients without dementia: a latent profile analysis. Neurology 2013;81:1342–1349. [DOI] [PubMed] [Google Scholar]
- 34.Libon DJ, Xie SX, Eppig J, et al. The heterogeneity of mild cognitive impairment: a neuropsychological analysis. J Int Neuropsychol Soc 2010;16:84–93. [DOI] [PubMed] [Google Scholar]
- 35.Bondi MW, Edmonds EC, Jak AJ, et al. Neuropsychological criteria for mild cognitive impairment improves diagnostic precision, biomarker associations, and progression rates. J Alzheimers Dis 2014;42:275–289. [DOI] [PMC free article] [PubMed] [Google Scholar]
- 36.Sperling RA, Aisen P, Beckett L, et al. Toward defining the preclinical stage of Alzheimer's disease: recommendations from the National Institute on Aging–Alzheimer's Association workgroups on diagnostic guidelines for Alzheimer's disease. Alzheimers Dement 2011;7:280–292. [DOI] [PMC free article] [PubMed] [Google Scholar]
- 37.Petersen RC, Aisen P, Boeve BF, et al. Mild cognitive impairment due to Alzheimer's disease: criteria in the community. Ann Neurol 2013;74:199–208. [DOI] [PMC free article] [PubMed] [Google Scholar]
- 38.Prestia A, Caroli A, van der Flier WM, et al. Prediction of dementia in MCI patients based on core diagnostic markers for Alzheimer disease. Neurology 2013;80:1048–1056. [DOI] [PubMed] [Google Scholar]
- 39.Gomar JJ, Conejero-Goldberg C, Davies P, Goldberg TE. Extension and refinement of the predictive value of different classes of markers in ADNI: four-year follow-up data. Alzheimers Dement 2014;10:704–712. [DOI] [PMC free article] [PubMed] [Google Scholar]
- 40.Amariglio RE, Townsend MK, Grodstein F, Sperling RA, Rentz DM. Specific subjective memory complaints in older persons may indicate poor cognitive function. J Am Geriatr Soc 2011;59:1612–1617. [DOI] [PMC free article] [PubMed] [Google Scholar]
- 41.Albert M, DeKosky ST, Dickson D, et al. The diagnosis of mild cognitive impairment due to Alzheimer's disease: report of the National Institute on Aging–Alzheimer's Association workgroups on diagnostic guidelines for Alzheimer's disease. Alzheimers Dement 2011;7:270–279. [DOI] [PMC free article] [PubMed] [Google Scholar]
Associated Data
This section collects any data citations, data availability statements, or supplementary materials included in this article.