Significance
The correct interplay between mitochondria and nuclear functions is essential to generate the mature functional six-layered structure of the mammalian cerebral cortex. Thus, alteration in this interaction results in pathological conditions such as cancer or neurodevelopmental disorders. The molecules and signaling mechanisms responsible for the nucleus–mitochondria communication and functional coordination are still largely unknown. The here-reported nuclear and mitochondrial localization of Forkhead box g1 (Foxg1), a transcription factor essential for brain development and cerebral cortex layering, provides insights on the molecular mechanisms through which Foxg1 acts as a link among mitochondrial function, neuronal differentiation, and pathological conditions.
Keywords: Rett syndrome, autism, cancer, brain cortex, development
Abstract
Forkhead box g1 (Foxg1) is a nuclear-cytosolic transcription factor essential for the forebrain development and involved in neurodevelopmental and cancer pathologies. Despite the importance of this protein, little is known about the modalities by which it exerts such a large number of cellular functions. Here we show that a fraction of Foxg1 is localized within the mitochondria in cell lines, primary neuronal or glial cell cultures, and in the mouse cortex. Import of Foxg1 in isolated mitochondria appears to be membrane potential-dependent. Amino acids (aa) 277–302 were identified as critical for mitochondrial localization. Overexpression of full-length Foxg1 enhanced mitochondrial membrane potential (ΔΨm) and promoted mitochondrial fission and mitosis. Conversely, overexpression of the C-term Foxg1 (aa 272–481), which is selectively localized in the mitochondrial matrix, enhanced organelle fusion and promoted the early phase of neuronal differentiation. These findings suggest that the different subcellular localizations of Foxg1 control the machinery that brings about cell differentiation, replication, and bioenergetics, possibly linking mitochondrial functions to embryonic development and pathological conditions.
Forkhead box g1 (Foxg1; formerly known as BF-1, qin, Chicken Brain Factor 1, or XBF-1 and renamed Foxg1 for mouse, FOXG1 for human, and FoxG1 for other chordates) (1) is an evolutionary conserved transcription factor belonging to the forkhead box family, named after the first member, forkhead, discovered in Drosophila (2). In vertebrates, Foxg1 is essential for the development of telencephalon, cell migration, and cerebral cortex patterning and layering (3, 4). During early phases of cortical development, Foxg1 controls the rate of neurogenesis by keeping progenitor cells in a proliferative state and by inhibiting their differentiation into neurons (5). Its action is also necessary for the correct formation of the inner ear, the olfactory system (6, 7), and the proper axonal growth in the developing retina (8). A further functional role of Foxg1 concerns its capability to inhibit cell death in rat cerebellar culture primed to undergo apoptosis, whereas suppression of Foxg1 expression induces apoptosis in healthy neurons (9).
The intracellular localization of Foxg1 is controlled posttranslationally (10), and it alternates between the nucleus and the cytoplasm. Specifically, Foxg1 is confined predominantly in the nucleus in areas of active neurogenesis of the developing mouse brain, whereas cytoplasmic localization correlates with early neuronal differentiation areas (10). In the nucleus, Foxg1 operates as a transcriptional repressor; the targets identified include FGFs (fibroblast growth factors), Shh (sonic hedgehog homolog), and cell-cycle inhibitors such as p21Cip1 (11). In the cytoplasm, Foxg1 works as a TGF-β inhibitor by binding to Smad3 (mothers against decapentaplegic homolog 3) (12).
Deregulation or mutations of FOXG1 have been identified in several important human diseases, including different types of cancer (11, 13, 14), neurodevelopmental disorders such as Rett syndrome (RS) (15, 16), and other autism spectrum disorders (17).
Notwithstanding the key role of Foxg1 in maintaining the correct balance among cell replication, differentiation, and apoptosis, the mechanisms coordinating these fundamental events are largely unknown.
In the present study we demonstrate, in isolated mitochondria, cell lines, primary cell cultures, and mouse cortical extracts, that a fraction of Foxg1 localizes in the mitochondrial matrix and that a unique domain located between amino acids (aa) 277 and 302 is responsible for its mitochondrial targeting. We demonstrate that full-length, mitochondrial, and cytosolic forms of Foxg1 affect cell growth, differentiation, and mitochondrial functions.
Mitochondria control fundamental processes in neuro development and neuroplasticity, including the differentiation of neurons, the growth of axons and dendrites, and the formation and reorganization of synapse (18, 19). Our findings reveal a previously unknown mitochondrial localization and function of Foxg1, suggesting this transcription factor may represent a key link among mitochondrial function, neuronal differentiation, and potentially, important pathological conditions such as RS and cancer.
Results
A Fraction of Endogenous Foxg1 Colocalizes with Mitochondria.
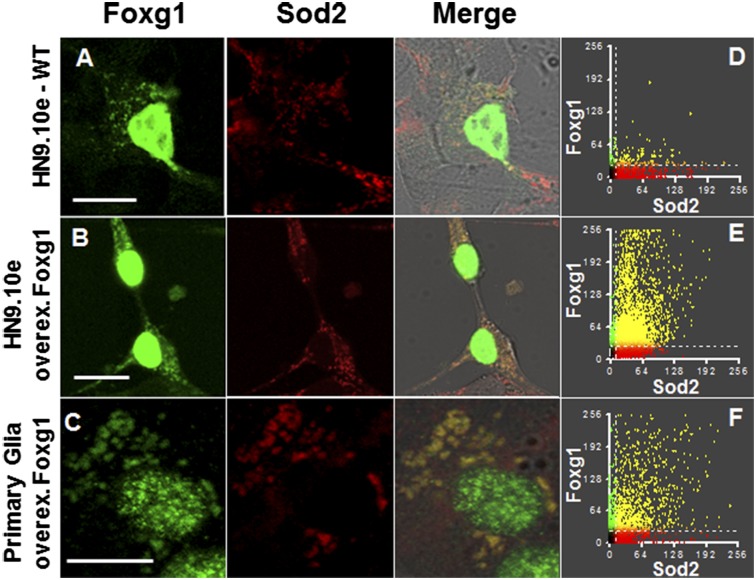
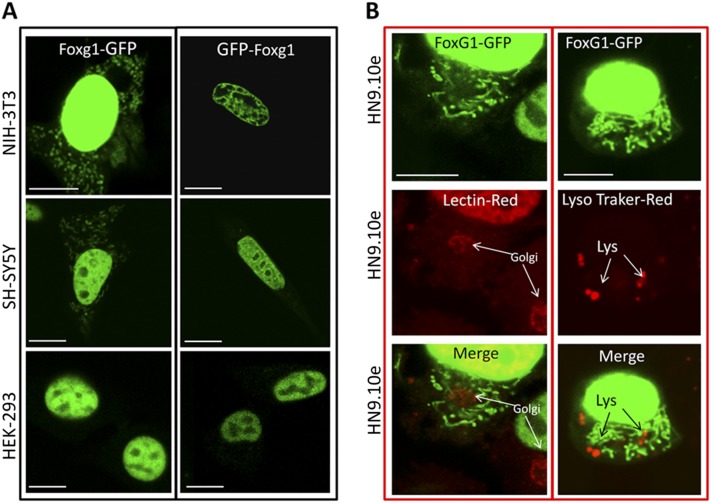
Fig. 1 shows that, using a highly specific anti-Foxg1 antibody (Ab), a discrete cytoplasmic granular staining can be observed in the hippocampal HN9.10e cell line and in primary glia. To characterize the localization of Foxg1, mitochondria, lysosomes, and Golgi apparatus were investigated by using Abs or specific markers (Fig. 1 and Fig. S1B). Double immunofluorescence labeling was performed with Abs directed against Foxg1 and the mitochondrial marker superoxide dismutase 2 (Sod2). Colocalization in HN9.10e cells was quantified using Manders’ coefficients (20). A partial but clear colocalization between endogenous Foxg1 and Sod2 was observed in HN9.10e cells (MFoxg1 = 61%; Fig.1 A and D) and primary glia (MFoxg1 = 38%). Conversely, neither lysosomes nor Golgi show any colocalization with Foxg1 (Fig. S1B). The nature of nonmitochondrial and nonnuclear Foxg1-positive regions is at present unclear, but most likely it is represented by cytoplasmatic Foxg1. To verify this unexpected mitochondrial localization of a double immunofluorescence with anti-Foxg1 and anti-Sod2, Abs was performed on both HN9.10e cells and primary glia overexpressing Foxg1. In these conditions (Fig. 1 B and C), although a majority of the protein is still localized in the nucleus, the specific Foxg1 mitochondrial signal is clearly enhanced both in HN9.10e (MFoxg1 = 80%; Fig.1E) and in primary glia (MFoxg1 = 79%; Fig. 1F).
Fig. 1.
Mitochondrial localization of Foxg1. Immunocytochemical istribution of Foxg1 and Sod2 in representative confocal images of HN9.10e cells and primary glia. (A) HN9.10e cells expressing endogenous Foxg1. (B) HN9.10e cells transfected with untagged Foxg1. (C) Glial cells transfected with untagged Foxg1. (D–F) 2D histograms and colocalization patterns of Foxg1 and Sod2 in control cells and in cells overexpressing Foxg1; green and red indicate areas containing, respectively, Foxg1 alone or Sod2 alone; yellow represents areas that concurrently express both proteins (the enhancement of the mitochondrial low fluorescence results in a oversaturation of the nuclear compartment). (Scale bar, 10 µm.)
Fig. S1.
Subcellular localization of transiently transfected Foxg1-GFP and GFP-Foxg1 in different cell lines. The pictures (A) indicate that only Foxg1-GFP localizes both in the nucleus and at mitochondria. It is worth noting that the GFP N-terminal fusion can inhibit the correct mitochondrial localization. The only exception was found in HEK293 cell line, where Foxg1-GFP does not present any mitochondrial localization, but only a nuclear localization. (Scale bar, 5 µm.) (B) Foxg1-GFP (green) does not overlap with lysosomes labeled with lysotracker (Red DND-99 molecular probe), nor with Golgi labeled with lectin (red).
Nuclear and Mitochondrial Localization of Foxg1-GFP.
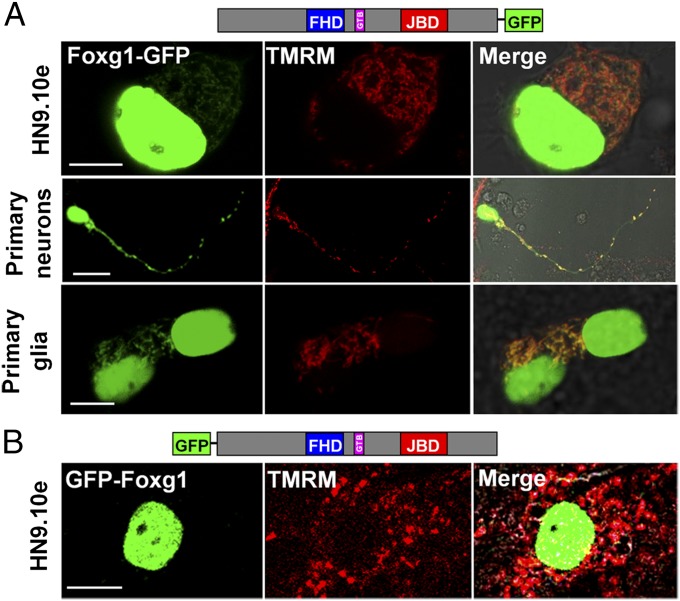
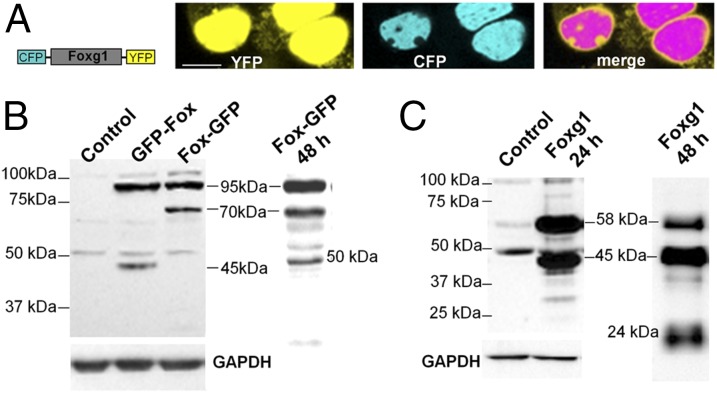
Foxg1 fused to GFP both at the N terminus (GFP-Foxg1) and at the C terminus (Foxg1-GFP) was transfected in cell lines and primary mouse cortical cultures (Fig. 2 and Fig. S1A). Foxg1-GFP localized both in the nucleus and in mitochondria (Fig. 2A); conversely, as already reported by different groups including us (16), GFP-Foxg1 showed an exclusive nuclear localization (Fig. 2B and Fig. S1A). We also fused Foxg1 with CFP and YFP at the N and C terminus, respectively. HN9.10e cells transfected with this construct (Fig. 3A) show the contemporary presence of CFP and YFP only in the nucleus; a proportion of cells (∼10%) show the presence of YFP, but not CFP, in mitochondria. These data suggest that a proteolytically cleaved form of the chimeric protein, with removal of the CFP-tagged N terminus, can interact with (or is imported into) mitochondria.
Fig. 2.
Foxg1-GFP and GFP-Foxg1 display different subcellular localizations. (A) Schematic representation of Foxg1-GFP and representative images of Foxg1-GFP-expressing cells loaded with TMRM. (B) Schematic representation of GFP-Foxg1 and representative images of GFP-Foxg1-expressing cells loaded with TMRM. Colocalization is indicated by yellow pixels in the merged images. (Scale bar, 5 µm.)
Fig. 3.
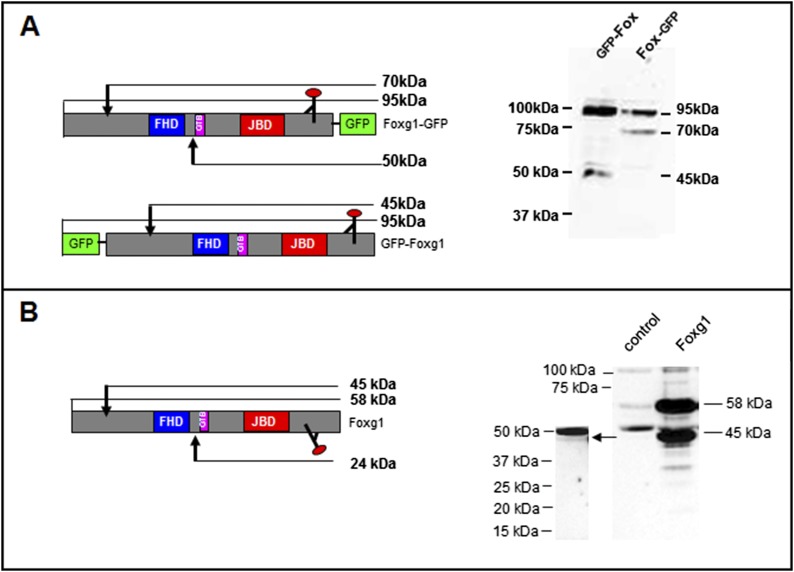
Imaging and WB assays on tagged and untagged Foxg1 overexpressing cells. (A) Schematic representation of CFP-Foxg1-YFP double-fusion protein and representative image of HN9.10e cells transiently transfected with the YFP-Foxg1-CFP construct. (Scale bar, 5 µm.) (B) WB assay on untransfected NIH 3T3 controls, GFP-Foxg1, and Foxg1-GFP overexpressing NIH 3T3 cells (whole lysate) processed 24 and 48 h after transfection; the filters were probed with an Ab against the Foxg1 C terminus. (C) WB assay on untransfected and untagged Foxg1-overexpressing NIH 3T3 cells (whole lysate) processed 24 and 48 h after transfection and probed with the same Ab as in B. See also Fig. S2 for schemes representing Foxg1 and its fluorescent fusion proteins.
To further confirm the hypothesis of a Foxg1 proteolytic cleavage, we performed Western blot (WB) experiments on NIH 3T3 cell line transiently expressing GFP-Foxg1 or Foxg1-GFP harvested 24 or 48 h after transfection and probed with Abs against Foxg1 C terminus (Fig. 3). Fig. 3B shows, both in the GFP-Foxg1- and in the Foxg1-GFP-expressing cells, a major immunoreactive band at ∼95 kDa, compatible with the expected molecular weight (MW) of the uncleaved fusion protein. In Foxg1-GFP-expressing cells, there is an additional strongly immunoreactive band of ∼70 kDa compatible with the removal of an N-terminal fragment of about 25 kDa. In GFP-Foxg1-expressing cells probed with anti-Foxg1, a strongly positive band of ∼45–50 kDa is labeled, compatible with the removal of a GFP-tagged N terminus fragment of ∼25 kDa (Fig. 3B and Fig. S2A). In controls and transfected cells, two additional weak bands are clearly visible with MW ∼58 and ∼50 kDa. The bands at 95 and 70 kDa from cells expressing Foxg1-GFP, and at ∼95 kDa from cells expressing GFP-Foxg1, when probed with an anti-GFP Ab, appeared positive for the tag. Of interest (Fig. 3B, right lane), when Foxg1-GFP-expressing cells were harvested 48 h after transfection, in addition to the 95- and 70-kDa bands, a new specific band of ∼45 kDa was labeled by anti-Foxg1 Ab.
Fig. S2.
Western blot assays on tagged and untagged Foxg1 overexpressing cells. (A) Western blot assay on untransfected NIH 3T3 cells (control) and GFP-Foxg1- and Foxg1-GFP-overexpressing cells (whole lysate) processed 24 h after transfection; the filters were probed with an Ab against the C terminus of Foxg1. Schemes represent GFP-Foxg1 and Foxg1-GFP fusion proteins, and arrows indicate the possible cleavage sites suggested by the immunoreactive bands MW; the approximate binding site of the Abs is drawn in the schemes. (B) Western blot assay on untransfected (control) and untagged Foxg1-overexpressing NIH 3T3 cells probed with an Ab against the C-terminal portion of Foxg1 (whole-cell lysate); on the left, overexposed filter highlights the presence of a 45-kDa band. The scheme represents untagged Foxg1, and the arrow points to a possible cleavage site suggested by the immunoreactive bands MW.
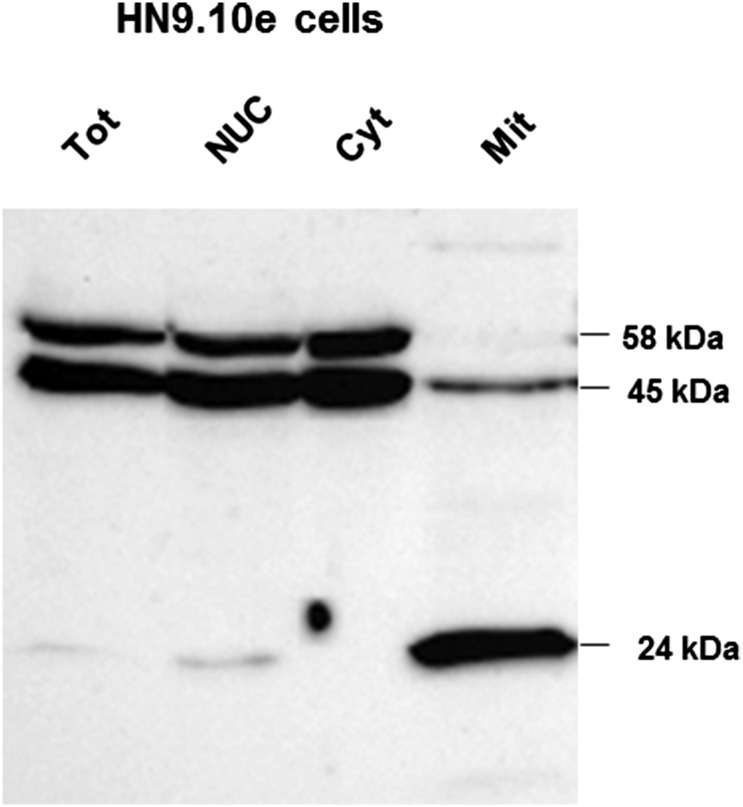
The question arises as to the possibility that this complex proteolytic processing could be an artifact of the Foxg1 fusion with GFP. Fig. 3C shows the results of WB performed with anti-Foxg1 on controls and cells overexpressing untagged Foxg1. Twenty-four hours after transfection, two main bands of ∼58 and ∼45 kDa are recognized in Foxg1-overexpressing cells, presumably corresponding to the ∼95- and ∼70-kDa bands of the GFP-tagged Foxg1-expressing cells. In controls, three bands were revealed by the anti Foxg1 Ab, with MW of ∼58, ∼50, and ∼45 kDa. The relative intensities of the three bands were significantly different in controls and Foxg1-overexpressing cells. In controls, the 58 kDa is weak, and the most abundant one is of ∼50 kDa; a ∼45-kDa band was revealed only when overexposing the gel (Fig. S2B). Forty-eight hours after transfection, in Foxg1-overexpressing cells, a ∼24-kDa band becomes evident (Fig. 3C), presumably corresponding to the ∼50-kDa band recognized in the lysate of cells expressing Foxg1-GFP (Fig. 3B). This band was never observed in control NIH 3T3 cells; however, it was clearly visible in untransfected HN9.10e cells (Fig. S3), as well as in the mitochondrial fraction from mouse brain (Fig. 4B).
Fig. S3.
Subcellular localization of Foxg1 in HN9 cells. Western blot analysis of HN9.10e cells subcellular fractions: total lysate (Tot), nuclear (Nuc), cytoplasmic (Cyt), mitochondrial (Mit). Similar to the cortex, three immunoreactive bands of 58, 45, and 24 kDa are recognizable. The blot was probed with Abcam 18529 antibody.
Fig. 4.
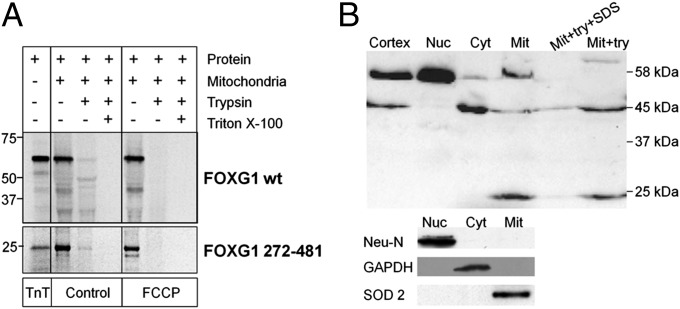
Mitochondrial import assay in isolated rat liver mitochondria and Foxg1 subcellular localization in mouse brain. (A) Import assay of in vitro synthesized full-length and aa 272–481 fragment of mouse Foxg1. Incubation of Foxg1 with isolated rat liver mitochondria in the absence (control) or presence of FCCP was followed by treatment with either trypsin or trypsin plus Triton X-100 and resolved in Bis-Tris SDS-PAGE. TnT reactions are also loaded as a control in each case (in FOXG1 272–481 the TnT lane contains a third of the amount incubated with mitochondria). (B) WB analysis of newborn mouse cortex subcellular fractions: total cortical lysate (Cortex), nuclei (Nuc), cytoplasm (Cyt), mitochondria (Mit), mitochondria treated with trypsin (mit+try), and mitochondria treated with trypsin and SDS (mit+try+SDS).
Comparison between controls and overexpressing cells reveals that in the latter case, the processing of the transfected Foxg1 is quantitatively different from that of their controls, but more similar to that observed in a neuronal cell line, HN9.10e, and in the mouse brain (i.e., cells and tissues in which the endogenous level of Foxg1 is much higher than in NIH 3T3 fibroblast line).
Foxg1 Mitochondrial Localization Domain.
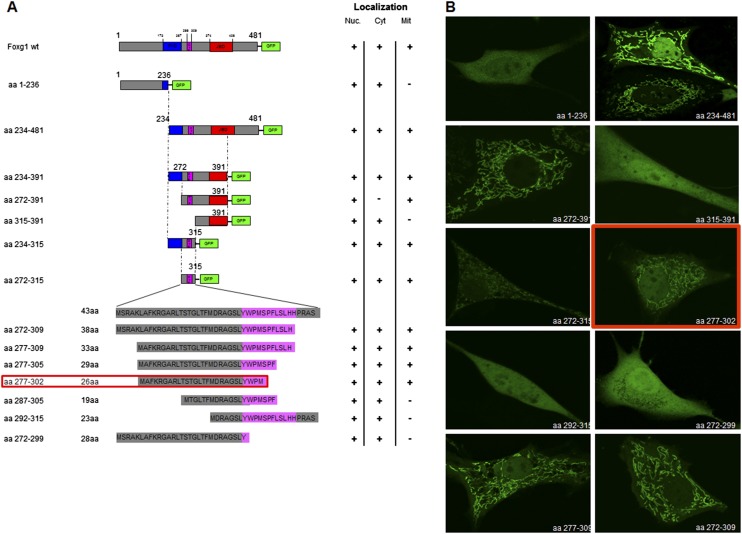
An in silico analysis of the protein sequence using the MitoProt II algorithm (https://ihg.gsf.de/ihg/mitoprot.html) predicted aa 264–313 to be a mitochondrial targeting sequence if located N terminally, with a probability of 96%. To test this prediction, and to identify the minimum domain sufficient for the Foxg1 mitochondrial localization, we generated several Foxg1 fusion proteins by progressive 5′ and 3′ deletions around aa 264–313, carrying GFP at the C terminus (Fig. S4A). The constructs were transfected in NIH 3T3 cells, and the ability of the resulting peptides to drive GFP to mitochondria was evaluated by confocal microscopy (Fig. S4B). These data indicate that aa 277–302 are essential for Foxg1 mitochondrial localization.
Fig. S4.
Looking for Foxg1 mitochondrial localization domain. (A) Schemes representing the constructs generated to unmask the critical aa for Foxg1 mitochondrial localization. The length of the shortest ones is shown on the bottom left; their GFP tag is omitted for clarity. The shortest construct able to drive GFP to mitochondria is boxed. (Right) Intracellular localization of each construct is summarized. (B) Examples of intracellular localization of some of the constructs schematized. FHD: Fork Head Domain (blue); GTB: GROUCHO/TLE-Binding domain (pink); JBD: JARID1B Binding Domain (red).
Import Assay of Foxg1 into Isolated Rat Liver Mitochondria.
Full-length Foxg1 and its 272–481 fragment, along with control localization proteins, were in vitro transcribed and translated in a rabbit reticulocyte lysate in the presence of [35S]methionine (TnT). The in vitro transcription resulted in the production of two predominant 35S-labeled polypeptides with the expected MW of 58 or 25 kDa from, respectively, the full-length Foxg1 and the 272–481 fragment (Fig. 4A). After incubation of the in vitro-produced protein with rat liver mitochondria for 60 min in the presence of succinate and ATP, a significant amount (23.6 ± 4.4%) of the total in vitro translated Foxg1 protein (whole lane signal) survived trypsin treatment. In particular, 5.4 ± 1.2% of the full-length Foxg1 protein survived the trypsin treatment (Fig. 4A, control). When mitochondria were pretreated with the uncoupler carbonyl cyanide-4-(trifluoromethoxy)phenylhydrazone (FCCP), no trypsin-resistant band was found (0.3 ± 0.1% for the whole lane; Fig.4A, FCCP).
Three additional bands (of about 49, 45, and 24 kDa) appear partially resistant to trypsin, but only in the absence of FCCP. Such bands represent 5.3 ± 0.9%, 7.5 ± 1.5%, and 6.4 ± 1.5% of the total in vitro translated Foxg1 protein, respectively. Incubation of the full-length protein with mitochondria also produced a band of ∼42 kDa, either in the presence or absence of FCCP; this 42-kDa band is sensitive to trypsin and may depend on proteolytic cleavage outside the mitochondria.
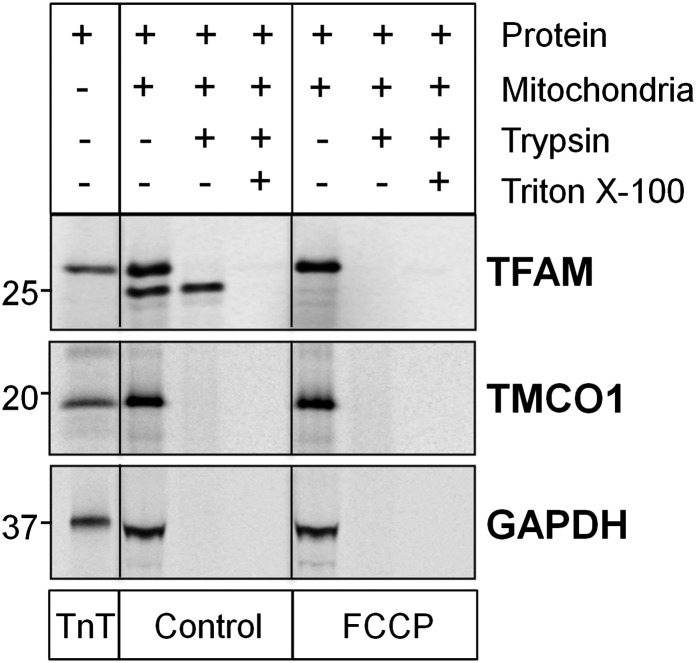
The import assays were performed in parallel with three control proteins; namely, the mitochondrial TFAM (mitochondrial transcription factor A), the nuclear TMCO1 (transmembrane and coiled-coil domains 1), and the cytoplasmic GAPDH (glyceraldehyde 3-phosphate dehydrogenase) (Fig. S5). Under the experimental conditions used, TFAM was very efficiently imported (71.2 ± 1.8% band signal resistant to trypsin), as expected, whereas no evidence for mitochondrial import was found for TMCO1 and GADPH (0.05 ± 0.01% appears trypsin-resistant).
Fig. S5.
Control markers for mitochondrial import assay in isolated rat liver mitochondria. Control proteins import assay of TFAM (mitochondrial), TMCO1 (nuclear), and GAPDH (cytoplasmic).
Regarding the 272–481 fragment (Fig. 4A), 4.4 ± 0.6% (of the total protein added) survived trypsin digestion, but only in the absence of FCCP (0.1 ± 0.1%, in its presence). As expected, no band was observed, in the absence or presence of the uncoupler, on lysis of mitochondria with Triton ×100.
In conclusion, the in vitro import assay indicates that mitochondria are able to import Foxg1 in a membrane potential-dependent process, with the generation of peptides with a MW lower than that of the full-length protein. A fraction of full-length Foxg1 also appears resistant to trypsin, suggesting the intact protein can be imported as such.
Foxg1 Localization in Isolated Mitochondria from Newborn Mouse Cortex.
To verify our findings in more physiological conditions, we investigated the protein localization in newborn (P1-2) mouse cortex. As indicated in Fig. 4B, the anti-Foxg1 Ab revealed, in the nuclear fraction, exclusively a 58-kDa band, and in the cytosolic fraction, predominantly a 45-kDa band and a small amount of the 58-kDa band. In the mitochondrial fraction, both the 58- and 45-kDa bands and a further 24-kDa band were exclusively visible in this fraction. Trypsin digestion of the mitochondrial fraction led to the complete degradation of the 58-kDa Foxg1 band, whereas the 45- and 24-kDa bands were resistant to the proteolytic degradation and only disappeared on mitochondrial lysis with SDS. This latter result suggests that both the 45- and 24-kDa truncated forms are inside the mitochondria. The purity of the subcellular fractions was controlled by stripping and reprobing the filter with Abs against Neu-N, Sod2, and GAPDH or tubulin.
Foxg1 Submitochondrial Localization in Living Cells.
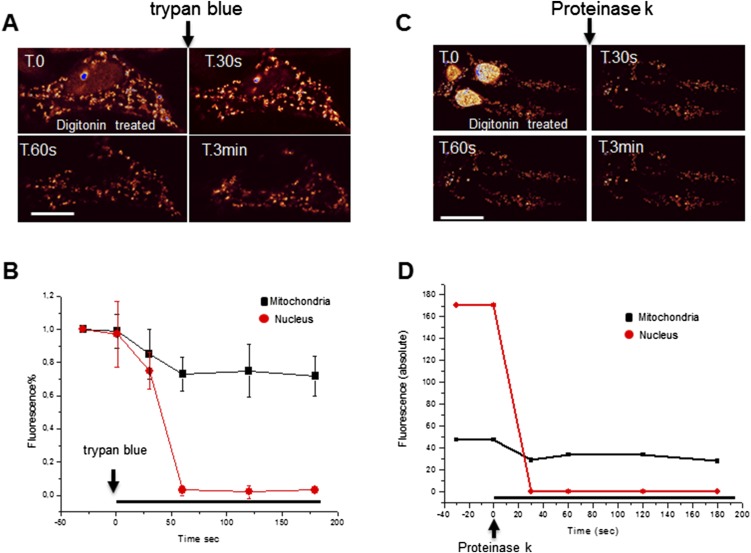
The mitochondrial localization of Foxg1 was further investigated in NIH 3T3 cells expressing Foxg1-GFP, using the approach described by Giacomello et al. (21) (Fig. S6 A and B). Transfected cells permeabilized with digitonin were treated with trypan blue, a strong fluorescence quencher able to cross the nuclear and the outer mitochondrial membrane (OMM), but not the inner one. Upon trypan blue addition, the GFP signal was rapidly and totally quenched in the nucleus, whereas only ∼30% of mitochondrial fluorescence decrease was observed; this demonstrates that a fraction of Foxg1-GFP is present either on the OMM or/and in the intermembrane space (∼30%), whereas the majority (∼70%) appears to be located in a trypan blue-inaccessible compartment (i.e., the matrix) (21). Consistent results were obtained using proteinase K, a nonspecific serine protease that can traverse nuclear pores but not the OMM (Fig. S6 C and D). Also, in this case, ∼30% of the mitochondrial signal was sensitive to the protease. These results, in agreement with the WB experiments on mitochondrial fractions, show that a fraction of Foxg1-GFP is imported into the mitochondrial matrix, whereas a small fraction is bound to the cytoplasmic surface of the OMM, and is thus sensitive to the protease or to trypan blue.
Fig. S6.
Submitochondrial localization of Foxg1-GFP in transfected living cells. (A) Representative time-lapse of a Foxg1-GFP overexpressing living NIH 3T3 cell permeabilized with digitonin and treated with trypan blue. (Scale bar, 5 µm.) These experiments are resumed in B (mean ± SE, n = 5 in three independent experiments). (C) Time-lapse of NIH 3T3 cells permeabilized with digitonin and treated with proteinase K. (D) Exemplificative time course of mitochondrial and nuclear GFP fluorescence in a permeabilized cell imaged in C.
Foxg1, Mitochondrial Shape, and Cellular Proliferation.
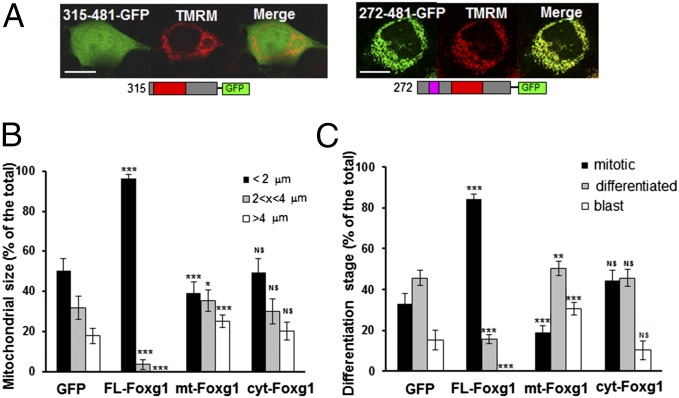
Mitochondrial morphology is critical for a number of cellular processes and depends on the dynamic balance between fusion and fission (22). HN9.10e cells were cotransfected with GFP and full-length Foxg1 (FL-Foxg1), Foxg1 272–481 (mt-Foxg1), or Foxg1 315–481 (cyt-Foxg1), a fragment missing the mitochondria-targeting sequence and displaying a diffused intracellular localization (Fig. 5A), and the mitochondrial morphology was evaluated. Mitochondria, as revealed by tetramethylrhodamine-methyl ester (TMRM) loading, were arbitrarily divided into three subclasses: shorter than 2 μm, between 2 and 4 μm, and longer than 4 μm. The overexpression of cyt-Foxg1 did not result in any significant change in mitochondrial morphology compared with controls, whereas the overexpression of FL-Foxg1 caused an increased number of mitochondria shorter than 2 μm and a reduction of mitochondria belonging to the second and the third class, respectively. In contrast, the overexpression of mt-Foxg1 induced a slight, but significant, increase in the proportion of mitochondria longer than 4 μm (Fig. 5B).
Fig. 5.
Cellular and mitochondrial morphology of HN9.10e cells overexpressing full-length and truncated Foxg1. (A) Exemplificative pictures of HN9.10e cells loaded with TMRM and expressing mt-Foxg1 (272–481) and cyt-Foxg1 (315–481) fused to GFP at their C terminus, and schematic representation of the constructs. (Scale bar, 5 µm.) (B) Distribution in three classes of length (<2 μm, 2–4 μm, or >4 μm) of mitochondria in HN9.10e cells transfected with either GFP alone or with GFP and untagged FL-Foxg1, mt-Foxg1 (272–481), or cyt-Foxg1 (315–481). (C) Percentages of mitotic cells, blasts, and early differentiating cells in HN9.10e transfected with either GFP alone or with GFP and untagged FL-Foxg1, mt-Foxg1 (272–481), or cyt-Foxg1 (315–481). T-test is referred to the GFP-transfected control sample. *P < 0.05, **P < 0.01, ***P < 0.001.
In parallel, the proliferative state of the same transfected cells was morphologically evaluated (23). HN9.10e cells are normally round-shaped, but respond to differentiation stimuli by emitting filopodia. This allowed us to divide transfected cells into three classes: mitotic cells (plasma membrane birefringence in transmitted light), blasts (round-shaped cells with epithelioid appearance), and cells with filopodia. Data presented in Fig. 5C indicate that the overexpression of cyt-Foxg1 did not cause significant changes in the distribution of cells between the three classes compared with controls. The overexpression of FL-Foxg1 enhanced the percentage of mitotic cells and reduced blasts and early differentiating cells. The expression of mt-Foxg1 had an opposite effect: a slight, but significant, increase in the proportion of early differentiating cells.
Foxg1, Mitochondrial Membrane Potential, and Cellular Respiration.
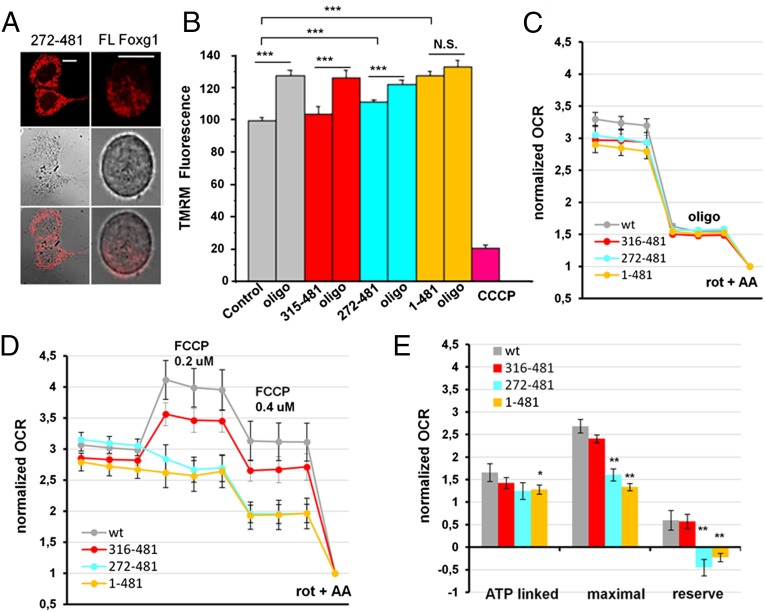
We next evaluated the effect of Foxg1 overexpression on mitochondrial TMRM accumulation. To this end, HN9.10e cells were cotransfected with GFP and FL-Foxg1, mt-Foxg1 (272–481), or cyt-Foxg1 (315–481), and were finally loaded with TMRM (Fig. 6A). As shown in Fig. 6B, TMRM accumulation was enhanced by overexpression of FL-Foxg1, whereas that of mt-Foxg1 caused only a minor increase, and cyt-Foxg1 had no effect. Addition of the mitochondrial ATPase inhibitor oligomycin increased TMRM accumulation, as expected. However, although the drug increased TMRM fluorescence by ∼20% in controls, cyt-Foxg1, and mt-Foxg1, it hardly changed this parameter in FL-Foxg1 overexpressing cells.
Fig. 6.
Mitochondrial membrane potential and cellular respiration in Foxg1-transfected HN9.10e cells. (A) Exemplificative pictures of untagged FL-Foxg1-expressing and mt-Foxg1-expressing (272–481) HN9.10e cells, loaded with TMRM. (Scale bar, 5 µm.) (B) TMRM fluorescence changes upon oligomycin application in mitochondria of HN9.10e cells transiently transfected with either GFP alone (control) or GFP and untagged FL-Foxg1 (1–481), mt-Foxg1 (272–481), or cyt-Foxg1 (315–481). Fluorescence was normalized to the mean TMRM fluorescence in control cells. (C and D) OCR normalized to OCR upon rotenone + antimycin A (nonmitochondrial OCR) of HN9.10e cells not transfected (wt) or transfected with FL-Foxg1, mt-Foxg1, or cyt-Foxg1. Cells have been challenged with oligomycin (C) or FCCP (D). Data represent mean ± SEM, n = 4 independent experiments, each condition replicated three to five times per experiment. (E) Quantification of the normalized OCR from C and D. *P < 0.05; **P < 0.01; ***P < 0.001.
To further assess the role of Foxg1 in regulating mitochondrial function, we measured the oxygen consumption rate (OCR) of HN9.10e cells transfected with FL-Foxg1, mt-Foxg1, or cyt-Foxg1 (Fig. 6 C–E). Oligomycin treatment revealed that the ATP synthesis-linked oxygen consumption was only slightly decreased in FL-Foxg1-expressing cells in comparison with untransfected cells and was not significantly different from that of cells expressing the cytosolic or mitochondria-targeted Foxg1. However, the overexpression of both FL-Foxg1 and mt-Foxg1 had a strong effect on the respiratory reserve capacity (as revealed by FCCP addition), completely abolishing it.
Discussion
In the present study, we demonstrate, in isolated rat mitochondria, cell cultures, and mouse cortex, that Foxg1 is imported into mitochondria in an energy-dependent manner and that it modulates cellular and mitochondrial functions such as proliferation, differentiation, mitochondrial membrane potential (ΔΨm), and OCR. The presence in mitochondria of transcription factors having a major role in neuronal survival, differentiation, and plasticity is an established, yet intriguing, notion that underlines the interplay among mitochondrial, nuclear, and cellular functions. Examples are the cAMP response element-binding protein (24) and p53 (25), as well as FOXO3a and FoxP2, members, such as Foxg1, of the Forkhead family (26, 27).
Here we directly demonstrate that a fraction of Foxg1 is recruited to mitochondria, showing that both endogenous Foxg1 and overexpressed Foxg1-GFP colocalize with mitochondrial markers in cell lines, primary cells, and mouse cortex. We also demonstrate that a Foxg1 272–481-GFP chimera displays an exclusive and unequivocal mitochondrial localization. Thus, Foxg1 lacks the classical N-terminal mitochondrial targeting sequence but possesses an internal one placed downstream its forkhead domain, as suggested by in silico analysis.
The data obtained in the subcellular fractionation experiments clearly demonstrate that within mitochondria of living cells (mouse brain or HN9.10e cells), there is no full-length Foxg1, but only C-terminal fragments of the protein. Using an in vitro mitochondrial import assay, however, a fraction of in vitro synthetized full-length Foxg1 appears to be trypsin-resistant, indicating it has been imported by mitochondria (in the matrix or in the intermembrane space) through a membrane potential-dependent process. The simplest explanation is that Foxg1 is imported, at least in part, as intact full-length protein, and then is completely cleaved into smaller fragments within the matrix. Accordingly, in living cells, the amount of full-length Foxg1 within mitochondria is expected to be negligible. The absence of mitochondria labeled with GFP when transfected with GFP-Foxg1 suggests that fusion of GFP at the Foxg1 N terminus interferes with the mitochondrial import machinery/recognition. If this were not the case, and GFP-Foxg1 imported as such and then cleaved in the matrix or in the intermembrane space, GFP should remain trapped within mitochondria. However, as indicated by the experiments carried out with the double-tagged Foxg1, remova of the CFP-tagged N terminus of Foxg1 in the cytosol allows the mitochondrial import of the C-terminal, and thus labeling of mitochondria with YFP.
In conclusion, Foxg1 undergoes a complex and relatively slow posttranslational processing, with slight variations depending on the cell type. The 58-kDa FL-Foxg1, the primary localization of which is in the nucleus and in the cytoplasm, can be imported as such into the mitochondria and then further proteolized within the matrix; the full-length protein can be also partially proteolized in the cytoplasm with the generation of a 45-kDa fragment that in part remains in this compartment, and in part is imported into mitochondria. The 24-kDa C-terminal fragment of Foxg1 is exclusively produced within mitochondria.
During development, Foxg1 exerts a dual role, promoting proliferation of telencephalic neuroepithelial cells and inhibiting their premature differentiation. In HN9.10e cells, a model line for neuronal differentiation, we found a clearly different proliferation/differentiation-inducing activity of overexpressed FL-Foxg1 (both nuclear and mitochondrial), mt-Foxg1 (exclusively mitochondrial), and cyt-Foxg1 (displaying a diffuse intracellular localization). Whereas FL-Foxg1 promotes mitochondrial fission and cellular proliferation, mt-Foxg1 favors mitochondrial fusion and an early phase of neuronal differentiation. It is noteworthy that extensively interconnected mitochondrial networks are frequently found in metabolically active cells, whereas mitochondrial fission occurs during cytokinesis and apoptosis (22). These results suggest that Foxg1, through its internal processing and its mitochondrial targeting, participates in the regulation of the correct proliferation/differentiation balance of neuroepithelial cells.
In addition, our results indicate that overexpressed FL-Foxg1 enhances ΔΨm and decreases the respiratory reserve capacity of mitochondria. The increased ΔΨm, together with almost blunted mitochondrial reserve capacity in FL-Foxg1 overexpressing cells, is in agreement with their high proliferative phenotype. Indeed, fast proliferating cells, despite having fully functional respiratory complexes, are highly glycolytic regardless of O2 availability, often displaying higher ΔΨm in comparison with their differentiated counterpart. Moreover, it has been shown that respiration is at near-maximum capacity for human pluripotent stem cells, in contrast to, for example, fibroblasts, which have a large, untapped respiratory reserve capacity (ref. 28 and references therein). With progressive cellular differentiation, highly proliferative cells shift metabolism from glycolysis to oxidative phosphorylation.
Modifications of Foxg1 expression have been linked to human pathologies, such as RS (15, 29), autism spectrum disorders (17), and different types of cancer (11, 13). The notion that mitochondrial abnormalities may play a role in RS predates the discovery of its genetic origin (30), and to our knowledge, there is no previous report showing a direct mitochondrial localization of any of the proteins linked to RS (MeCP2, CDKL5, FOXG1) so far identified. The newly discovered Foxg1 mitochondrial localization may provide novel insights into the manifestation of RS symptoms.
Finally, it is known that both up-regulation and down-regulation of FOXG1 are linked to cancer progression. The first link between FOXG1 (in that context named quin) and cancer was published in 1993, demonstrating that FOXG1 can act as a potent oncogene (14). More recently, it was demonstrated that in glioblastoma, FOXG1 overexpression suppresses the transcription of p21Cip1 and causes abnormal cellular proliferation and worse prognosis (11). Conversely, in breast cancer, low levels of FOXG1 are correlated with a worse prognosis, as it increases the expression of the AIB1 oncogene (31). It is tempting to speculate that a variable intracellular localization of Foxg1 in these different conditions may contribute to explain these apparently contradictory findings. An amount of recent evidence suggests that metabolism and mitochondrial functions play a critical role in cancer development and progression (32). The identification of the multiple localization of Foxg1 (nucleus, cytosol, and mitochondrial matrix) opens the way to study the mechanisms exploited by this protein to tie together gene expression, metabolism, and mitochondrial bioenergetics.
Materials and Methods
Plasmid Construction.
All the constructs present in this report have been generated by standard PCR strategy (SI Experimental Procedures).
Cell Culture and Transfection.
The cell lines were cultured according to ATCC (American Type Culture Collection) guidelines and transfected with Lipofectamine 2000 (Invitrogen) according to the manufacturer’s instructions.
Immunocytofluorescence.
Cells were seeded on gelatin-coated glass coverslips and transiently transfected with suitable plasmids. Twenty hours after transfection, cells were fixed with 4% (vol/vol) paraformaldehyde, permeabilized with 0.05% Triton X-100, and after blocking with 1% FBS, incubated with a rabbit polyclonal anti-Foxg1 Ab (ABCAM ab18259) or a mouse monoclonal anti-Sod2 (Invitrogen A21990). Cells were than incubated with the appropriate secondary Ab.
In Vivo Fluorescence Imaging.
All imaging experiments were performed on a Leica TCS SL confocal microscope equipped with Leica oil immersion HCX PL Apo 63X, 1.4 N.A. or Leica HCX PL Apo 40X, 1.25–0.75 N.A. objectives at 37 °C.
Western Blot on Transfected Cells and Mouse Cortex.
Whole cortices of P1/2 newborn animals were carefully dissected and homogenized using a Teflon–glass homogenizer; cytoplasm, nucleus, and mitochondria were isolated by differential centrifugations. Samples were than prepared for WB assay (for details, see SI Experimental Procedures).
Import Assay of Full-length Foxg1 into Isolated Rat Liver Mitochondria.
Amplified cDNAs corresponding to full length or aa 272–481 were used to generate [35S]methionine-labeled proteins. Labeled proteins were incubated with isolated rat liver mitochondria for 1 h at 37 °C (33) in the presence or absence of FCCP to dissipate the ΔΨm. Trypsin was added to digest proteins outside mitochondria. For details, see SI Experimental Procedures.
Measure of OCR.
To measure OCR, 6 × 10⁴ HN9.10e cells were transfected (or not) with FL-Foxg1, mt-Foxg1 (272–481), or cyt-Foxg1 (315–481) and simultaneously plated onto XF24 plates (Seahorse Bioscience); cells were incubated at 37 °C, 5% CO2, and the medium was replaced 1 h after transfection. Twenty-four hours later, the medium was replaced with 675 μL unbuffered assay media (DMEM base, Sigma D5030, supplemented with 1.85 g/L NaCl, 1 mM Na-pyruvate, 2 mM glutamine, and 25 mM glucose at pH 7.4), and cells were placed at 37 °C in a CO2-free incubator. Basal OCR was recorded using the XF24 plate reader. During the experiment, cells were challenged with oligomycin (1 μM) or FCCP (0.2 and 0.4 μM), and at the end of the experiment, rotenone (1 μM) + antimycin A (1 μM) were added to measure mitochondria-independent OCR. Each cycle of measurement consisted of 3 min mixing, 3 min waiting, and 3 min measuring. For each well, the mitochondrial-dependent OCR (i.e., the rotenone/antimycinA-sensitive respiration) was normalized to OCR upon rotenone/antimycinA (nonmitochondrial OCR).
Evaluation of ΔΨm, Mitochondrial Morphology, and Cellular Proliferation.
HN9.10e cells were plated on glass coverslips and transfected with GFP or cotransfected with GFP and untagged FL-Foxg1, mt-Foxg1 (272-481), or cyt-Foxg1(315-481) at a 1:5 ratio; 24 h later, cells were loaded with 2 nM TMRM (Life Technologies) and imaged. Evaluation of ΔΨm was carried out by specific MatLab routines (MatLab software). Mitochondrial length was calculated using Mytoe, a free software generated for the automated analysis of the mitochondrial morphology and dynamics (34). Cellular proliferation was evaluated morphologically according to Dotti et al. (23).
Statistical Analysis.
All statistical analyses were performed y using OriginPro 7.5 (OriginLab Corporation). Data were expressed as mean ± SD or mean ± SEM, when specified. Comparisons among multiple groups were made by the one-way analysis of variance or by Student t test. Statistical significance was established as *P < 0.05; **P < 0.01; ***P < 0.001.
SI Experimental Procedures
Plasmid Construction.
To generate GFP-Foxg1 wt, the entire cDNA of mouse Foxg1 was amplified by PCR, and the XhoI/BamHI digested product was inserted into pEGFP-C1 (Clontech).
Foxg1 aa 236–481-GFP.
Foxg1 mouse cDNA was amplified by PCR, using GFP-Foxg1 wt as DNA template and a forward primer incorporating the KpnI restriction site that occurs in the mFoxg1 cDNA (underlined) forward primer: 5′-GAAGGTACCGCGCCACTACGAC-3′. The reverse primer was 5′-GGATCCCCATGTATTAAAGGGTTGGAAG-3′, incorporating a BamHI restriction site (underlined). The amplification product was purified and cleaved with KpnI/BamHI and ligated to the corresponding restriction sites in the vector pEGFP-N1 (Clontech).
Foxg1 wt-GFP.
The construct was obtained by cloning the fragment XhoI-KpnI of GFP-Foxg1 wt in the corresponding sites of Foxg1 aa 236–481-GFP.
Foxg1 aa 1–236-GFP.
The construct was obtained by cloning the fragment XhoI-KpnI of GFP-Foxg1 wt in the corresponding sites of pEGFP-N1 (Clontech).
Foxg1 aa 234–391-GFP.
Foxg1 mouse cDNA was amplified by PCR, using GFP-Foxg1 wt as DNA template and a forward primer incorporating the KpnI restriction site that occurs in the mFoxg1 cDNA (underlined) forward primer: 5′-GAAGGTACCGCGCCACTACGAC-3′. The reverse primer was 5′-GGATCCGTCCCGGAGCAGGGCACCG-3′, incorporating a BamHI restriction site (underlined) and the codon coding for aa 391 (bold). The amplification product was purified and cleaved with KpnI/BamHI and was ligated to the corresponding restriction sites in the vector pEGFP-N1 (Clontech).
Foxg1 aa 272–391-GFP.
Foxg1 mouse cDNA was amplified by PCR using Foxg1 aa 234–391-GFP as the DNA template. The forward primer was 5′-GGTACCAATGTCTCGAGCCAAGCTGGCCTTT-3′, incorporating a KpnI restriction site (underlined) and a start codon (bold) before the codon coding for aa 272. In addition, an XhoI restriction site (doubly underlined) was added for future cloning strategies without affecting the aa sequence. The reverse primer was the same as that used for Foxg1 aa 234–391-GFP. The amplification product was purified and cleaved with KpnI/BamHI and was ligated to the corresponding restriction sites in the vector pEGFP-N1 (Clontech).
Foxg1 aa 315–391-GFP.
Foxg1 mouse cDNA was amplified by PCR, using Foxg1 aa 234–391-GFP as the DNA template. The forward primer was 5′-GGTACCAATGAGCACTTTGAGTTACAACGG-3′, incorporating a KpnI restriction site (underlined) and a start codon (bold) before the codon coding for aa 315. The reverse primer was the same used for Foxg1 aa 234–391-GFP. The amplification product was purified and cleaved with KpnI/BamHI and was ligated to the corresponding restriction sites in the vector pEGFP-N1 (Clontech).
Foxg1 aa 234–314-GFP.
Foxg1 mouse cDNA was amplified by PCR, using Foxg1 aa 234–391-GFP as DNA template. The forward primer was the same used for Foxg1 aa 234–391-GFP. The reverse primer was 5′-GGATCCAGTCTGCTGGCGCGGGGG-3′, incorporating a BamHI restriction site (underlined) and the codon coding for aa 314 (bold). The amplification product was purified and cleaved with KpnI/BamHI and ligated to the corresponding restriction sites in the vector pEGFP-N1 (Clontech).
Foxg1 aa 272–314-GFP.
Foxg1 mouse cDNA was amplified by PCR, using Foxg1 aa 234–314-GFP as DNA template. The forward primer was the same used for Foxg1 aa 272–391-GFP. The reverse primer was the same used for Foxg1 aa 234–314-GFP. The amplification product was purified and cleaved with KpnI/BamHI and was ligated to the corresponding restriction sites in the vector pEGFP-N1 (Clontech).
Foxg1 aa 272–309-GFP.
Foxg1 mouse cDNA was amplified by PCR, using Foxg1 aa 234–391-GFP as DNA template. The forward primer was the same used for Foxg1 aa 272–391-GFP. The reverse primer was 5′-GGATCCTTGTGCAGGGACAGGAAGGGCG-3′, incorporating a BamHI restriction site (underlined) and the codon coding for aa 309 (bold). The amplification product was purified and cleaved with KpnI/BamHI and ligated to the corresponding restriction sites in the vector pEGFP-N1 (Clontech).
Foxg1 aa 277–309-GFP.
Foxg1 mouse cDNA was amplified by PCR, using Foxg1 aa 272–314-GFP as DNA template. The forward primer was 5′-GGTACCAATGGCCTTTAAGCGCGGGGCG-3′, incorporating a KpnI restriction site (underlined) and a start codon (bold) before the codon coding for aa 277. The reverse primer was the same used for Foxg1 aa 272–309-GFP. The amplification product was purified and cleaved with KpnI/BamHI and ligated to the corresponding restriction sites in the vector pEGFP-N1 (Clontech).
Foxg1 aa 277–305-GFP.
Foxg1 mouse cDNA was amplified by PCR, using Foxg1 aa 277–309-GFP as DNA template. The forward primer was the same used for Foxg1 aa 277–309-GFP. The reverse primer was 5′-GGATCCTTGAAGGGCGACATGGGCCAGTA-3′, incorporating a BamHI restriction site (underlined) and the codon coding for aa 305 (bold). The amplification product was purified and cleaved with KpnI/BamHI and ligated to the corresponding restriction sites in the vector pEGFP-N1 (Clontech).
Foxg1 aa 277–302-GFP.
Foxg1 mouse cDNA was amplified by PCR, using Foxg1 aa 277–305-GFP as DNA template. The forward primer was the same used for Foxg1 aa 277–309-GFP. The reverse primer was 5′-GGATCCTTCATGGGCCAGTAGAGGGAGC-3′, incorporating a BamHI restriction site (underlined) and the codon coding for aa 302 (bold). The amplification product was purified and cleaved with KpnI/BamHI and ligated to the corresponding restriction sites in the vector pEGFP-N1 (Clontech).
Foxg1 aa 287–305-GFP.
Foxg1 mouse cDNA was amplified by PCR, using Foxg1 aa 277–305-GFP as DNA template. The forward primer was 5′-GGTACCAATGACCGGCCTCACCTTCATGGAC-3′, incorporating a KpnI restriction site (underlined) and a start codon (bold) before the codon coding for aa 287. The reverse primer was the same used for Foxg1 aa 277–305-GFP. The amplification product was purified and cleaved with KpnI/BamHI and ligated to the corresponding restriction sites in the vector pEGFP-N1 (Clontech).
Foxg1 aa 292–314-GFP.
The construct was obtained by digesting Foxg1 aa 272–314-GFP with XhoI; this causes the excision of the XhoI fragment between the XhoI site in the pEGFP-N1 polylinker (at the 5′) and the artificially inserted XhoI site in Foxg1 aa 272–314-GFP (at the 3′). Ligation of the vector results in a construct in which translation starts at methionine 292.
Foxg1 aa 272–299-GFP.
Foxg1 mouse cDNA was amplified by PCR, using Foxg1 aa 272–309-GFP as DNA template. The forward primer was the same used for Foxg1 aa 272–391-GFP. The reverse primer was 5′-GGATCCACGTAGAGGGAGCCGGCGCG-3′, incorporating a BamHI restriction site (underlined) and the codon coding for aa 299 (bold). The amplification product was purified and cleaved with KpnI/BamHI and ligated to the corresponding restriction sites in the vector pEGFP-N1 (Clontech).
Foxg1 aa 272–481-GFP.
Foxg1 mouse cDNA was amplified by PCR, using Foxg1 aa 236–481-GFP as DNA template. The forward primer was the same used for Foxg1 aa272-391-GFP, and the reverse primer the same used for Foxg1 aa 236–481-GFP. The amplification product was purified and cleaved with KpnI/BamHI and ligated to the corresponding restriction sites in the vector pEGFP-N1 (Clontech).
Foxg1 aa 272–481.
The construct was generated digesting Foxg1 aa 272–481-GFP with XhoI (present in the pEGFP-N1 polylinker) and BamHI. The excised fragment was cloned into the corresponding restriction sites of pcDNA3.1(−) (Life Technologies).
Foxg1 aa 315–481-GFP.
Foxg1 mouse cDNA was amplified by PCR, using Foxg1 aa 236–481-GFP as DNA template. The forward primer was the same used for Foxg1 aa315-391-GFP, and the reverse primer the same used for Foxg1 aa 236–481-GFP. The amplification product was purified and cleaved with KpnI/BamHI and ligated to the corresponding restriction sites in the vector pEGFP-N1 (Clontech).
Foxg1 aa 315–481.
The construct was generated, digesting Foxg1 aa 315–481-GFP with XhoI (present in the pEGFP-N1 polylinker) and BamHI. The excised fragment was cloned into the corresponding restriction sites of pcDNA3.1(−) (Life Technologies).
CFP-Foxg1 wt-YFP.
Foxg1 wt-GFP-N1 was digested with KpnI and BamHI, and the resulting C-terminal fragment of Foxg1 was cloned into the corresponding restriction sites of pEYFP-N1 (Clontech), generating the construct Foxg1 aa 236–481-pEYFP-N1. In parallel, Foxg1 wt-GFP-N1 was digested with XhoI and KpnI, and the resulting N-terminal fragment of Foxg1 was cloned into the corresponding restriction sites of pECFP-N1 (Clontech). The resulting construct (pECFP-Foxg1 aa 1–236) was digested with NheI and KpnI, resulting in the excision of a fragment containing Enhanced Cyano Fluorescent Protein and the N-terminal portion of Foxg1; this fragment was cloned into the NheI/KpnI restriction sites of Foxg1 aa 236–481-pEYFP-N1, thus reconstructing the entire Foxg1 cDNA carrying ECFP at the N terminus and EYFP at the C terminus.
Untagged Foxg1 wt.
The construct was generated digesting GFP-Foxg1 wt with XhoI (present in the pEGFP-N1 polylinker) and BamHI and cloning Foxg1 cDNA into the corresponding restriction sites of pcDNA3.1(−) (Life Technologies).
Cell Culture and Transfection.
NIH 3T3 cell line were cultured in Dulbecco modified medium supplemented with 10% (vol/vol) newborn calf serum and antibiotics (100 units/mL penicillin/streptomycin). SH-SY5Y and HN9.10e cell lines were cultured in RPMI supplemented with 10% (vol/vol) FBS and antibiotics (100 units/mL penicillin/streptomycin). Cells were plated at 60–70% confluence on glass coverslips or glass-bottomed dishes (wilco) and transfected using Lipofectamine 2000 (11668-027; Invitrogen), according to the manufacturer's instructions. Any further experimental manipulation was performed 24 h after transfection. All experiments were performed at 37 °C.
Western Blot on Transfected Cells.
NIH 3T3 cell lines were cultured in 3-cm-diameter Petri dishes at 90% of confluence and were transfected with the vectors carrying GFP Foxg1 wt, Foxg1 wt-GFP, or untagged Foxg1 wt by using Lipofectamine 2000 (11668-027; Invitrogen). The next day, cells were washed in cold PBS and lysed with 300 μL RIPA (radioimmunoprecipitation assay) buffer (1% Triton X-100, 0.5% Na deoxicolate, 1% SDS, 20 mM Tris⋅HCl at pH 8, 150 mM NaCl, 1 mM EDTA, 1 mM PMSF) supplemented with a mixture of protease inhibitors (11 836 170 001; Roche). The samples were sonicated four times for 15 s (Microsonics; ultrasonic cell disruptor) and then boiled for 5 min in sample buffer. The same amount (around 20 μg) of cellular proteins was then subjected to SDS-PAGE in 12% (wt/vol) polyacrylamide gel and transferred to nitrocellulose membrane. Membranes were incubated 1 h in TBS-Tween 20 containing 5% (wt/vol) nonfat dry milk and then exposed to a 1:1,000 dilution of rabbit polyclonal antiserum anti-Foxg1 (Abcam, catalog no. ab18259) at 4 °C overnight. Membranes were then washed and incubated with 1:3,000 anti-rabbit IgG (H+L) conjugated to horseradish peroxidase for 1 h at room temperature and finally revealed following the standard method for the chemiluminescence (Immune-Star HRP; Bio-Rad) system and visualized by autoradiography.
Western Blot on Mouse Cortex.
Whole cortices of P1/2 newborn animals were carefully dissected, and subfractionation was performed according to Frezza et al. (35). The explants were immersed in a buffer containing 0.01 M Tris⋅HCl, 1 mM EGTA, 0.2 M sucrose, and protease inhibitors. The samples were homogenized using a Teflon–glass homogenizer operated at 1,600 rpm. The homogenate was than centrifuged at 700 × g for 10'. The pellet, containing nuclei, was washed, and nuclei were lysed in RIPA buffer supplemented with protease inhibitors and sonicated. The supernatant was collected and centrifuged at 8,000 × g for 10 min to separate mitochondria from cytoplasmic extract. The supernatant (cytoplasmic extract) was collected. The pellet was washed and centrifuged again at 8,000 × g for 10 min. Protein content in nuclear, cytoplasmic, and mitochondrial samples were quantified with Bio-Rad Protein Assay (catalog no. 500-0006). For the trypsin assay, mitochondria were treated with 10 μM trypsin at room temperature for 15 min. Where indicated, 0.1% SDS was added before trypsin. Around 70 μg proteins from mitochondrial extracts, 30 μg proteins from cytoplasmic extracts, and 10 μg proteins from nuclear extracts were subjected to SDS-PAGE, as described earlier.
Import Assay of Full-Length Foxg1 into Isolated Rat Liver Mitochondria.
Amplified cDNAs corresponding to full length or aa 272–481 were used to generate [35S]methionine-labeled proteins. A single TnT reaction was used in three independent import experiments per protein, and values were obtained by means of ImageQuant software and corrected for local background and loading in all cases. Labeled proteins were incubated with isolated rat liver mitochondria for 1 h at 37 °C in the presence or absence of (50 μM) FCCP to dissipate the ΔΨm. Trypsin (100 μg/mL) was added to digest proteins outside mitochondria. Values and SE are based on three experiments. Background is measured in a region of the lane without bands.
Evaluation of Mitochondrial Potential, Mitochondrial Fusion, and Cellular Proliferation.
HN9.10e cells were plated on glass coverslips and transfected with GFP or cotransfected with GFP and untagged FL-Foxg1, mt-Foxg1 (272–481), or cyt-Foxg1 (315–481) at a 1:5 ratio. Twenty minutes before imaging, cells were loaded with 2 nM TMRM (Life Technologies; catalog no. T-668) in Hepes-buffered F12 and then washed twice in the same culture medium.
Fields containing, on average, 70 cells (40× objective) or 30 cells (63× objective) were acquired and analyzed. Only green fluorescent cells were included in the analysis.
Evaluation of mitochondrial potential was carried out by specific MatLab routines (MatLab software by The MathWorks) adapted by our laboratory to mitochondrial potential quantification and by the image analysis software MetaMorph 5.0 (Universal Imaging). At least 60 fields from three independent experiments were analyzed for a total of at least 400 cells per treatment.
Mitochondrial length was calculated by means of Mytoe, a free software generated for the automated analysis of the mitochondrial morphology and dynamics (34). The mean mitochondrial length was calculated on the entire mitochondrial population of each cell of the confocal plane of a given field, for a total of at least 10 fields examined for each treatment and, consequently, at least 100,000 mitochondria analyzed for each treatment.
Cellular proliferation was evaluated morphologically. Cells were divided into three subpopulations: mitotic cells, which are recognizable on the basis of cell rounding (the process of shape change by which a flat interphase cell becomes spherical at the onset of mitosis) and by the typical plasma membrane birefringence observable in transmitted light; blasts, which are cells showing an undifferentiated morphology consisting of phase-bright cell bodies of epithelioid appearance, loosely adherent to the substrate and characterized by absence of neurites; and early-differentiating cells, the fraction of HN9.10e cells that adhere tightly to substrate, assuming a flat morphology and producing thin and short processes designated “minor neurites.” This cell population corresponds to the stage 2 of the hippocampal neuroblasts classification used by Dotti et al. (23).
All statistical analyses were performed by means of OriginPro 7.5 (OriginLab Corporation). Data were expressed as mean + SD. Comparisons among multiple groups were made by the one-way ANOVA. Statistical significance was established at *P < 0.05; **P < 0.01; ***P < 0.005.
Immunocytofluorescence.
NIH 3T3 cells or HN9.10e cells were seeded on gelatin-coated glass coverslips and transiently transfected with different plasmids. Twenty hours after transfection, the cells were fixed with 4% (wt/vol) paraformaldehyde, permeabilized with 0.05% Triton X-100, and after blocking with 1% FBS, incubated with a rabbit polyclonal anti-Foxg1 antibody (ABCAM ab18259) or a mouse monoclonal anti-Superoxide Dismutase 2 (Invitrogen A21990). Excess antibody was eliminated and cells were incubated with the appropriate secondary antibody (Alexa Fluo 488 or Alexa Fluo 555 from Invitrogen). Hoechst 33258 was used to visualize the nuclear compartment. The coverslips were mounted and analyzed with a Leica TCS NT confocal microscope. To minimize the signal bleed-through between green and red acquisition channels, we set the following acquisition parameters: pinhole aperture, 300; PMT voltage, 600 V; PMT offset, 1%; objective, 40× oil NA 1.25; image size, 512 × 512; frequency scan, 400 Hz; and green Ch: excitation line, 488 nm; laser intensity, 2%; and PMT window, e00–580 nm; and red Ch: excitation line, 543 nm; laser intensity, 15%; and PMT window 580–670 nm. Cross-talk analyses were performed.
Acknowledgments
This research was funded by grants from AIRC (Associazione Italiana Ricerca sul Cancro) IG13252 (to M.C.), Italian National Research Council special project “Aging” (to T.P.), and the Medical Research Council UK (to M.Z. and A.R.).
Footnotes
The authors declare no conflict of interest.
This article contains supporting information online at www.pnas.org/lookup/suppl/doi:10.1073/pnas.1515190112/-/DCSupplemental.
References
- 1.Kaestner KH, Knochel W, Martinez DE. Unified nomenclature for the winged helix/forkhead transcription factors. Genes Dev. 2000;14(2):142–146. [PubMed] [Google Scholar]
- 2.Weigel D, Jäckle H. The fork head domain: a novel DNA binding motif of eukaryotic transcription factors? Cell. 1990;63(3):455–456. doi: 10.1016/0092-8674(90)90439-l. [DOI] [PubMed] [Google Scholar]
- 3.Xuan S, et al. Winged helix transcription factor BF-1 is essential for the development of the cerebral hemispheres. Neuron. 1995;14(6):1141–1152. doi: 10.1016/0896-6273(95)90262-7. [DOI] [PubMed] [Google Scholar]
- 4.Kumamoto T, et al. Foxg1 coordinates the switch from nonradially to radially migrating glutamatergic subtypes in the neocortex through spatiotemporal repression. Cell Reports. 2013;3(3):931–945. doi: 10.1016/j.celrep.2013.02.023. [DOI] [PMC free article] [PubMed] [Google Scholar]
- 5.Hanashima C, Li SC, Shen L, Lai E, Fishell G. Foxg1 suppresses early cortical cell fate. Science. 2004;303(5654):56–59. doi: 10.1126/science.1090674. [DOI] [PubMed] [Google Scholar]
- 6.Hwang CH, Simeone A, Lai E, Wu DK. Foxg1 is required for proper separation and formation of sensory cristae during inner ear development. Dev Dyn. 2009;238(11):2725–2734. doi: 10.1002/dvdy.22111. [DOI] [PubMed] [Google Scholar]
- 7.Kawauchi S, et al. The role of foxg1 in the development of neural stem cells of the olfactory epithelium. Ann N Y Acad Sci. 2009;1170:21–27. doi: 10.1111/j.1749-6632.2009.04372.x. [DOI] [PMC free article] [PubMed] [Google Scholar]
- 8.Pratt T, Tian NM, Simpson TI, Mason JO, Price DJ. The winged helix transcription factor Foxg1 facilitates retinal ganglion cell axon crossing of the ventral midline in the mouse. Development. 2004;131(15):3773–3784. doi: 10.1242/dev.01246. [DOI] [PMC free article] [PubMed] [Google Scholar]
- 9.Dastidar SG, Landrieu PM, D’Mello SR. FoxG1 promotes the survival of postmitotic neurons. J Neurosci. 2011;31(2):402–413. doi: 10.1523/JNEUROSCI.2897-10.2011. [DOI] [PMC free article] [PubMed] [Google Scholar]
- 10.Regad T, Roth M, Bredenkamp N, Illing N, Papalopulu N. The neural progenitor-specifying activity of FoxG1 is antagonistically regulated by CKI and FGF. Nat Cell Biol. 2007;9(5):531–540. doi: 10.1038/ncb1573. [DOI] [PubMed] [Google Scholar]
- 11.Seoane J, Le HV, Shen L, Anderson SA, Massagué J. Integration of Smad and forkhead pathways in the control of neuroepithelial and glioblastoma cell proliferation. Cell. 2004;117(2):211–223. doi: 10.1016/s0092-8674(04)00298-3. [DOI] [PubMed] [Google Scholar]
- 12.Rodriguez C, et al. Functional cloning of the proto-oncogene brain factor-1 (BF-1) as a Smad-binding antagonist of transforming growth factor-beta signaling. J Biol Chem. 2001;276(32):30224–30230. doi: 10.1074/jbc.M102759200. [DOI] [PubMed] [Google Scholar]
- 13.Manoranjan B, et al. Medulloblastoma stem cells: modeling tumor heterogeneity. Cancer Lett. 2013;338(1):23–31. doi: 10.1016/j.canlet.2012.07.010. [DOI] [PubMed] [Google Scholar]
- 14.Li J, Vogt PK. The retroviral oncogene qin belongs to the transcription factor family that includes the homeotic gene fork head. Proc Natl Acad Sci USA. 1993;90(10):4490–4494. doi: 10.1073/pnas.90.10.4490. [DOI] [PMC free article] [PubMed] [Google Scholar]
- 15.Ariani F, et al. FOXG1 is responsible for the congenital variant of Rett syndrome. Am J Hum Genet. 2008;83(1):89–93. doi: 10.1016/j.ajhg.2008.05.015. [DOI] [PMC free article] [PubMed] [Google Scholar]
- 16.De Filippis R, et al. Expanding the phenotype associated with FOXG1 mutations and in vivo FoxG1 chromatin-binding dynamics. Clin Genet. 2012;82(4):395–403. doi: 10.1111/j.1399-0004.2011.01810.x. [DOI] [PubMed] [Google Scholar]
- 17.Mariani J, et al. FOXG1-Dependent Dysregulation of GABA/Glutamate Neuron Differentiation in Autism Spectrum Disorders. Cell. 2015;162(2):375–390. doi: 10.1016/j.cell.2015.06.034. [DOI] [PMC free article] [PubMed] [Google Scholar]
- 18.Gioran A, Nicotera P, Bano D. Impaired mitochondrial respiration promotes dendritic branching via the AMPK signaling pathway. Cell Death Dis. 2014;5:e1175. doi: 10.1038/cddis.2014.144. [DOI] [PMC free article] [PubMed] [Google Scholar]
- 19.Mattson MP, Gleichmann M, Cheng A. Mitochondria in neuroplasticity and neurological disorders. Neuron. 2008;60(5):748–766. doi: 10.1016/j.neuron.2008.10.010. [DOI] [PMC free article] [PubMed] [Google Scholar]
- 20.Manders EMM, Verbeek FJ, Aten JA. Measurement of co-localization of objects in dual-colour confocal images. J Microsc. 1993;169(3):375–382. doi: 10.1111/j.1365-2818.1993.tb03313.x. [DOI] [PubMed] [Google Scholar]
- 21.Giacomello M, et al. Ca2+ hot spots on the mitochondrial surface are generated by Ca2+ mobilization from stores, but not by activation of store-operated Ca2+ channels. Mol Cell. 2010;38(2):280–290. doi: 10.1016/j.molcel.2010.04.003. [DOI] [PubMed] [Google Scholar]
- 22.Westermann B. Molecular machinery of mitochondrial fusion and fission. J Biol Chem. 2008;283(20):13501–13505. doi: 10.1074/jbc.R800011200. [DOI] [PubMed] [Google Scholar]
- 23.Dotti CG, Sullivan CA, Banker GA. The establishment of polarity by hippocampal neurons in culture. J Neurosci. 1988;8(4):1454–1468. doi: 10.1523/JNEUROSCI.08-04-01454.1988. [DOI] [PMC free article] [PubMed] [Google Scholar]
- 24.Cammarota M, et al. Cyclic AMP-responsive element binding protein in brain mitochondria. J Neurochem. 1999;72(6):2272–2277. doi: 10.1046/j.1471-4159.1999.0722272.x. [DOI] [PubMed] [Google Scholar]
- 25.Marchenko ND, Zaika A, Moll UM. Death signal-induced localization of p53 protein to mitochondria. A potential role in apoptotic signaling. J Biol Chem. 2000;275(21):16202–16212. doi: 10.1074/jbc.275.21.16202. [DOI] [PubMed] [Google Scholar]
- 26.Caballero-Caballero A, et al. Mitochondrial localization of the forkhead box class O transcription factor FOXO3a in brain. J Neurochem. 2013;124(6):749–756. doi: 10.1111/jnc.12133. [DOI] [PubMed] [Google Scholar]
- 27.Tanabe Y, et al. Temporal expression and mitochondrial localization of a Foxp2 isoform lacking the forkhead domain in developing Purkinje cells. J Neurochem. 2012;122(1):72–80. doi: 10.1111/j.1471-4159.2011.07524.x. [DOI] [PubMed] [Google Scholar]
- 28.Zhang J, Nuebel E, Daley GQ, Koehler CM, Teitell MA. Metabolic regulation in pluripotent stem cells during reprogramming and self-renewal. Cell Stem Cell. 2012;11(5):589–595. doi: 10.1016/j.stem.2012.10.005. [DOI] [PMC free article] [PubMed] [Google Scholar]
- 29.Shoichet SA, et al. Haploinsufficiency of novel FOXG1B variants in a patient with severe mental retardation, brain malformations and microcephaly. Hum Genet. 2005;117(6):536–544. doi: 10.1007/s00439-005-1310-3. [DOI] [PubMed] [Google Scholar]
- 30.Dotti MT, et al. Mitochondrial dysfunction in Rett syndrome. An ultrastructural and biochemical study. Brain Dev. 1993;15(2):103–106. doi: 10.1016/0387-7604(93)90045-a. [DOI] [PubMed] [Google Scholar]
- 31.Li JV, et al. Transcriptional repression of AIB1 by FoxG1 leads to apoptosis in breast cancer cells. Mol Endocrinol. 2013;27(7):1113–1127. doi: 10.1210/me.2012-1353. [DOI] [PMC free article] [PubMed] [Google Scholar]
- 32.Gaude E, Frezza C. Defects in mitochondrial metabolism and cancer. Cancer Metab. 2014;2:10. doi: 10.1186/2049-3002-2-10. [DOI] [PMC free article] [PubMed] [Google Scholar]
- 33.Reyes A, et al. Actin and myosin contribute to mammalian mitochondrial DNA maintenance. Nucleic Acids Res. 2011;39(12):5098–5108. doi: 10.1093/nar/gkr052. [DOI] [PMC free article] [PubMed] [Google Scholar]
- 34.Lihavainen E, Mäkelä J, Spelbrink JN, Ribeiro AS. Mytoe: automatic analysis of mitochondrial dynamics. Bioinformatics. 2012;28(7):1050–1051. doi: 10.1093/bioinformatics/bts073. [DOI] [PubMed] [Google Scholar]
- 35.Frezza C, Cipolat S, Scorrano L. Organelle isolation: Functional mitochondria from mouse liver, muscle and cultured fibroblasts. Nat Protoc. 2007;2(2):287–295. doi: 10.1038/nprot.2006.478. [DOI] [PubMed] [Google Scholar]


