Significance
A major goal in cancer research is to discover agents that transform malignant cells into benign cells. Here, we report on an agonist antibody that converts leukemic cells into killer cells. This induction has an added benefit: In addition to transforming the cancer cells into other, presumably less aggressive, cells, the newly induced cells have a killer phenotype and kill other as yet unconverted members of the malignant clone.
Keywords: agonist antibody, natural killer cell, differentiation, combinatorial antibody libraries
Abstract
An attractive, but as yet generally unrealized, approach to cancer therapy concerns discovering agents that change the state of differentiation of the cancer cells. Recently, we discovered a phenomenon that we call “receptor pleiotropism” in which agonist antibodies against known receptors induce cell fates that are very different from those induced by the natural agonist to the same receptor. Here, we show that one can take advantage of this phenomenon to convert acute myeloblastic leukemic cells into natural killer cells. Upon induction with the antibody, these leukemic cells enter into a differentiation cascade in which as many as 80% of the starting leukemic cells can be differentiated. The antibody-induced killer cells make large amounts of perforin, IFN-γ, and granzyme B and attack and kill other members of the leukemic cell population. Importantly, induction of killer cells is confined to transformed cells, in that normal bone marrow cells are not induced to form killer cells. Thus, it seems possible to use agonist antibodies to change the differentiation state of cancer cells into those that attack and kill other members of the malignant clone from which they originate.
Although adoptive cell transfer has long been an important method in experimental immunology, it only recently has entered clinical practice for the purpose of killing cancer cells (1, 2). In the most popular iteration, T cells harvested from patients are engineered to express single-chain antibodies to tumor antigens on their surface, in a format in which the antibodies are also linked to T-cell receptor (TCR) signal transduction domains. This cellular engineering endows the cells with the ability to bind specifically to tumors and to be activated upon binding. These cells, that now bear chimeric tumor antigen receptors, therefor are referred to as “chimeric antigen receptor T” (CAR-T) cells. At the site of the tumor, the CAR-T cells initiate a cytotoxic cascade that leads to the killing of the malignant cells (1, 2).
As an alternative process, one might consider taking advantage of the fact that some cells of the immune system, such as natural killer (NK) cells, already have an innate specificity for cells whose surface is altered because they are malignant or infected (3–5). Indeed, there is a growing consensus that the use of NK cells in immunotherapy is, at present, underappreciated (5). To make the possibility of using NK cells in immunotherapy a reality, it would be helpful if agonists could be discovered that both induce and activate them. In terms of potency, specificity, and half-life, such agonists should go beyond the less specific cytokines such as IL-2 and IL-15 that already are known to activate NK cells but can have profound systemic side effects (5, 6). At a minimum, the induction in vivo of already innately targeted NK cells would reduce the complicated therapeutic work flow inherent in the adoptive transfer process and potentially could give the clinician more control over the therapy.
The recent discovery of many agonist antibodies that govern cell fates has opened the way to induce selectively a large variety of specific cells of the immune system from normal or malignant bone marrow (BM) or blood (7–13). Sometimes these agonist antibodies induce cell differentiation along lineages expected from the known function of the receptor to which they bind. In other cases, however, they activate differentiation or transdifferentiation pathways that are different from those expected from the nature of the receptor with which they interact (7). For example, the known function of the granulocyte-colony stimulating factor receptor is to activate a pathway leading to granulocyte formation after binding to its natural agonist, granulocyte-colony stimulating factor. However, when some rare antibodies, which were found by autocrine selection from antibody libraries, bind to this same receptor, neural cells, instead of granulocytes, are formed efficiently (7). We call this phenomenon “receptor pleiotropism,” and we have identified several examples (13). Receptor pleiotropism may relate to the plasticity of fate conversion of hematopoietic cells (14, 15). Here, we report on a rare antibody against the thrombopoietin receptor (TPOR), again obtained by autocrine-based selection, that efficiently transforms malignant acute myeloblastic leukemia (AML) cells into highly activated NK cells. This highly specific antibody has an EC50 of 5 pM (that of TPO is 70 pM) and shows no activity in cells in which the TPOR is knocked out (12). The induced AML cells have extensive filopodia at their surface and express the CD11c dendritic cell marker. These induced cells synthesize large amounts of perforin, granzyme B, and IFN-γ that, as molecules involved in the mechanism of killing, are markers of NK cells. From a therapeutic standpoint, the ability to induce activated NK cells at will is arguably the most important example of receptor pleiotropism observed to date, in that the ability to induce activated NK cells from the readily accessible peripheral blood (PB) and BM cellular compartments may open new routes to cancer therapy that are much simpler than those in use today. We refer to this agonist antibody as “Fratricidin” in keeping with its ability to initiate the process of fratricide in a clone of tumor cells. If other small molecules or proteins with similar effects could be found, they could be referred to as “Fratricidins.”
Selection of Antibody Agonists
Because signal transduction pathways, especially for cytokines, are degenerate, we tested whether our panel of agonist antibodies with their different modes of binding to cell surfaces could induce stem cell-like AML cells to differentiate into alternative phenotypes. We studied BM or PB samples from seven patients for whom the differentiation status of their AML according to the French-American-British (FAB) cooperative group was known (16). Six were classified as M1 (minimal maturation), and the other was classified as M5 (acute monocytic leukemia). The one patient with M5 differentiated cells had been treated with Ara-C for 4 mo before collection of cells; the other six patients were untreated. Samples of leukemic cells obtained by BM aspiration or from PB were purchased from the AllCells corporation.
Initially, the leukemic cells from the BM of an 83-y-old white female who had progressed from myelodysplastic syndrome to frank AML were studied in the greatest detail because they were the most stem cell-like (M1) (16). A BM smear and FACS analysis showed that her BM was almost totally replaced by AML cells (greater than 93%) with a myeloid-to-erythroid ratio greater than 10:1. The myeloid cells had round or slightly indented nuclei and were of normal female karyotype. According to FACS analysis, the CD34+/CD13+/CD33+ population of cells represented 2.4% of the BM, and the CD34+/CD38− cell population represented 2.02%. Based on the morphology and the cell-surface phenotype, the leukemic cells were classified as M1 subtype (16).
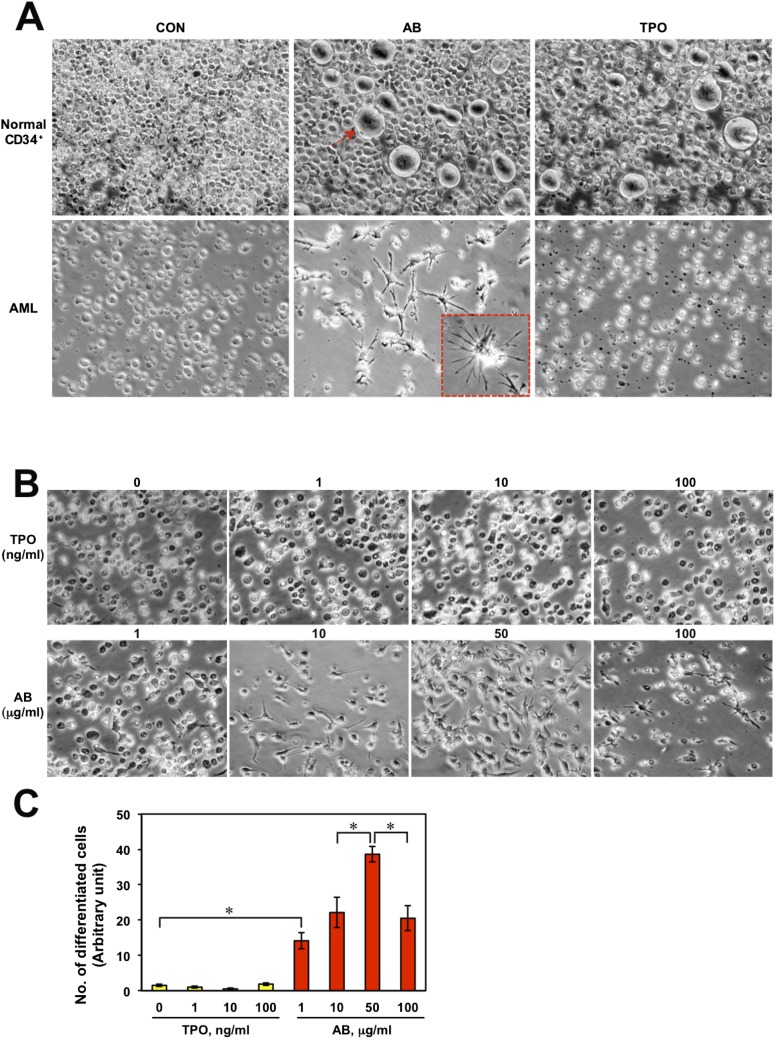
The effect of one of the 20 agonist antibodies on this sentinel patient’s AML cells was the most interesting. This agonist antibody, which is highly specific for the TPOR, induced the TPO lineage in normal BM cells but induced a dendritic cell phenotype in AML cells (Fig. S1A).
Fig. S1.
(A) Normal BM CD34+ cells and AML cells after 4 d culture in the presence of PBS, antibody (10 μg/mL), or TPO (10 ng/mL). The red arrow indicates a megakaryocyte. The red-boxed Inset shows an enlarged image of a differentiated cell. (B) The AML cells after 4 d culture with various concentrations of antibody (1–100 μg/mL) or TPO (0–100 ng/mL). (C) Eight microscopic areas in each panel in B were chosen arbitrarily, and the differentiated cell numbers were counted. Significant differences (*P < 0.05) were evaluated by one-way ANOVA.
Because of the immediate therapeutic potential of an antibody that induces a dendritic cell-like phenotype from AML cells, we studied it in more detail. In the initial phase of antibody induction, the target AML cells attached to the dish and expressed the dendritic cell marker CD11c (Fig. 1 B–H). Virtually no cells attached in the absence of antibody (Fig. 1A). Differentiation began on day 2 and appeared to be complete by day 4, at which time about 80% of the cells were converted. Because about 93% of the test cells were leukemic and about 80% of them were converted, it was obvious that the AML population was the source of the converted cells. This agonist antibody also was able to induce the formation of similar dendritic-like cells in five of the six other AML patients, including the one classified as M5, when their BM or PB was studied, indicating that the induction of the dendritic cell-like phenotype with this antibody may be generalizable to a majority of AML patients. Thus, we have an agonist antibody to the TPOR that displays receptor pleiotropism in that it induces the contrasting phenotypes of dendritic cell-like cells when AML cells are the starting population and megakaryocytes from normal BM cells.
Fig. 1.
Antibody-induced differentiation of AML BM cells. (A and B) Images of AML BM cells after treatment with PBS or antibody (10 μg/mL) for 4 d by microscopy. The arrow in B shows cell blebbing after a cell has been penetrated by filopodia from an antibody-induced differentiated cell. (C–E) Magnified images of fully differentiated cells in B. (F) Fluorescent microscopy images of the differentiated cells stained for CD11c (red). Nuclei were stained by Hoechst 33342 (blue). (G and H) Enlarged images of the CD11c+ differentiated cells.
A Killer Cell Phenotype
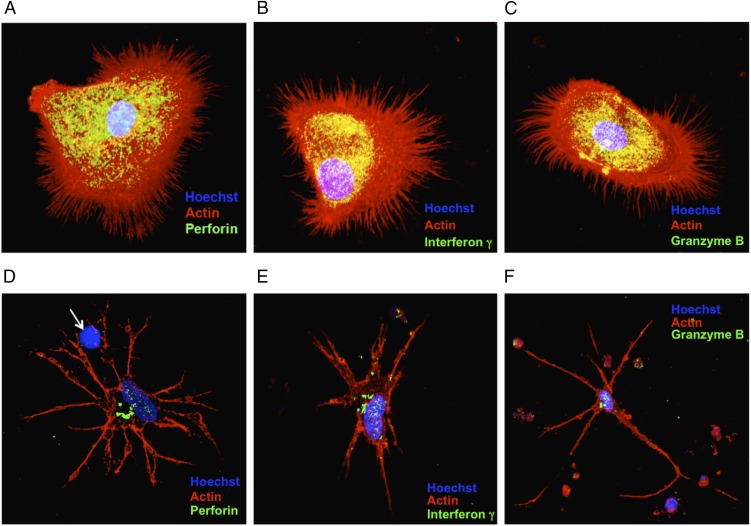
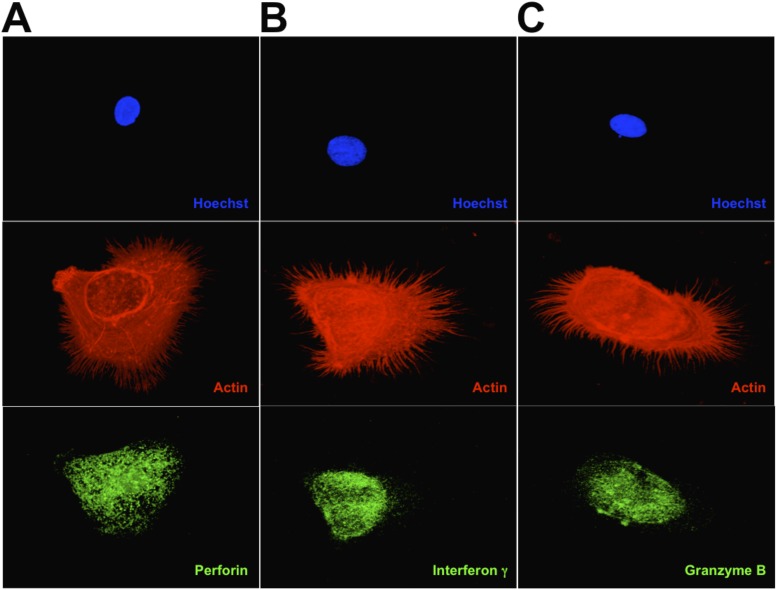
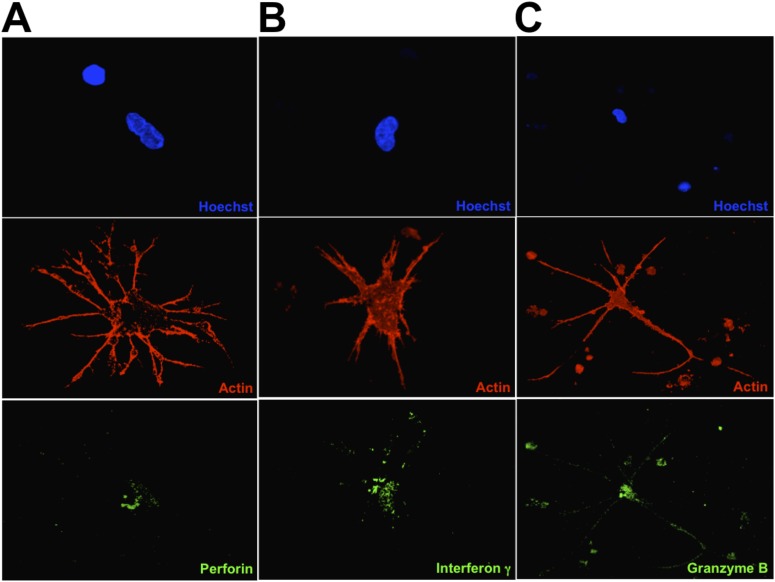
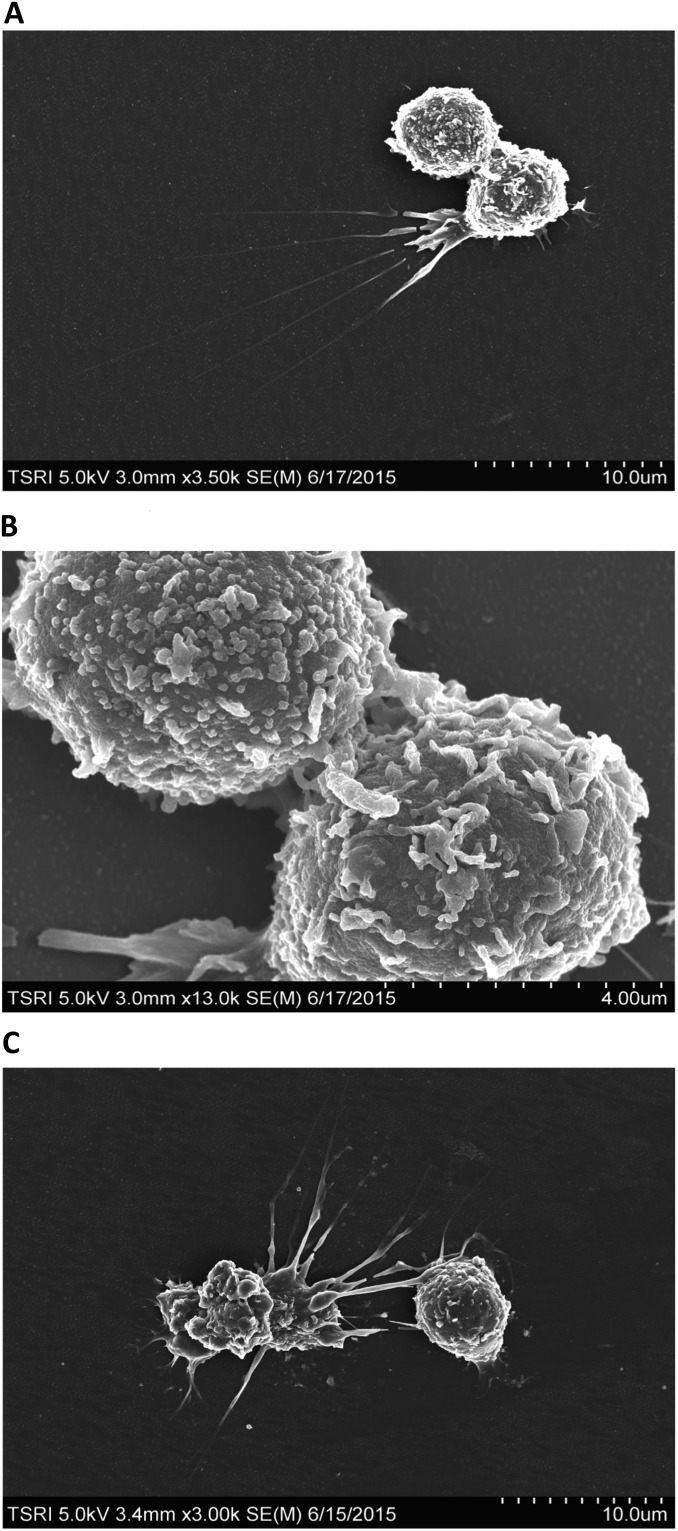
In the course of the many experiments that we carried out we noticed that the induced cells could have an early or late phenotype, depending on the time in culture and, to some extent, on whether the culture dishes were coated with collagen. When grown for short periods of time on collagen-coated dishes, the induced cells are rounded and have extensive, needle-like filopodia (Fig. 2 A–C). Furthermore, many cells appeared to penetrate other cells with these needle-like projections in a process that was followed by blebbing at the cell surface of the receiving cells (Fig. 1B, red arrow). Because these morphologies are similar to those classically associated with the killer cells of the immune system, we wondered whether the induced cells synthesize molecules such as perforin, IFN-γ, and granzyme B, proteins that are classically associated with cells that have the ability to kill other cells. Indeed, the induced cells produce large amounts of perforin, IFN-γ, and granzyme B (Fig. 2 A–C and Fig. S2). When grown for longer periods on glass surfaces, the induced cells display a more dendritic-like phenotype (Fig. 2 D–F and Fig. S3). Some of the projections from the induced dendritic-like cells appear to interact with the target cells and lyse them so that only the nuclei remain (Fig. 2D, white arrow). To gain further insight into the nature of the induced NK cells, we studied them by scanning electron microscopy (Fig. 3). In addition to observing the presence of mature cells, we were able to capture images that had the classical morphology of immature dendritic cells (Fig. 4). These cells often are referred to as “veiled” cells because instead of dendrites they express folded sheet-like structures or veils at their cell surface. Thus, we have a picture of an agonist antibody that induces a differentiation pathway in AML cells that starts with immature dendritic cells and proceeds through multiple stages, ultimately ending with the generation of killer cells. Given that all the induced leukemic cells make large amounts of molecules known to be associated with killer cells, we will refer to them here simply as “NK cells” (see Discussion).
Fig. 2.
The immunocytochemistry of differentiated AML cells. Nuclei were stained by Hoechst 33342 (blue). F-actin is labeled by rhodamine-phalloidin (red). (A–C) Early-stage differentiated cells visualized by confocal microscopy. The differentiated cells were stained for perforin (A), IFN-γ (B), or granzyme B (C). (D–F) Late-stage differentiated cells stained as in A–C, respectively. The white arrow in D points to a target cell nucleus from which cytoplasm has been stripped.
Fig. S2.
Deconvoluted images of the images in Fig. 2 A–C, respectively. A–C show the expression of perforin, interferon γ, and granzyme B, respectively.
Fig. S3.
Deconvoluted images of the images in Fig. 2 D–F, respectively. A–C show the expression of perforin, interferon gamma, and granzyme B, respectively.
Fig. 3.
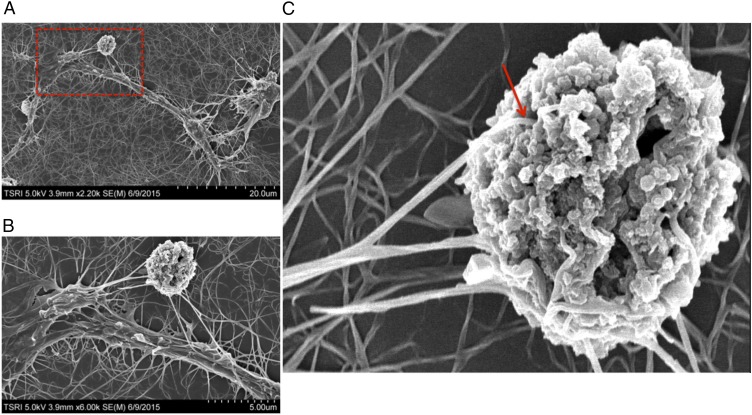
Scanning electron microscopy analysis of NK cells interacting with a target cell. (A) A representative scanning electron microscopy image of an NK cell interacting with an AML target cell. The NK cell was induced by treatment with antibody for 4 d. (B and C) Enlarged images of the area boxed in red in A. The red arrow in C indicates the dendrites of the NK cell penetrating into the target cell.
Fig. 4.
Scanning electron microscopy analysis of an induced immature dendritic cell.
NK Cell Induction Is Context Dependent
The antibody that induces killer cells was developed originally as a TPOR agonist (12). To confirm again the activity of the antibody in TPOR stimulation, the antibody or TPO was incubated with normal BM CD34+ cells. After day 4, the populations of gigantic, round, megakaryotic cells were increased significantly by both treatments (Fig. S1A), but no changes were observed in the untreated control group. To test whether, like the agonist antibody, TPO is capable of inducing NK cells from AML cells, we treated AML cells with 10 ng/mL of TPO or 10 μg/mL of antibody and observed the morphological changes (Fig. S1A). Importantly, only the antibody triggered the differentiation of the AML cells. To determine if the concentration of TPO simply is not sufficient to stimulate NK cell differentiation, we tested higher concentrations. Even at a 10-fold higher concentration (100 ng/mL), TPO did not induce the differentiation of AML cells into NK cells (Fig. S1 B and C). Based on these observations, it is likely that, although the two different agonists share the same target, induction of NK cell differentiation is dependent on cell context. That BM containing AML cells but not normal BM could be induced to generate NK cells again strongly supports the concept that AML cells are specifically induced by the antibody to form NK cells.
Tumor Cell Killing
Based on serial qualitative observations at the level of light microscopy, the induced cells appeared to insert cytoplasmic extensions into the neighboring, noninduced AML cells and kill them. To gain further information about the mechanism of killing, we studied the process by scanning electron microscopy. Multiple fine filopodia from the dendritic extensions of the killer cells attach to the target cells (Fig. S4). Some of these filopodia actually appear to enter the interior of the target cell through very obvious holes that presumably are generated at the site of attachment by molecules in these filopodia such as perforin (Fig. 3C, red arrow). Presumably perforin itself, granzyme B, and IFN-γ now access the cytoplasm of the target cells via the cytoplasmic extensions of the killer cells that have penetrated into the target cell interior. As observed by electron microscopy, the target cells now contain canyon-like fractures at their surface. These images support a killing mechanism similar to that studied in detail for NK cells (6).
Fig. S4.
Scanning electron microscopy analysis of differentiated cells. (A) Scanning electron microscopy analysis of an induced immature dendritic cell. (B) Enlarged image of the cell-to-cell interaction in A. (C) Scanning electron microscopy analysis of target cell capturing by NK cells. Note the length of the filopodia.
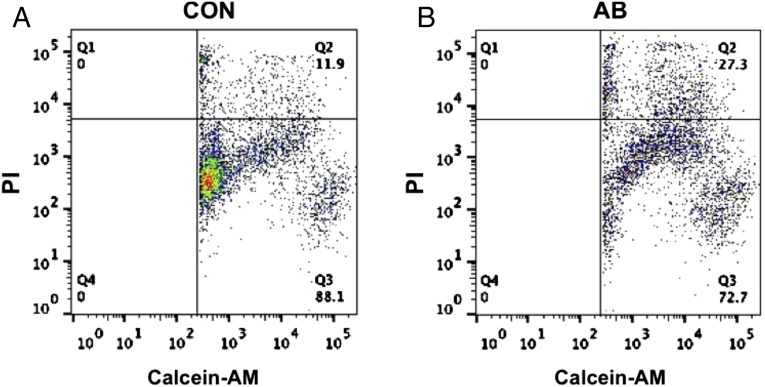
We quantitated the killing potential of the AML cells that were induced by the antibody into NK cells. To do so, we used a FACS-based cytotoxicity assay in which target cells in suspension that were fluorescently labeled with calcein-AM were cocultured with antibody-induced NK cells that were attached to the dish. The calcein-AM–labeled target AML cells were incubated with NK cells or control cultures for 24 h. Propidium iodide (PI) was used to identify the dead cells. Thus, cells that both stain for calcein-AM and are PI+ represent dead target cells. The FACS analysis showed that the induced NK cells specifically killed 13–16% the target cells per 24 h (Fig. 5). This degree of killing occurs even though the required format for these experiments afforded less than the optimal potential for cell–cell interaction between attached killer cells and target cells in suspension. As a test of specificity, we studied whether the induced NK cells would kill breast cancer cells. The breast cancer cell line MDA-MB-231 was cocultured with induced NK cells or undifferentiated AML cells as described above. Unlike the killing seen when AML cells are the targets, the induced NK cells did not specifically kill breast cancer cells, indicating that the requirement for killing goes beyond simple oncogenic transformation and may include a like–like recognition component.
Fig. 5.
Cytotoxic activity of the antibody-induced differentiated cells. AML cells were labeled with calcein-AM and cocultured for 4 h at 37 °C with NK cells (A) or undifferentiated cells (B). At the end of the incubation, dead cells were labeled with PI. The percentage of AML cell death was analyzed by a flow cytometer.
Different Signal Transduction Activation Kinetics
We analyzed the signal transduction pattern in AML cells after treatment with several doses of agonist antibody. In a previous study, we showed that the antibody induces rapid and strong signal transducer and activator of transcription 3 (STAT-3), protein kinase B (AKT), and extracellular signal-regulated kinase (ERK) phosphorylation in normal CD34+ hematopoietic stem cells. Similarly, in AML cells the antibody induces efficient STAT-3, AKT, and ERK phosphorylation (Fig. 6A). We tested the activation of phosphorylation at several time points using either the antibody or TPO. Both the antibody and TPO activated the phosphorylation of STAT-3 and ERK with similar kinetics, but AKT was different. Although the antibody increased the phosphorylation of AKT gradually, the activation of AKT phosphorylation with TPO was immediate and biphasic (Fig. 6 B and C). To determine the signaling pathway(s) necessary for NK cell differentiation by antibody, AML cells were cotreated with antibody and specific inhibitors of each signal pathway individually. Interestingly, antibody-induced NK cell differentiation was blocked significantly by the inhibitors of STAT-3 or PI3K that are upstream of AKT. However, the inhibitor of MEK that is upstream of ERK did not affect the differentiation of AML cells (Fig. 6 D and E). These observations suggest that two of the three main signaling pathways of the TPOR (STAT-3 and PI3K) are required for antibody induction of NK cell differentiation from AML cells.
Fig. 6.
Activation of TPOR signal transduction by antibody in AML cells. (A) After treatment with various doses of antibody or 10 ng/mL of TPO for 1 h, the phosphorylation of STAT-3, AKT, and ERK was analyzed by Western blotting using anti–p-STAT-3, anti–p-AKT, and anti–p-ERK antibodies. (B) TPOR signaling was tested at various times after antibody or TPO treatment. (C) The bands of AKT and p-AKT from B were analyzed quantitatively by densitometry (Image J). (D) AML cells after treatment with PBS or antibody (10 μg/mL) for 4 d in the presence of STAT-3, PI3K, or MAPK inhibitors. (E) The differentiated cell numbers were counted in eight arbitrarily chosen microscopic areas. Significant differences (*P < 0.05) were evaluated by one-way ANOVA.
Quantitative Gene-Expression Analysis
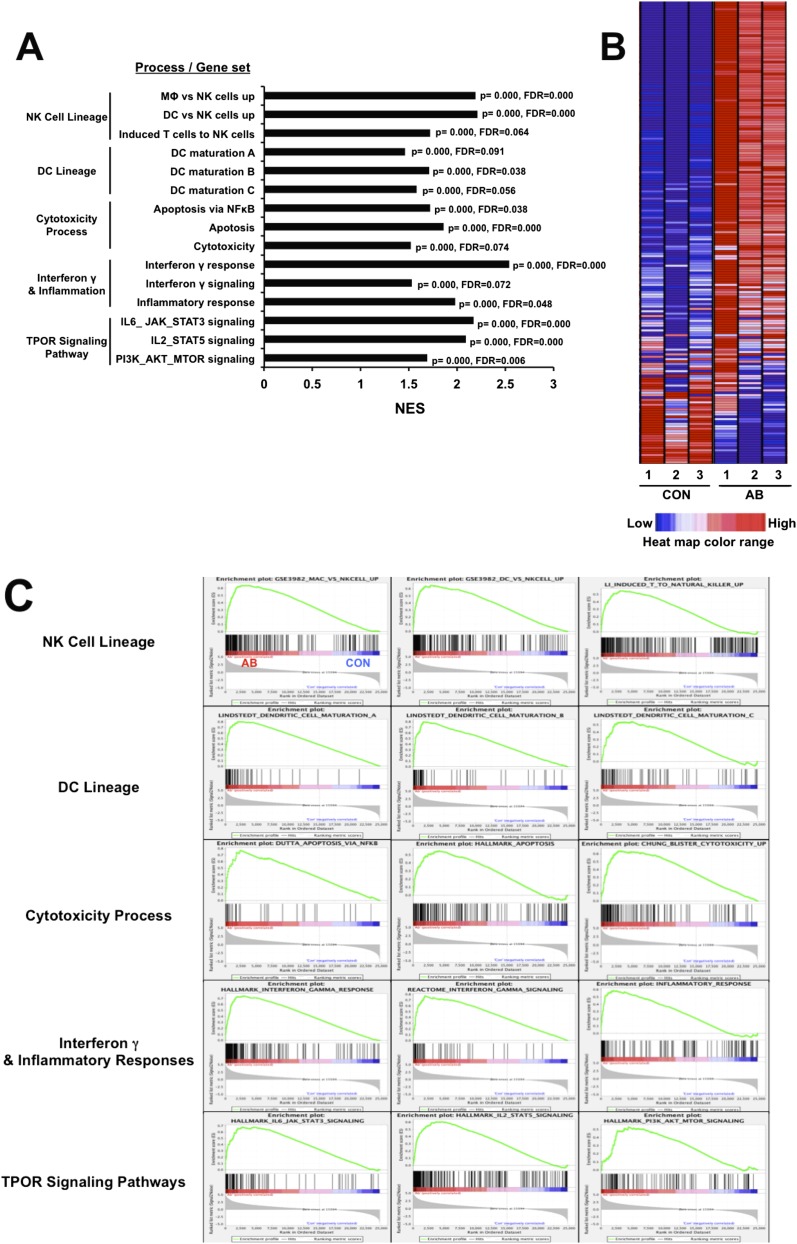
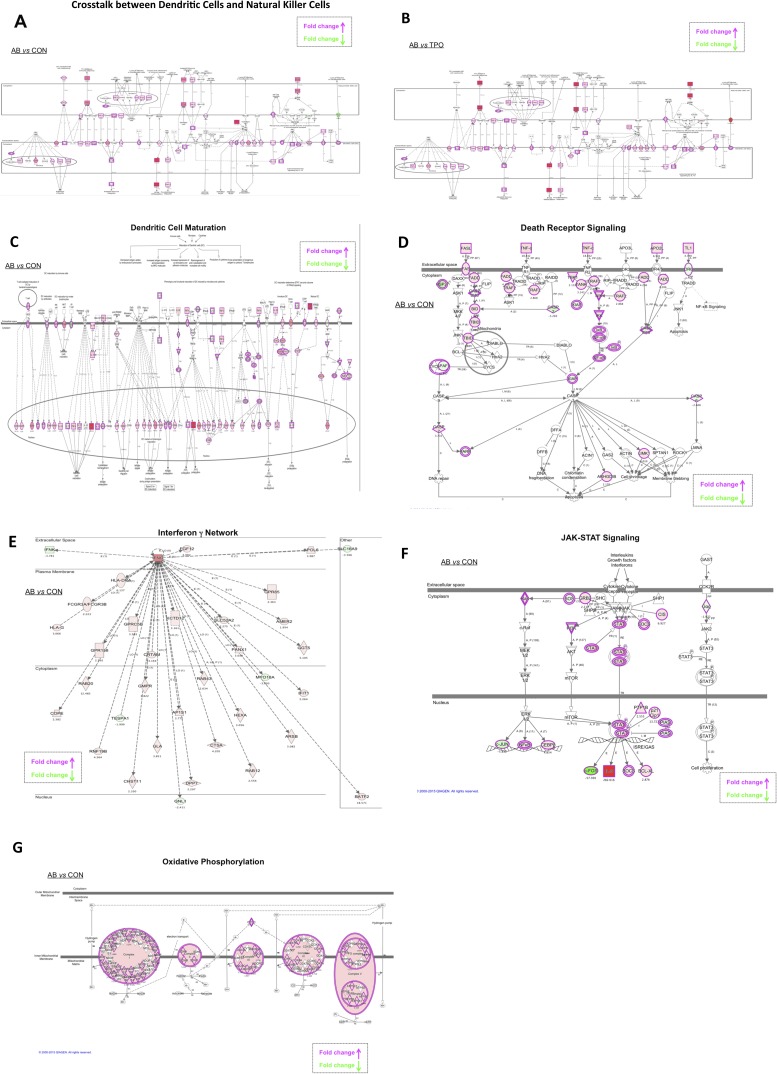
To gain more quantitative information about the gene expression that accompanies the differentiation of AML cells into NK cells and to characterize further the nature of the induced cells, whole-transcriptome shotgun sequencing (RNAseq) was carried out. Untreated cells were compared with those treated with either TPO or agonist antibody. The overall gene-expression profiles of the groups treated with the antibody or with TPO were very different. The number of differently expressed transcripts was 3,506 between the untreated and antibody-treated cells versus 1,902 between the untreated and TPO-treated cells with a false-discovery rate <0.1 and average log2 (count per million) >4 (Dataset S1). The whole transcriptome gene set enrichment analysis (GSEA) and ingenuity pathway analysis (IPA) showed that there were large increases in gene expression for molecules that encode genes associated with both developing and mature NK cells, including those associated with signal transduction. These changes include large increases in the dendritic cell markers such as CD80, CD83, CD86, CD123, and CCR7 and many NK markers of the death receptor pathway such as cell death surface receptor (FAS), FAS ligand, and tumor necrosis factor (TNF-α) (Figs. S5 and S6). The consequences of having both dendritic and NK cell markers are interesting, in that the IPA showed extensive crosstalk between dendritic cells and NK cells in the gene set induced by our antibody (Fig. S6 A and B). Moreover, after antibody treatment, but not in control experiments, both the GSEA and IPA revealed up-regulation of molecules associated with cytotoxicity (such as perforin and granzyme B), the IFN-γ response, inflammation, and death receptor and TPOR signaling (Figs. S5 and S6). Interestingly, many genes related to oxidative phosphorylation in mitochondria also were up-regulated in the antibody-treated cells compared with untreated cells (Fig. S6G). Probably, the killer cells have been reprogrammed to generate the large amounts of energy needed to synthesize killing molecules and deliver them. For instance, massive remodeling of the plasma membrane occurs in the conversion from AML to NK cells. In toto, the RNAseq analysis confirmed and added to the data obtained by morphological and immunocytochemical analysis.
Fig. S5.
Quantitative gene-expression analysis by RNAseq. The mRNA from three separate samples of control or antibody-treated AML cells was analyzed by whole-transcriptome sequencing. (A) A summary of key results for significantly enriched gene sets associated with the biological properties of NK cells or the TPOR signaling pathway. The normalized enrichment score (NES) accounts for differences in gene size and allows comparison across gene sets. (B) A representative heat map of the macrophage vs. NK cells gene set; red, up-regulated; blue, down-regulated. (C) Enrichment plots of GSEA key results. The results for significantly enriched gene sets associated with the biological process listed in A are shown. In the plots, all transcripts were statistically rank-ordered from left to right by decreasing relative expression level in antibody-treated vs. untreated cells. Gray histograms show phenotype correlation values for the ranked genes as signal-to-noise ratios. The histograms are positive for mRNAs enriched in antibody-treated samples and negative for mRNAs from untreated samples. Vertical lines above the histograms denote the positions of individual mRNAs within the considered gene set in the ranked list of all mRNAs. Red and blue horizontal bars mark mRNAs whose expression levels correlate positively (red) or negatively (blue) with the phenotype seen after antibody treatment. Green curves show running enrichment scores for the gene set as the analysis moves down the ranked gene list. Peak asymmetry correlates with enrichment (left shift) or underrepresentation (right shift) of the respective gene set in antibody-treated samples. FDR, false discovery rate; p, nominal P value.
Fig. S6.
IPA of the whole transcriptome. (A and B) Analysis of crosstalk between dendritic cells and natural killer cells. Transcriptomes of antibody-treated vs. untreated (A) or antibody-treated vs. TPO-treated samples (B) were analyzed. Up-regulated interactions are shown in red, and suppressed interactions are shown in green. Color intensity is relative to expression level. Genes along canonical pathways that were not changed at transcript level are not colored. The arrows point in the direction of positive regulation. (C–G) Analyses of dendritic cell maturation (C), death receptor signaling (D), IFN-γ network (E), JAK-STAT signaling (F), and oxidative phosphorylation (G).
IPA Analysis of the Mechanistic Network
Aside from understanding the initiating events and identifying effector molecules, we were interested in the mechanism of the antibody-induced conversion of AML cells to NK cells. This conversion doubtless involves differential activation of signal transduction pathways (see above). To predict a mechanistic network, we used the Upstream Analysis feature in IPA software. Upstream Analysis is based on prior knowledge of expected effects between transcriptional regulators and their target genes collected in the Ingenuity Knowledge Base. This database includes Expression, Transcription, and Protein–DNA binding relationships. Activation Z-score and Overlap P value are two statistical measures to identify and rank significant regulators. The list of genes differentially expressed in the untreated and antibody-treated cells with a false-discovery rate <0.1 and average log2 (count per million) >4 was analyzed in IPA (∼3,500 differentially expressed genes). Interestingly, the Upstream Analysis ranked STAT1 among top five upstream transcription regulators based on activation Z-score, and STAT3 was ranked third based on Overlap P value. In fact, there are 98 targets of STAT1 (overlap P value <8.58 E-20) and 153 targets of STAT3 (overlap P value <2.02 E-24) in the list of differentially expressed genes. The mechanistic network derived from the STAT1 analysis includes upstream regulators such as STAT3, V-Rel avian reticuloendotheliosis viral oncogene homolog A (RELA), IFNG, IL1B, interferon regulatory transcription factor (IRF1), IRF8, IRF9, JUN, MYC, NFKB1, NFKBIA, and SPI1, which are predicted to be activated or inhibited based on a computationally generated directional network. However, this analysis does not require that all the upstream regulators be changed significantly. The mechanistic network derived from the STAT3 analysis, which shares many genes with the STAT1 network, includes upstream regulators such as STAT1, RELA, interferon-γ (IFN-γ), IL1B, IRF1, IRF7, JUN, NFKB1, NFKBIA, IL6, TNF, NR3C1, and IFN-α.
From a mechanistic point of view, the presence of STAT1 and STAT3 will allow the formation of the heterodimer that binds to the IFN-γ–activated sequence promoter element. Interestingly, using Genomatix software (www.genomatix.de/), we also were able to identify the V$STAT transcription factor binding site family as the second highest overrepresented binding site family in the promoter regions of the top 500 up-regulated genes in the antibody-treated cells.
Discussion
We have described an agonist antibody to a cytokine receptor, TPOR, which efficiently induces activated NK cells from precursor leukemic cells isolated from the PB or BM of several different AML patients. There is much evidence that the TPOR is the identified target of the antibody as opposed to some off-target interaction. First, there is no induction of signaling pathways in the indicator cells when TPOR is knocked out (12). Second, induction of NK cells is confined to AML cells, so, if there were an off-target response, the antigen would have to be unique to AML cells and not present in normal BM. Finally, analysis of the activation of signal transduction pathways by phosphorylation and RNAseq showed that the signaling pathway components activated by the antibody were the same as those activated by TPO.
The induced cells have both dendritic and NK cell markers. When killer cells with dendritic cell markers, as seen here, were first described, they were thought to represent a unique cell type sometimes called “killer dendritic cells” (17–20). However, current evidence suggests they simply may be highly activated NK cells (21). One caveat to this simplification is that, because of the unusual mode of induction by antibodies and the degeneracy of signal transduction pathways, we may uncover cells with phenotypes that do not normally exist. Thus, the induced cells may have a novel chimeric phenotype.
We suspect that the ability to generate enriched populations of NK cells will assist in the next generation of cancer immunotherapy. In the simplest case one would inject the agonist antibody into patients in the hope that the enriched population of NK cells would use their innate ability to recognize tumor cells and kill them. Of course, if the innate tumor recognition potential is not sufficiently specific and/or strong enough, a recognition element such as an antibody expressed on the cell surface could be added. However, if this addition becomes necessary, one loses the workflow advantage of a simple injection.
The ability to induce some members of an AML clone to become NK cells that kill other members of the clone is particularly intriguing. In effect, it is likely a dynamic process at the population level where a uniform population of cancer cells is converted to a mixture of targets and killers. Because the cancer cells kill one another and because, presumably, any member of the clonal population can be converted to a killer cell within time, the entire malignant clone should be eliminated. Thus, assuming that an escape mechanism is not activated, any growth of the tumor is both a problem—because there are more tumor cells—and a solution to the problem—because there are more substrate cells that can be converted to killer cells.
One complication concerning the eradication of tumor cells by activating NK cells is the issue of tumor evasion from NK surveillance (3, 4, 22–25). This problem is centered on the central concept that, unlike T and B cells, NK cells do not recognize foreign antigens but instead recognize alterations in “self” surface molecules such as the MHC class 1 molecules. This “missing self” hypothesis immediately points to how tumors might escape NK cell detection by restoring molecules that are part of self-recognition (3, 4, 22–25). Indeed, there is a host of positive and negative regulators of NK function (26). In the case of lymphomas, it has been shown that tumor cells can escape detection in vivo but not in vitro by down-regulation of the NKG2D receptor (3, 5, 6, 26). They propose a two-step model of killing in which one step involves the activation of the NK cells to produce molecules such as IFN-γ and a second cytotoxic step involves the engagement of the NKG2D receptor. Nevertheless, there is room for optimism, because, despite the possibility of escape from NK surveillance, alloreactive NK cells derived from hematopoietic stem cell transplants increased patient survival and prevented relapse in patients with myeloid leukemia (3, 23, 27). Thus, if escape from surveillance becomes an issue, it might be necessary to activate allogeneic cells or endow activated autologous NK cells with tumor specificity by expressing a tumor-specific antibody on their surface.
An important question raised by these experiments is why some antibody agonists to known cytokine receptors cause the target cells to differentiate along a pathway that is different from that induced by the natural agonist. A likely explanation is that cell differentiation and development are controlled by a combinatorial matrix of otherwise degenerate signal transduction factors that take into account not only the identity of the members of the matrix but also their concentration, the relative ratio between them, and their binding energy for their targets. Once one thinks in terms of a combinatorial matrix of molecules, several consequences follow. First, one does not need a very large number of individual molecules to regulate cell fate. Essentially, this method is how the acquired immune system generates massive diversity from a limited number of genes by combinatorial association of antibody gene segments and random pairing of heavy chains with light chains. Second, in terms of molecular regulatory mechanisms, the differences in pathways leading to vastly different phenotypes may actually be quite subtle and more related than previously thought. Thus, a small change in the activation levels of signaling molecules might suffice to change the differentiation pathway. In terms of mechanism, a likely possibility is that, as seen here, antibody binding induces activation kinetics very different from those of the natural ligand. Given that signal transduction pathways are degenerate, a normal agonist that is highly tuned by evolution to induce a precise route of differentiation may be very different from an antibody with picomolar to nanomolar binding affinity: the agonist may bind longer to the receptor, leading to a more sustained signal. These differences in binding energy ultimately may lead to the subtle differences that send the cells along different pathways. The differences in activation kinetics could result from differences in affinity, bivalency, altered receptor configuration, differences in receptor internalization, or a combination of all these factors. All these considerations concern the antibody side of the interaction. There is, of course, the possibility of structural polymorphism in the receptor so that different polymorphs are present in different stem cells or in stem cells at different stages of differentiation. Indeed, we have already shown here that the ability to induce NK cells is context dependent, in that the TPOR agonist antibody will induce NK cells starting with AML cells but not with normal CD34+ cells, in which megakaryocytes are induced instead. The general ability to treat AML with the induction of NK cells depends, among other things, on the expression frequency of TROR on AML cells. Takeshita et al. (28) showed in a study of 128 patients that the TPOR was expressed in 47% of 114 AML cases, suggesting that about half of patents with AML might respond to the agonist antibody. By contrast, the TPOR was expressed in only 2 of 14 cases of acute lymphocytic leukemia. Finally, the studies reported here add weight to the concept of educating cancer cells, rather than killing them, as illustrated in the important studies of Chen and colleagues (29, 30), who showed that a combination of all-trans retinoic acid and arsenic trioxide could induce a high-quality remission in acute promyelocytic leukemia, presumably by inducing a change in the state of differentiation of the tumor cells.
Materials and Methods
The human cell samples derived from patients and healthy individuals were purchased from a commercial cell bank (AllCells Inc., Alameda, CA; www.allcells.com). According to the Scripps Office for the Protection of Research Subjects Clinical Research Services, the study is not human subjects research and does not require oversight by the Scripps Institutional Review Board. Generation and purification of antibodies and the methods for cell culture, immunohistochemistry, flow cytometry, Western blotting, electron microscopy, and RNAseq analysis are detailed in SI Materials and Methods.
SI Materials and Methods
Expression and Purification of Antibodies.
The expression vector containing the antibody gene was transfected into 293F cells (Life Technology). Antibodies from the pooled supernatants were purified using HiTrap Protein G HP columns with ÄKTAxpress purifier (GE Healthcare Life Sciences). The buffer was exchanged to Dulbecco’s PBS (pH 7.4) (Life Technologies), and the purified antibodies were stored at 4 °C.
Culture of AML Cells.
Human AML BM and PB cells derived from patients and healthy individuals were obtained from a commercial cell bank (AllCells Inc., Alameda, CA; www.allcells.com). AML cells were cultured in StemSpan serum-free media from Stemcell Technologies supplemented with streptomycin and penicillin.
Immunocytochemistry.
Cells were fixed with 4% (vol/vol) paraformaldehyde at room temperature for 15 min, blocked and stained with specific antibodies, followed by fluorophore-conjugated secondary antibody staining with Hoechst 3342 (Cell Signaling) and rhodamine-phalloidin (Life Technologies). Incubation with all antibodies was carried out for 30 min at room temperature. After cells were washed three times for 5 min each washing, images were collected using a confocal microscope.
Flow Cytometry.
After coculture, killer cells and calcein-AM–labeled target cells were stained with PI (Life Technologies) to identify dead cells and were washed with PBS. For quantification, stained cells were sorted with an LSRII flow cytometer (Becton Dickinson).
Western Blotting.
To prepare total cell lysates, AML BM cells were washed with PBS and then were lysed in lysis buffer [50 mM Hepes (pH 7.2), 150 mM NaCl, 50 mM NaF, 1 mM Na3VO4, 10% (vol/vol) glycerol, 1% (vol/vol) Triton X-100]. The lysates then were centrifuged at 16,000 × g for 15 min at 4 °C to remove aggregates, and the soluble proteins were denatured in Laemmli sample buffer (5 min at 95 °C) and then were separated by SDS/PAGE. The proteins were transferred to nitrocellulose membranes using the iBlot blotting system from Invitrogen and were blocked in PBS and Tween-20 (PBST) containing 5% (wt/vol) BSA for 1 h before being incubated with antibodies overnight at 4 °C. After the membranes were washed several times with PBST, the blots were incubated with HRP-conjugated anti-human or anti-rabbit antibody for 1 h. The membranes then were washed with PBST and developed by ECL. The anti–STAT-3, anti–p-STAT-3 (Tyr-705), anti-AKT, anti–p-AKT (Thr-308), anti-ERK1/2, and anti–p-ERK1/2 (Thr-202/Tyr-204) antibodies were purchased from Cell Signaling.
Electron Microscopy.
The cells were fixed in 2.5% (vol/vol) glutaraldehyde in 0.1 M cacodylate buffer, and a small volume was placed on a 13-mm Whatman PC filter. The cells were rinsed on the filter with PBS. The entire double filter then was clamped between nylon washers, and the unit was placed in 1% (wt/vol) osmium tetroxide. After a PBS and water wash, the entire unit was dehydrated in an ethanol and placed in a critical point dryer. The nylon washers then were dismantled, the filters were separated, and both filters were mounted onto scanning electron microscope stubs with carbon tape. The stubs with attached filters then were sputter coated with iridium for subsequent examination and documentation on an Hitachi S-4800 scanning electron microscope (Hitachi High Technologies).
RNAseq and Bioinformatic Analysis.
We prepared three replicas of RNA from AML cells after treatment with PBS, antibody, or TPO. RNAseq libraries were prepared with NuGEN Ovation RNA-Seq System V2. RNA was sequenced using an Illumina HISeq Analyzer 2000, Casava v1.8.2 genome analyzer pipeline, TopHat v1.4.1/Bowtie2 genome-alignment, and Partek v6.6 mRNA annotation software. Statistical analyses were done with edgeR (Bioconductor), excluding genes with false-discovery rates >0.10, log2 (counts per million) >4. GSEA was performed with gene set permutation, using gene sets from MSigDB (www.broadinstitute.org/gsea/msigdb/index.jsp) or were manually curated from excluding genes without Human Genome Organisation (HUGO)-approved symbols. We examined the molecular interactions to confirm the GSEA data that were captured previously. The differentially expressed genes were analyzed further using the IPA software (Ingenuity Systems; www.ingenuity.com). This all-in-one web-based software makes use of the ingenuity pathways knowledge base (IPKB) to generate interaction networks of focus genes based on manually curated information reported in the literature.
Statistical Analysis.
The data are expressed as the means ± SE. Statistical analysis was performed using the Student's t test or by one-way ANOVA and the post hoc test. P values <0.05 were considered significant.
Supplementary Material
Acknowledgments
We thank Dr. Ian Wilson and Dr. Rajesh Grover for their suggestions on the manuscript and Dr. Malcolm R. Wood for the electron microscopic studies. This work was supported by the JPB foundation and Zebra Biologics.
Footnotes
Conflict of interest statement: R.A.L. is a founder of Zebra biologics.
This article contains supporting information online at www.pnas.org/lookup/suppl/doi:10.1073/pnas.1519079112/-/DCSupplemental.
References
- 1.Kershaw MH, Westwood JA, Darcy PK. Gene-engineered T cells for cancer therapy. Nat Rev Cancer. 2013;13(8):525–541. doi: 10.1038/nrc3565. [DOI] [PubMed] [Google Scholar]
- 2.Maus MV, Grupp SA, Porter DL, June CH. Antibody-modified T cells: CARs take the front seat for hematologic malignancies. Blood. 2014;123(17):2625–2635. doi: 10.1182/blood-2013-11-492231. [DOI] [PMC free article] [PubMed] [Google Scholar]
- 3.Waldhauer I, Steinle A. NK cells and cancer immunosurveillance. Oncogene. 2008;27(45):5932–5943. doi: 10.1038/onc.2008.267. [DOI] [PubMed] [Google Scholar]
- 4.Lanier LL. NK cell receptors. Annu Rev Immunol. 1998;16:359–393. doi: 10.1146/annurev.immunol.16.1.359. [DOI] [PubMed] [Google Scholar]
- 5.Childs RW, Carlsten M. Therapeutic approaches to enhance natural killer cell cytotoxicity against cancer: The force awakens. Nat Rev Drug Discov. 2015;14(7):487–498. doi: 10.1038/nrd4506. [DOI] [PubMed] [Google Scholar]
- 6.Cheng M, Chen Y, Xiao W, Sun R, Tian Z. NK cell-based immunotherapy for malignant diseases. Cell Mol Immunol. 2013;10(3):230–252. doi: 10.1038/cmi.2013.10. [DOI] [PMC free article] [PubMed] [Google Scholar]
- 7.Xie J, Zhang H, Yea K, Lerner RA. Autocrine signaling based selection of combinatorial antibodies that transdifferentiate human stem cells. Proc Natl Acad Sci USA. 2013;110(20):8099–8104. doi: 10.1073/pnas.1306263110. [DOI] [PMC free article] [PubMed] [Google Scholar]
- 8.Xie J, et al. Prevention of cell death by antibodies selected from intracellular combinatorial libraries. Chem Biol. 2014;21(2):274–283. doi: 10.1016/j.chembiol.2013.12.006. [DOI] [PubMed] [Google Scholar]
- 9.Yea K, et al. Converting stem cells to dendritic cells by agonist antibodies from unbiased morphogenic selections. Proc Natl Acad Sci USA. 2013;110(37):14966–14971. doi: 10.1073/pnas.1313671110. [DOI] [PMC free article] [PubMed] [Google Scholar]
- 10.Yea K, Xie J, Zhang H, Zhang W, Lerner RA. Selection of multiple agonist antibodies from intracellular combinatorial libraries reveals that cellular receptors are functionally pleiotropic. Curr Opin Chem Biol. 2015;26:1–7. doi: 10.1016/j.cbpa.2015.01.002. [DOI] [PubMed] [Google Scholar]
- 11.Zhang H, Wilson IA, Lerner RA. Selection of antibodies that regulate phenotype from intracellular combinatorial antibody libraries. Proc Natl Acad Sci USA. 2012;109(39):15728–15733. doi: 10.1073/pnas.1214275109. [DOI] [PMC free article] [PubMed] [Google Scholar]
- 12.Zhang H, et al. Selecting agonists from single cells infected with combinatorial antibody libraries. Chem Biol. 2013;20(5):734–741. doi: 10.1016/j.chembiol.2013.04.012. [DOI] [PubMed] [Google Scholar]
- 13.Lerner RA, et al. Antibodies from combinatorial libraries use functional receptor pleiotropism to regulate cell fate. Q Rev Biophys. 2015 doi: 10.1017/S0033583515000049. [DOI] [PubMed] [Google Scholar]
- 14.Graf T. Differentiation plasticity of hematopoietic cells. Blood. 2002;99(9):3089–3101. doi: 10.1182/blood.v99.9.3089. [DOI] [PubMed] [Google Scholar]
- 15.Graf T. Historical origins of transdifferentiation and reprogramming. Cell Stem Cell. 2011;9(6):504–516. doi: 10.1016/j.stem.2011.11.012. [DOI] [PubMed] [Google Scholar]
- 16.Bennett JM, et al. Proposals for the classification of the acute leukaemias. French-American-British (FAB) co-operative group. Br J Haematol. 1976;33(4):451–458. doi: 10.1111/j.1365-2141.1976.tb03563.x. [DOI] [PubMed] [Google Scholar]
- 17.Chauvin C, Josien R. Dendritic cells as killers: Mechanistic aspects and potential roles. J Immunol. 2008;181(1):11–16. doi: 10.4049/jimmunol.181.1.11. [DOI] [PubMed] [Google Scholar]
- 18.Chan CW, et al. Interferon-producing killer dendritic cells provide a link between innate and adaptive immunity. Nat Med. 2006;12(2):207–213. doi: 10.1038/nm1352. [DOI] [PubMed] [Google Scholar]
- 19.Wesa AK, Storkus WJ. Killer dendritic cells: Mechanisms of action and therapeutic implications for cancer. Cell Death Differ. 2008;15(1):51–57. doi: 10.1038/sj.cdd.4402243. [DOI] [PubMed] [Google Scholar]
- 20.Chen L, et al. Natural killer dendritic cells are an intermediate of developing dendritic cells. J Leukoc Biol. 2007;81(6):1422–1433. doi: 10.1189/jlb.1106674. [DOI] [PubMed] [Google Scholar]
- 21.Vosshenrich CA, et al. CD11cloB220+ interferon-producing killer dendritic cells are activated natural killer cells. J Exp Med. 2007;204(11):2569–2578. doi: 10.1084/jem.20071451. [DOI] [PMC free article] [PubMed] [Google Scholar]
- 22.Piontek GE, et al. YAC-1 MHC class I variants reveal an association between decreased NK sensitivity and increased H-2 expression after interferon treatment or in vivo passage. J Immunol. 1985;135(6):4281–4288. [PubMed] [Google Scholar]
- 23.Ljunggren HG, Kärre K. In search of the ‘missing self’: MHC molecules and NK cell recognition. Immunol Today. 1990;11(7):237–244. doi: 10.1016/0167-5699(90)90097-s. [DOI] [PubMed] [Google Scholar]
- 24.Kärre K, Ljunggren HG, Piontek G, Kiessling R. Selective rejection of H-2-deficient lymphoma variants suggests alternative immune defence strategy. Nature. 1986;319(6055):675–678. doi: 10.1038/319675a0. [DOI] [PubMed] [Google Scholar]
- 25.Ljunggren HG, Kärre K. Host resistance directed selectively against H-2-deficient lymphoma variants. Analysis of the mechanism. J Exp Med. 1985;162(6):1745–1759. doi: 10.1084/jem.162.6.1745. [DOI] [PMC free article] [PubMed] [Google Scholar]
- 26.Pegram HJ, Andrews DM, Smyth MJ, Darcy PK, Kershaw MH. Activating and inhibitory receptors of natural killer cells. Immunol Cell Biol. 2011;89(2):216–224. doi: 10.1038/icb.2010.78. [DOI] [PubMed] [Google Scholar]
- 27.Hsu KC, et al. Improved outcome in HLA-identical sibling hematopoietic stem-cell transplantation for acute myelogenous leukemia predicted by KIR and HLA genotypes. Blood. 2005;105(12):4878–4884. doi: 10.1182/blood-2004-12-4825. [DOI] [PMC free article] [PubMed] [Google Scholar]
- 28.Takeshita A, et al. Quantitative expression of thrombopoietin receptor on leukaemia cells from patients with acute myeloid leukaemia and acute lymphoblastic leukaemia. Br J Haematol. 1998;100(2):283–290. doi: 10.1046/j.1365-2141.1998.00558.x. [DOI] [PubMed] [Google Scholar]
- 29.Shen ZX, et al. All-trans retinoic acid/As2O3 combination yields a high quality remission and survival in newly diagnosed acute promyelocytic leukemia. Proc Natl Acad Sci USA. 2004;101(15):5328–5335. doi: 10.1073/pnas.0400053101. [DOI] [PMC free article] [PubMed] [Google Scholar]
- 30.Wang ZY, Chen Z. Acute promyelocytic leukemia: From highly fatal to highly curable. Blood. 2008;111(5):2505–2515. doi: 10.1182/blood-2007-07-102798. [DOI] [PubMed] [Google Scholar]
Associated Data
This section collects any data citations, data availability statements, or supplementary materials included in this article.


