Significance
Providing a detailed classification of the types of citations that an article receives is important to establish the quality of a study and to characterize how current research builds upon prior work. The methodology that we propose also informs how to improve the citation process, for example by having scientists attach additional metadata to their citations. The approach is scalable to other fields and periods and can also be used to identify other types of citations (e.g., reuse of methods, materials, empirical tests of theory, and so on). Finally, our methods provide online repositories such as Google Scholar, PubMed, ISI Web of Science, and Scopus with a way to improve their search and ranking algorithms.
Keywords: social studies of science, citation analysis, bibliometric techniques, natural-language processing, negative citations
Abstract
Citations to previous literature are extensively used to measure the quality and diffusion of knowledge. However, we know little about the different ways in which a study can be cited; in particular, are papers cited to point out their merits or their flaws? We elaborated a methodology to characterize “negative” citations using bibliometric data and natural language processing. We found that negative citations concerned higher-quality papers, were focused on a study’s findings rather than theories or methods, and originated from scholars who were closer to the authors of the focal paper in terms of discipline and social distance, but not geographically. Receiving a negative citation was also associated with a slightly faster decline in citations to the paper in the long run.
Scientific knowledge is a key input for economic prosperity (1–3) and evolves thanks to the complementary contributions of different scientists. The norms that regulate the scientific community coordinate this endeavor (4–6).
Citation of previous work is one such norm and a major means of documenting the collective and cumulative nature of knowledge production. Citations allow for the establishment of credit and the identification of scientific paradigms and their shifts (7, 8); they measure the impact and quality of discoveries and, by extension, of a researcher, an institution, or a journal (9, 10). Studies rely on citation data also to analyze the diffusion of scientific ideas, the creation and evolution of scientific networks, and the role of top scientists and inventions (11–17).
Less attention has been devoted to the different intentions behind a citation. In particular, although papers may often be cited because a current study is consistent with past work or builds upon it, a reference can sometimes be made to point out limitations, inconsistencies, or flaws that are even more serious. These “negative” citations may question or limit the scope and impact of a contribution, a scholar, or an entire line of research. Criticisms expressed through citations could also be part of the “falsification” process that, according to Karl Popper, characterizes science and could be a signal of the solidity of a field (18). For example, the recent criticisms and eventual dismissal of the evidence of gravitational waves and ultrafast expansion of the universe in the “big bang” were interpreted as developments in the study of the origins of the universe (19). Even for findings that are eventually confirmed, critiques may be beneficial in the process. For instance, the Copernican revolution benefited from and was refined by Tycho Brahe’s observations about inconsistencies in the heliocentric view, despite the eventual falsification of Brahe’s theory (20).
A thorough classification and understanding of different types of citations, and in particular of negative citations—their incidence, distribution within research fields and across time, their location within a paper, and the connections that they establish between studies and scholars—is therefore a valuable exercise to understand the evolution of science. This enhanced classification may also offer current repositories of scholarly work (such as Google Scholar, PubMed, ISI Web of Science, and Scopus) an opportunity to improve their search and ranking algorithms; by extracting more information from citations, we can uncover more information, reject false knowledge more rapidly, and ultimately enhance the scientific discourse.
Such a classification, however, is difficult to perform and would have been impossible just a few years ago. Recent advancements in natural-language processing (NLP) (21) and in the ability to parse and analyze large bodies of text, however, now allow us to reconstruct the context in which a citation was made, and therefore to understand why a given study was cited in the first place.
We developed a method to identify citations that question the validity of previous results and to analyze their incidence and patterns to determine their role, relevance, and impact using bibliometric data, NLP techniques, and domain experts. In this study we provide evidence of (i) how negative citations are expressed, (ii) their incidence or frequency, (iii) the types of papers that receive these critiques and the types of papers that make the critiques, (iv) the parts of a study that are negatively cited (e.g., the theory, the results, the implications, etc.), (v) the relationships between the citing and cited authors, and (vi) the consequences of a negative citation in terms of future citations. To guarantee homogeneity of the analysis and define a feasible testing ground, the analysis in this paper was based on 15,731 full-text articles in the Journal of Immunology (1998–2007) and the 762,355 citations contained in those papers. Details of our procedures are in Materials and Methods and Supporting Information.
Results
Out of 762,355 citations from 15,731 articles in the Journal of Immunology (1998–2007), we identified 18,304 as negative (about 2.4% of the total). The 762,355 citations referred to 146,891 unique papers, and of these papers 10,405 (about 7.1%) received at least one negative citation. Thus, although the incidence on a per-citation basis is relatively low, a nontrivial number of papers received at least one negative citation. On the one hand, the low frequency may be evidence of a limited, uninfluential role of negative citations, or of the high social cost of making them. On the other hand, these citations represent a nonnegligible share of the total in our data and, as such, could play an important role in limiting and correcting previous results, thus helping science progress (5, 18). Several features of these citations, described below, lend support to the latter hypothesis, that is, that negative citations have unique functions and deserve consideration.
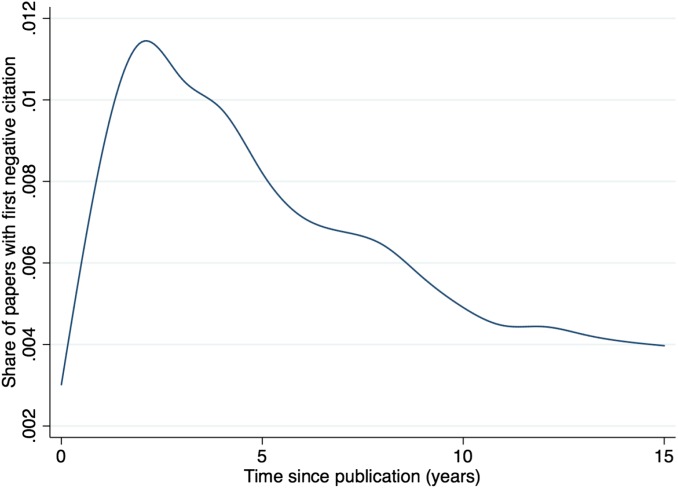
First, Fig. 1 shows that the likelihood of receiving a negative citation was higher in the first few years after a paper was published; this is arguably the period in which the underlying science was potentially more novel, untested, and worthy of more attention and scrutiny.
Fig. 1.
Share of articles receiving their first negative citation at a given age (years).
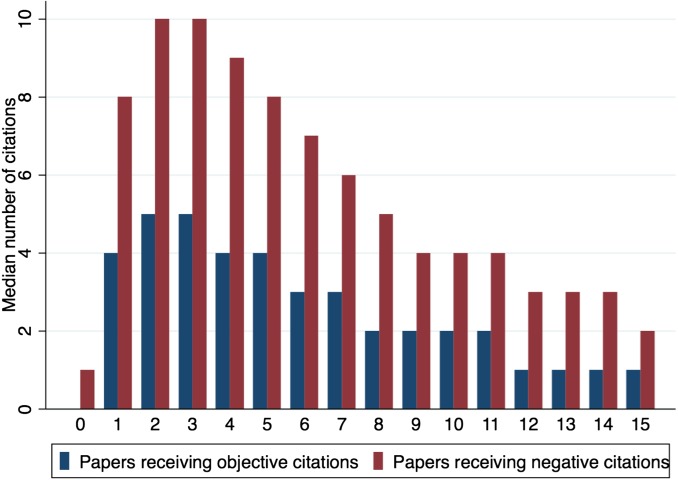
Second, and consistent with negative citations emerging when enough attention is given to a paper, negatively cited studies were of high quality and prominence; the median number of citations to these papers was higher than to papers that never received negative citations throughout their full citation “life cycle” (Fig. 2). Thus, as scientists pay more attention to a study (potentially also because of its novelty and quality), they are also more likely to provide criticisms, extensions, and qualifications to it. Negative citations can be therefore seen as a way to track where scientists place attention at a certain time within a field.
Fig. 2.
Median overall citations for papers receiving and not receiving negative citations, by age (years) of the papers.
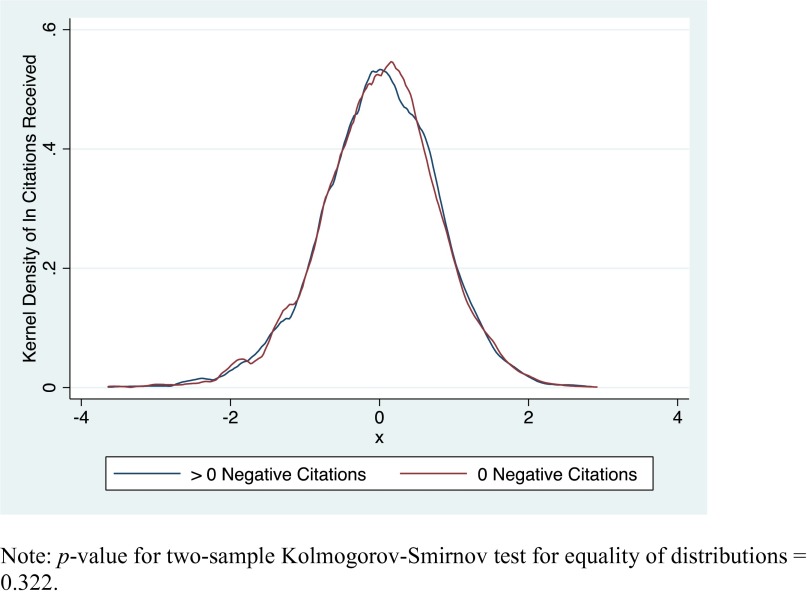
Third, the 4,888 papers (31% of the citing papers) that made at least one negative citation had a distribution of citations that is statistically indistinguishable from the 10,843 articles not making any negative citation (P value for test of equality of distribution = 0.32; the full analysis is in Supporting Information). Negatively citing papers are therefore not just marginal studies, perhaps differentiating themselves through incremental critiques of previous work; they rather appear as “equal” contributors to the overall advancement of a field. Seen in conjunction with the prior observation that negatively cited papers are of higher quality, this result may imply (although more work is needed to test this) that fields where negative citations occur are built on more solid foundations or at least may evolve more quickly because of increased interest by scientists.
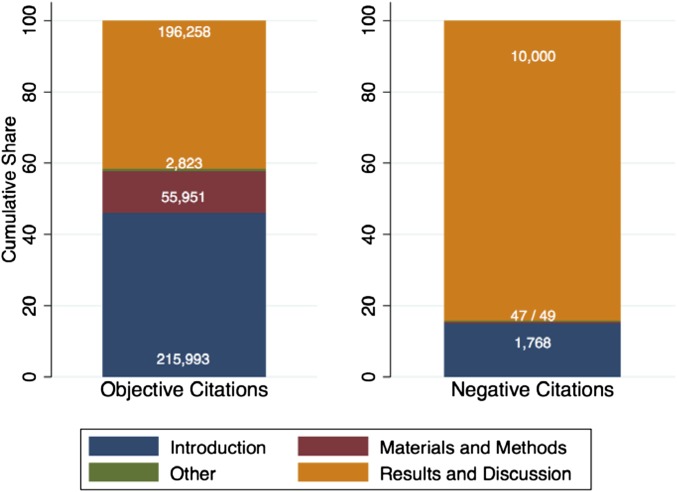
Fourth, we took advantage of the relatively standardized structure of scientific articles in immunology to assess whether negative citations disproportionately appeared in certain sections of an article. Fig. 3 shows that about 84% of all negative citations occurred in the “Results and Discussion” section, as opposed to 42% of objective citations (χ2 test for the equality of distribution of types of citations across sections = 8,700.6, P < 0.000). On the one hand, this suggests that negative citations may serve a specific purpose, at least in immunology (i.e., they mostly focus on findings rather than methods or theories, and are therefore different from other citations). On the other hand, it is possible that negative citations to, for example, theories and methods use language and wording that is more subtle, and thus less likely to be identified by our algorithm than negative citations related to results. To address this concern, we compared the keywords used in negative citations across different sections of a paper, and in negative and objective citations within the same section. To calculate how similar two citations were, we used the cosine similarity between the vectors of keywords generated by the relevant paragraphs of text. Perhaps not surprisingly, the analysis revealed that negative citations in a section were more similar to negative citations in other sections than to objective citations in the same section. More interestingly, we found no systematic or sizeable differences in the similarity of negative citations when making pairwise comparisons between sections.
Fig. 3.
Distribution of objective and negative citations by sections in an article.
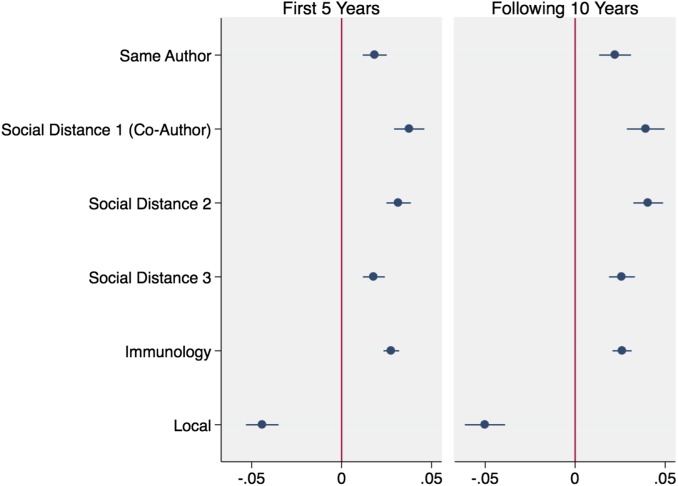
Fifth, negative citations were more likely to come from scientists who were close in discipline and social distance to the cited scholars. Fig. 4 reports the coefficient estimates from regressions of the probability that a paper received a negative citation (conditional on ever being cited) on variables measuring the physical distance between authors on the citing and cited papers, whether the citing and cited papers were both in the field of immunology, and whether authors on citing and cited papers were connected through previous collaborations. Within the first 5 years after publication, negative citations were more likely to come from articles published in other immunology journals, from authors who were more connected to the authors of the cited paper (e.g., coauthors, and coauthors of coauthors), and from scientists who were affiliated with institutions at a distance greater than 150 miles from the closest author in the focal article. In addition to being better positioned to understand the work of a focal author, a vast literature shows that scientists who are in the same discipline and socially proximate are more likely to interact and exchange information in a plurality of ways (22, 23). This finding is again consistent with the interpretation that awareness and scrutiny are prerequisites for negative citations; moreover, this result hints to the fact that negative citations may be one of the ways in which scientists debate and make progress in their field of research. In contrast, geographic proximity was negatively correlated with the presence of a negative citation. An explanation for this result is that social proximity is a more accurate indicator of closeness in knowledge space than physical proximity (colocated scientists who do not have direct or indirect coauthorship links may well be working in unrelated areas). Another interpretation is that it may be socially costly to negatively cite the work of a local colleague. Thus, for geographically colocated scientists other forms of feedback (e.g., personal interactions) may substitute rather than complement more “formal” negative citations.
Fig. 4.
Estimated changes in the probability of receiving a negative citation as a function of social, discipline, and geographic distance. Estimates are from Logit models where the outcome variable is an indicator for having received a negative citation at a given time, conditional on ever being cited, on the variables indicated on the vertical axis. Same author indicates self-citations. Social distance 1 (2, 3) indicates citation by a coauthor (coauthor of a coauthor, coauthor of the coauthor of a coauthor). Immunology indicates that the citing paper is in an immunology journal; local indicates that the closest author of a citing paper is at less than 150 miles from the closest author of the cited paper.
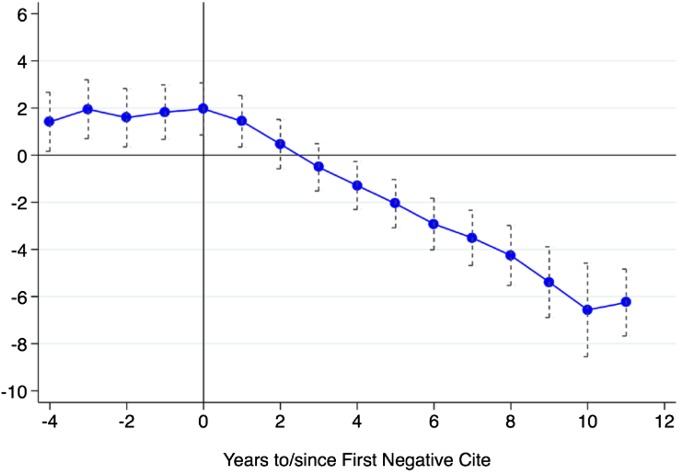
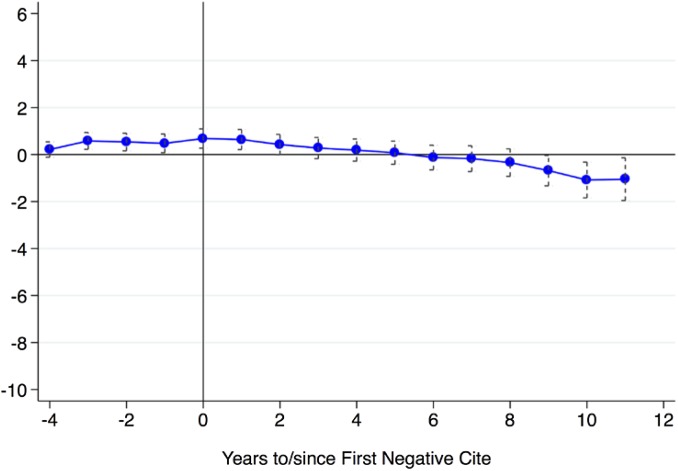
Finally, we assessed the impact of receiving a negative citation on the subsequent citation profile of a paper. Previous studies analyzed the effect of a retraction on the future citations to the retracted paper (24–27). We first compared the negatively cited papers to all other papers (Fig. 5). There was a marked relative decline in citations for the negatively cited papers after the first negative citation. However, this analysis may be misleading because the comparison was between potentially very different articles; recall, for example, that negatively cited articles were on average more prominent and might have therefore received more attention. We therefore matched and compared negatively cited articles to other papers with comparable characteristics, such as age and previous citations. Fig. 6 shows a much more similar citation profile over time for these two sets of articles, both before and after a negative citation occurred. The relative decline in overall citations eight or more years after the first negative citation reveals that there is a small, long-term “penalty” for negatively cited papers, although it takes a long time to occur.
Fig. 5.
Citations to the focal article after the first negative citation is made, not controlling for quality. Error bars correspond to 95% confidence intervals.
Fig. 6.
Citations to the focal article after the first negative citation is made, controlling for quality. Error bars correspond to 95% confidence intervals.
Discussion
Our findings suggest that negative citations may indeed play a special role in science. A possible explanation for the lack of an immediate penalty from negative citations on the subsequent interest for an article is that negative citations may contribute to refining initial findings and help a field evolve. Another explanation is that negative citations simply go unnoticed, and that the information they carry may take a long time to diffuse. Before making a citation, scientists would have to read all of the articles that cite the focal article to verify whether any of its content was updated by a follow-up study: although the focal article might diffuse rapidly, the one carrying the improved or correct information has to start a diffusion process of its own. As such, tracking the evolution of negative citations, and more generally of the different reasons why previous literature is referenced, is an important exercise. Our approach has the potential to inform how the citation process could be improved, and what kind of metadata scientists should be invited to attach to their citations to facilitate search, discovery, and knowledge recombination.
The findings in this paper are limited by the fact that they concern only the field of immunology. Although a small-scale, manual analysis that we performed on 2,860 citations in the mathematics section of PLOS ONE returned a similar rate of negative citations (1.7% of the total), a more comprehensive comparison across disciplines is necessary before results can be generalized. We hope that future research will build on the methodology presented here to cover additional fields and historical periods, and to address some of the conjectures and open questions generated by our results as described above.
Materials and Methods
The analysis was based on 15,731 full-text articles in the Journal of Immunology (1998–2007) and the 762,355 citations (to studies published in any journal) contained in those papers, which we extracted, parsed, and linked to the full bibliographic information on the citing articles. The database used for the retrieval of the information on the citing papers was ISI Web of Science. We were able to match 486,600 (64%) of the 762,355 citations to their full bibliographic details. Note that the incidence of negative citations was statistically indistinguishable between all citations (2.40%) and the sample of citations for which we could retrieve the full bibliographic data (2.44%; P = 0.146). To identify negative citations, we first developed a training set of 15,000 citations (i.e., sentences in a paper that contained the reference to another paper). A team of immunology PhDs and researchers manually reviewed these citations. These experts classified as negative citations references that pointed to the inability to replicate past results, disagreement, or inconsistencies with past results, theory, and literature. All other references that were simply referring to or building on past work were classified as “objective” citations. The quotes below report examples of negative citations as identified by our experts:
“The data therefore contrast with reports that Tregs and conventional T cells are equally sensitive to (superantigen-dependent or peptide-dependent) deletion (7, 9).”
“This conclusion appeared inconsistent with other experiments that indicated that H2-DM mutant animals generate strong CD4 + T cell responses when immunized with synthetic peptides (16).”
“This finding stands in contrast to the negative results of a previous study that used a similar recombinant Melan-A protein to screen 100 serum samples from melanoma patients (33).”
“However, our findings differ from those of Yan and colleagues (14), who reported MIP-2 expression (by immunohistochemical analysis) in the corneal epithelium in herpes simplex keratitis.”
We used NLP to run the full set of citations and automatically assign them using our training set of labeled data to the two types of citations: objective and negative. We relied on the Python NLTK library to perform the classification; when a citation paragraph was analyzed, the algorithm decomposed it into its grammar components (e.g., adjectives, verbs, etc.). These components were then stored into a presence dictionary and used to build a feature set. The feature set was the basis for a Bayesian model of the data. We used the NLTK Naive Bayes algorithm (www.nltk.org/_modules/nltk/classify/naivebayes.html) and probabilistically assigned the remaining citations to the two types of interest. As the training set grows in size, this approach allows us to accurately process large sets of citations in a relatively short time.
To determine the similarity in the wording used in a negative citation in different sections of an article, we transformed our citation paragraphs into vectors of keywords (after removing symbols and special characters from the text) and calculated the similarity between all pairs of citations coming from the different sections. For example, we calculated the similarity between negative citations coming from the “Results and Discussion” section and the “Materials and Methods” section. We also calculated the similarity between objective and negative citations within the same section (e.g., negative and objective citations in the “Introduction” section). Our measure of similarity comes from the Scikit-Learn Python module (scikit-learn.org/stable/modules/metrics.html), which calculates the L2-normalized dot product of two vectors of keywords (cosine similarity).
For the analyses reported in Fig. 6, finally, we matched negatively cited articles to objectively cited control articles using the coarsened exact matching procedure (28). The control sample that allowed us to compare the effect of being negatively cited consisted of objectively cited papers that were similar to the negatively cited papers in citation profile, cohort, and age. For each of our cited papers, we constructed discrete bins for the year in which the paper was published (cohort), the age of each cited paper when it was first cited by a paper in the Journal of Immunology (age), the number of citations received 1 year before the citation in the Journal of Immunology, and the cumulative number of total citations received 1 year before the citation in the Journal of Immunology. We created individual strata for each bin and selected a random objectively cited paper from each stratum that also contained a negatively cited paper to serve as the control paper. We were able to find suitable control articles for 7,741 of the 10,405 negatively cited articles.
Algorithm for Definition and Identification of Negative Citations
Our analysis was based on the full text of all of the 15,731 articles published in the Journal of Immunology for the period 1998–2007. These articles contained 762,355 citations, which we extracted, parsed, and matched back to their bibliometric information. We were able to match 486,600 of these citations with their bibliographic details.
We developed a training set of 15,000 of these citations. A team consisting of two experts with a PhD in immunology, one PhD student in immunology, one researcher with an MS in biomedicine and expertise in immunology, and one medical student with a research interest in immunology manually checked whether these 15,000 citations contained a negative element, that is, they were questioning of previous results or referring to inconsistency with the literature, as opposed to citations that were simply referring to or building on past work (examples are reported in the main text).
Natural language processing (NLP) was then used to run the full set of citations and automatically assign them using our training set to our two types of citations: objectives and negatives. We used the Python NLTK library to perform the classification; when analyzing a citation paragraph, the algorithm decomposed it into its grammar components (e.g., adjectives, verbs, etc.). These components were then stored into a presence dictionary, and used to build a feature set. The feature set was, in turn, the basis for a Bayesian model of the data. We used the NLTK Naive Bayes algorithm (www.nltk.org/_modules/nltk/classify/naivebayes.html). Using the Bayesian model, we probabilistically assigned the full set of citations to the two types of interest.
Algorithm to Determine the Matching Sample for the Analyses Reported in Fig. 6
We matched negatively cited articles to objectively cited articles using the coarsened exact matching procedure (28). The control sample that allowed us to compare the effect of being negatively cited to being objectively cited consisted of objectively cited papers that were similar to negatively cited ones in citation profiles, cohort (year of publication), and age. Specifically, for each of the cited papers, we constructed discrete bins for the year in which the paper was published, the age of each cited paper when it was first cited by a paper in the Journal of Immunology, the number of citations received 1 year before the citation in the Journal of Immunology, as well as the cumulative number of total citations received up to 1 year before the citation in the Journal of Immunology. We created individual strata for each bin and selected a random objectively cited paper from each stratum that also contained a negatively cited paper to serve as the control paper. We were able to find suitable control articles for 7,741 of the 10,405 negatively cited articles.
Cosine Distance Measure for Similarity of Negative Citations Across Section and of Negative and Objective Citations Within Section
We used the Scikit-Learn python module (scikit-learn.org/stable/modules/metrics.html), which calculates the L2-normalized dot product of the two vectors of keywords x and y as
where x and y are obtained from the text containing the focal citations (after we remove symbols and special characters from the text). The numerator represents the dot product of the two vectors, and the denominator is the product of their Euclidean lengths (see nlp.stanford.edu/IR-book/html/htmledition/dot-products-1.html). Note that if the two vectors are identical, then the cosine similarity is equal to 1, whereas if they have no overlap at all, the similarity measure is 0.
Table S4 reports the results of this analysis. The first four rows compare negative citations to objective citations within the same section (given the extremely large number of pairs, for the “Introduction” and “Results and Discussion” we selected a random sample of pairs to calculate the cosine similarity). The cosine similarity is similar across rows, which suggests that negative and objective citations have the same degree of overlap in language across different sections of a paper.
The following 12 rows compare the language of negative citations between different sections: negative citations tend to be more similar to each other, in wording, than they are to objective citations in the same section (the value of the cosine similarity is always higher in rows five and below than in the first four rows); moreover, we do not observe any systematic difference in cosine similarity within negative citations across different pairs of sections. Thus, we do not find evidence for systematic differences in how negative citations are expressed across different sections of a paper.
Fig. S1.
Kernel density of citation distributions of papers that made at least one negative citation and those that did not make any.
Table S1.
Descriptive statistics on the cited and citing papers in the sample
| Variable | N | Mean | SD | Minimum | Median | Maximum |
| All citations | ||||||
| Negative (0/1) | 762,355 | 0.0240 | ||||
| Matched citations | ||||||
| Negative (0/1) | 486,600 | 0.0244 | ||||
| All cited papers | ||||||
| Negative (0/1) | 146,891 | 0.0708 | ||||
| Publication year of citing paper | 15,731 | 2002.3 | 2.72 | 1998 | 2002 | 2007 |
| Publication year of cited paper | 146,891 | 1996.1 | 6.62 | 1902 | 1997 | 2007 |
| Citation lag (citation year – publication year) | 146,891 | 6.4657 | 5.93 | 0 | 5 | 103 |
| Self-citation (0/1) | 123,702 | 0.2004 | ||||
| Social distance 1 (citation by coauthor) (0/1) | 121,365 | 0.0723 | ||||
| Social distance 2 (citation by coauthor of a coauthor) (0/1) | 121,365 | 0.1486 | ||||
| Social distance 3 (citation by coauthor of the coauthor of a coauthor) (0/1) | 121,365 | 0.2949 | ||||
| Cited paper is in immunology journal (0/1) | 146,891 | 0.4820 | ||||
| Citation by “local” scientists (<150 miles) (0/1) | 146,891 | 0.1046 | ||||
| Negatively cited papers | ||||||
| Publication year of citing paper | 4,888 | 2002.4 | 2.74 | 1998 | 2002 | 2007 |
| Publication year of cited paper | 10,405 | 1996.4 | 5.67 | 1911 | 1997 | 2007 |
| Citation lag (citation year – publication year) | 10,405 | 6.0191 | 5.14 | 0 | 5 | 91 |
| Self-citation (0/1) | 8,953 | 0.1891 | ||||
| Social distance 1 (citation by coauthor) (0/1) | 8,845 | 0.0878 | ||||
| Social distance 2 (citation by coauthor of a coauthor) (0/1) | 8,845 | 0.1881 | ||||
| Social distance 3 (citation by coauthor of the coauthor of a coauthor) (0/1) | 8,845 | 0.3141 | ||||
| Cited paper is in immunology journal (0/1) | 10,405 | 0.5478 | ||||
| Citation by “local” scientists (<150 miles) (0/1) | 10,405 | 0.0616 | ||||
| Objectively cited papers | ||||||
| Publication year of citing paper | 10,843 | 2002.2 | 2.71 | 1998 | 2002 | 2007 |
| Publication year of cited paper | 136,486 | 1996.0 | 6.68 | 1902 | 1997 | 2007 |
| Citation lag (citation year – publication year) | 136,486 | 6.4997 | 5.98 | 0 | 5 | 103 |
| Self-citation (0/1) | 114,749 | 0.2013 | ||||
| Social distance 1 (citation by coauthor) (0/1) | 112,520 | 0.0711 | ||||
| Social distance 2 (citation by coauthor of a coauthor) (0/1) | 112,520 | 0.1455 | ||||
| Social distance 3 (citation by coauthor of the coauthor of a coauthor) (0/1) | 112,520 | 0.2934 | ||||
| Cited paper is in immunology journal (0/1) | 136,486 | 0.4770 | ||||
| Citation by “local” scientists (<150 miles) (0/1) | 136,486 | 0.1078 | ||||
The summary statistics are reported for the overall sample as well as separately for negative and objective citations.
Table S2.
Regression coefficients for results in Fig. 4
| Outcome variable: negative citation | ||
| Variables | (1), first 5 years | (2), following 10 years |
| Same author | 0.0184*** | 0.0221*** |
| (0.0034) | (0.0045) | |
| Social distance 1 (coauthor) | 0.0376*** | 0.0392*** |
| (0.0043) | (0.0054) | |
| Social distance 2 | 0.0317*** | 0.0406*** |
| (0.0035) | (0.0042) | |
| Social distance 3 | 0.0179*** | 0.0259*** |
| (0.0031) | (0.0037) | |
| Immunology | 0.0276*** | 0.0260*** |
| (0.0022) | (0.0027) | |
| Local | −0.0441*** | −0.0501*** |
| (0.0046) | (0.0057) | |
| Observations | 58,930 | 41,158 |
The table reports marginal effects estimates from a Logit regression where the outcome variable is an indicator having a value of 1 for a paper having received a negative citation (conditional on having ever been cited), and zero otherwise. The regressors include indicators for whether the citation was by an article authored by the same author of the focal author, one of her coauthors (social distance 1), a coauthor of a coauthor (social distance 2), or a coauthor of a coauthor of a coauthor (social distance 3); an indicator for whether the citing article was in an immunology journal (immunology); and an indicator for whether the smallest distance between the location of one of the authors of the cited paper and one of the authors of the citing paper was <150 miles (local). SEs are in parentheses. ***P < 0.01, **P < 0.05, *P < 0.1.
Table S3.
| Years to/since first negative citation | (1) Base regression Comparison group: all articles with no negative citations | (2) Matched regression Comparison group: articles with no negative citations, matched on observable quality measures |
| 4 years before | 1.4140** | 0.2151 |
| (0.6387) | (0.1653) | |
| 3 years before | 1.9482*** | 0.5807*** |
| (0.6369) | (0.1818) | |
| 2 years before | 1.5898** | 0.5366*** |
| (0.6312) | (0.1915) | |
| 1 year before | 1.8241*** | 0.4759** |
| (0.5897) | (0.2028) | |
| Year of first negative citation | 1.9653*** | 0.6826*** |
| (0.5643) | (0.2094) | |
| 1 year after | 1.4380*** | 0.6388*** |
| (0.5567) | (0.2171) | |
| 2 years after | 0.4689 | 0.4247* |
| (0.5346) | (0.2225) | |
| 3 years after | −0.5141 | 0.2771 |
| (0.5132) | (0.2298) | |
| 4 years after | −1.2882** | 0.1883 |
| (0.5173) | (0.2403) | |
| 5 years after | −2.0577*** | 0.0766 |
| (0.5238) | (0.2518) | |
| 6 years after | −2.9239*** | −0.1275 |
| (0.5589) | (0.2662) | |
| 7 years after | −3.5126*** | −0.1734 |
| (0.5983) | (0.2794) | |
| 8 years after | −4.2558*** | −0.3422 |
| (0.6480) | (0.2983) | |
| 9 years after | −5.3906*** | −0.6830** |
| (0.7656) | (0.3296) | |
| 10 years after | −6.5647*** | −1.0824*** |
| (1.0122) | (0.3883) | |
| 11 years after | −6.2520*** | −1.0502** |
| (0.7232) | (0.4644) | |
| Observations | 1,818,743 | 243,962 |
| No. of cited papers | 138,539 | 18,780 |
| R2 | 0.095 | 0.256 |
The estimates in this table are from a linear regression of the number of citations for a given paper on the interaction between an indicator for having received a negative citation, and indicators for the years before and after the negative citation event. In the first column, the sample includes the full sample of cited papers-years. In the second column, the sample is restricted to the papers that received a negative citations and a matched sample defined as described in Algorithm to Determine the Matching Sample for the Analyses Reported in Fig. 6. SEs, clustered at the cited paper level, are in parentheses. ***P < 0.01, **P < 0.05, *P < 0.1.
Table S4.
Similarity in the wording of negative vs. objective citations within a section, and of negative citations in different sections
| X | Y | Type of comparison | Mean cosine similarity | SD cosine similarity | No. of pairs |
| Introduction | (Random sample) | Negative vs. objective | 0.070 | 0.038 | 7,072,500 |
| Materials and Methods | (Full sample) | Negative vs. objective | 0.060 | 0.041 | 2,180,768 |
| Other | (Full sample) | Negative vs. objective | 0.066 | 0.038 | 327,120 |
| Results and Discussion | (Random sample) | Negative vs. objective | 0.072 | 0.040 | 53,448,904 |
| Introduction | Materials and Methods | Negative vs. negative | 0.084 | 0.042 | 18,837 |
| Introduction | Other | Negative vs. negative | 0.086 | 0.039 | 47,502 |
| Introduction | Results and Discussion | Negative vs. negative | 0.090 | 0.041 | 6,536,439 |
| Materials and Methods | Introduction | Negative vs. negative | 0.084 | 0.042 | 18,860 |
| Materials and Methods | Other | Negative vs. negative | 0.083 | 0.043 | 1,334 |
| Materials and Methods | Results and Discussion | Negative vs. negative | 0.093 | 0.048 | 183,563 |
| Other | Introduction | Negative vs. negative | 0.086 | 0.039 | 47,560 |
| Other | Materials and Methods | Negative vs. negative | 0.083 | 0.043 | 1,334 |
| Other | Results and Discussion | Negative vs. negative | 0.090 | 0.042 | 462,898 |
| Results and Discussion | Introduction | Negative vs. negative | 0.090 | 0.041 | 6,542,780 |
| Results and Discussion | Materials and Methods | Negative vs. negative | 0.093 | 0.048 | 183,517 |
| Results and Discussion | Other | Negative vs. negative | 0.090 | 0.042 | 462,782 |
Acknowledgments
We thank Drs. Melissa Kemp and Jennifer Leavey for their comments on our research and for helping us to better understand the immunology context. Zerzar Bukhari, Edward Kim, and Jack Gao provided excellent research assistance.
Footnotes
The authors declare no conflict of interest.
This article is a PNAS Direct Submission. D.K.S. is a guest editor invited by the Editorial Board.
This article contains supporting information online at www.pnas.org/lookup/suppl/doi:10.1073/pnas.1502280112/-/DCSupplemental.
References
- 1.Romer PM. Endogenous technological change. J Polit Econ. 1990;98(5):S71–S102. [Google Scholar]
- 2.Phelps ES. Models of technical progress and the golden rule of research. Rev Econ Stud. 1966;33(2):133–145. [Google Scholar]
- 3.Arrow KJ. Classificatory notes on the production and transmission of technological knowledge. Am Econ Rev. 1969;59(2):29–35. [Google Scholar]
- 4.Partha D, David PA. Towards a new economics of science. Res Policy. 1994;23(5):487–521. [Google Scholar]
- 5.Merton RK. Priorities in scientific discoveries: A chapter in the sociology of science. Am Soc Rev. 1957;22(6):635–659. [Google Scholar]
- 6.Stephan PE. The economics of science. In: Hall BH, Rosenberg N, editors. Handbook of the Economics of Innovation. North-Holland; Amsterdam: 2010. pp. 217–273. [Google Scholar]
- 7.Merton RK. The Matthew effect in science. Science. 1968;159(3810):56–63. [PubMed] [Google Scholar]
- 8.Kuhn TS. The Structure of Scientific Revolutions. Univ of Chicago Press; Chicago: 1962. [Google Scholar]
- 9.Hall BH, Jaffe A, Trajtenberg M. Market value and patent citations. RAND J Econ. 2005;36(1):16–38. [Google Scholar]
- 10.Trajtenberg M. A penny for your quotes: Patent citations and the value of innovations. RAND J Econ. 1990;21(1):172–187. [Google Scholar]
- 11.Gittelman M, Kogut B. Does good science lead to valuable knowledge? Biotechnology firms and the evolutionary logic of citation patterns. Manage Sci. 2003;49(4):366–382. [Google Scholar]
- 12.Narin F, Hamilton KS, Olivastro D. The increasing linkage between U.S. technology and public science. Res Policy. 1997;26(3):317–330. [Google Scholar]
- 13.Breschi S, Lissoni F. Knowledge networks from patent data: Methodological issues and research targets. In: Glanzel W, Moed H, Schmoch U, editors. Handbook of Quantitative S&T Research: The Use of Publication and Patent Statistics in Studies of S&T Systems. Springer; Berlin: 2004. pp. 613–643. [Google Scholar]
- 14.Cowan R, Jonard N. Network structure and the diffusion of knowledge. J Econ Dyn Control. 2004;28(8):1557–1575. [Google Scholar]
- 15.Fleming L, King C, Juda AI. Small worlds and regional innovation. Organ Sci. 2007;18(6):938–954. [Google Scholar]
- 16.Singh J. Collaborative networks as determinants of knowledge diffusion patterns. Manage Sci. 2005;51(5):756–770. [Google Scholar]
- 17.Harhoff D, Narin F, Scherer FM, Vopel K. Citation frequency and the value of patented inventions. Rev Econ Stat. 1999;81(3):511–515. [Google Scholar]
- 18.Popper KR. The Logic of Scientific Discovery. Hutchinson; London: 1959. [Google Scholar]
- 19.Ball P. September 26, 2014. Scientists got it wrong on gravitational waves. So what? Guardian. Available at www.theguardian.com/commentisfree/2014/sep/26/scientists-gravitational-waves-science. Accessed September 23, 2015.
- 20.Sherwood S. Science controversies past and present. Phys Today. 2011;64(10):39–44. [Google Scholar]
- 21.Cambria E, White B. Jumping NLP curves: A review of natural language processing research. IEEE Comput Intell Mag. 2014;9(2):48–57. [Google Scholar]
- 22.Agrawal A, Goldfarb A. Restructuring research: Communication costs and the democratization of university innovation. Am Econ Rev. 2008;98(4):1578–1590. [Google Scholar]
- 23.Newman ME. Coauthorship networks and patterns of scientific collaboration. Proc Natl Acad Sci USA. 2004;101(Suppl 1):5200–5205. doi: 10.1073/pnas.0307545100. [DOI] [PMC free article] [PubMed] [Google Scholar]
- 24. Azoulay P, Furman JL, Krieger JL, Murray FE (2012) Retractions. NBER Working Paper No. 18499. Available at www.nber.org/papers/w18499.
- 25.Furman JL, Jensen K, Murray F. Governing knowledge in the scientific community: Exploring the role of retractions in biomedicine. Res Policy. 2012;41(2):276–290. [Google Scholar]
- 26.Lu SF, Jin GZ, Uzzi B, Jones B. The retraction penalty: Evidence from the Web of Science. Sci Rep. 2013;3:3146. doi: 10.1038/srep03146. [DOI] [PMC free article] [PubMed] [Google Scholar]
- 27.Campanario JM. Fraud: Retracted articles are still being cited. Nature. 2000;408(6810):288. doi: 10.1038/35042753. [DOI] [PubMed] [Google Scholar]
- 28.Iacus SM, King G, Porro G. Causal inference without balance checking: Coarsened exact matching. Polit Anal. 2012;20(1):1–24. [Google Scholar]


