Significance
The mass of white adipose tissue (WAT) in an organism is tightly controlled by the balance of triglyceride (TG) synthesis and catabolism. Here, we show that these opposing pathways communicate. TG catabolism by adipose triglyceride lipase (ATGL) activates peroxisome proliferator-activated receptor gamma (PPAR-γ), a crucial transcription factor for TG synthesis and storage in WAT. Consequently, ATGL deficiency in WAT not only impairs TG breakdown, but also PPAR-γ–driven TG formation. This decrease in TG synthesis leads to a paradoxical resistance to high fat diet-induced obesity in mice lacking ATGL. Interdependence of lipid catabolism and synthesis provides a rational explanation for the lack of obesity in ATGL-deficient mice and humans and identifies ATGL inhibition as potential treatment target to prevent diet-induced obesity and insulin resistance.
Keywords: ATGL, PPAR-gamma, lipolysis, lipogenesis, obesity
Abstract
Adipose triglyceride lipase (ATGL) initiates intracellular triglyceride (TG) catabolism. In humans, ATGL deficiency causes neutral lipid storage disease with myopathy (NLSDM) characterized by a systemic TG accumulation. Mice with a genetic deletion of ATGL (AKO) also accumulate TG in many tissues. However, neither NLSDM patients nor AKO mice are exceedingly obese. This phenotype is unexpected considering the importance of the enzyme for TG catabolism in white adipose tissue (WAT). In this study, we identified the counteracting mechanisms that prevent excessive obesity in the absence of ATGL. We used “healthy” AKO mice expressing ATGL exclusively in cardiomyocytes (AKO/cTg) to circumvent the cardiomyopathy and premature lethality observed in AKO mice. AKO/cTg mice were protected from high-fat diet (HFD)-induced obesity despite complete ATGL deficiency in WAT and normal adipocyte differentiation. AKO/cTg mice were highly insulin sensitive under hyperinsulinemic-euglycemic clamp conditions, eliminating insulin insensitivity as a possible protective mechanism. Instead, reduced food intake and altered signaling by peroxisome proliferator-activated receptor-gamma (PPAR-γ) and sterol regulatory element binding protein-1c in WAT accounted for the phenotype. These adaptations led to reduced lipid synthesis and storage in WAT of HFD-fed AKO/cTg mice. Treatment with the PPAR-γ agonist rosiglitazone reversed the phenotype. These results argue for the existence of an adaptive interdependence between lipolysis and lipid synthesis. Pharmacological inhibition of ATGL may prove useful to prevent HFD-induced obesity and insulin resistance.
Essentially all organisms face the problem of continuous energy demand in an environment of irregular food supply. To overcome this dilemma, metazoan organisms developed special storage depots for substrates that are used for energy production. In vertebrates, by far the most efficient energy reservoir is adipose tissue (1). This highly expandable organ is able to store all major nutritional components (fat, carbohydrates, and proteins) as triglycerides (TGs). Adipose tissue mass and TG content depend on the balance of anabolic and catabolic pathways. Lipid storage in response to nutrient supply involves the generation of adipocytes (adipogenesis), the induction of fatty acid (FA) synthesis from glucose and amino acids (de novo lipogenesis), and the synthesis of TGs (lipid synthesis). These processes are activated by a complex transcriptional network involving CCAAT/enhancer-binding proteins (C/EBPs), sterol regulatory enhancer binding proteins (SREBPs), and the heterodimer of peroxisome proliferator-activated receptor-gamma (PPAR-γ) and retinoid-X receptor (RXR) (2, 3).
The opposing metabolic pathway of TG catabolism (lipolysis) requires activation of enzymes called lipases. Adipose TG lipase (ATGL), hormone-sensitive lipase (HSL), and monoglyceride lipase (MGL) hydrolyze all three ester bonds of TGs in a stepwise manner to yield FAs and glycerol (4). Lipolysis is an exquisitely regulated process. Food deprivation initiates lipolysis through the hormonal activation of adipocytes by catecholamines or natriuretic peptides, activation of protein kinases A or G, downstream phosphorylation of multiple proteins of the lipolytic pathway, and release of coactivator proteins such as comparative gene identification-58 (CGI-58) (4, 5). These events, in turn, strongly activate ATGL and HSL resulting in efficient TG hydrolysis.
Because lipid synthesis and lipid catabolism are opposing metabolic pathways using quite different modes of regulation, they were historically seen as uncoupled processes. However, accumulating evidence suggested that a link exists between anabolic and catabolic lipid pathways (6–10). For example, the transcription of genes involved in both processes is activated by the adipogenic nuclear receptor PPAR-γ (4, 11). Furthermore, both humans and mice lacking ATGL are not, or only moderately, obese. Patients with mutations in the gene coding for ATGL [patatin-like phospholipase containing protein 2 (PNPLA2)] suffer from cardiomyopathy and muscle weakness but have normal fat mass (12). Similarly, mice lacking ATGL because of a targeted deletion of Pnpla2 (AKO) also exhibit a severe cardiac defect leading to premature death but are only moderately obese (13–15). This benign adipose tissue phenotype is unexpected considering the pivotal role of ATGL in TG catabolism and led us to hypothesize that ATGL-mediated TG hydrolysis regulates lipogenesis and lipid synthesis by currently unknown mechanisms.
In this study, we show that the absence of ATGL in mice fed a high-fat diet (HFD) leads to reduced food intake, decreased lipid synthesis, and resistance to obesity. At the same time, the animals remain highly insulin sensitive. These results highlight a previously unrecognized interdependence between functional lipolysis and effective lipid biogenesis and suggest that inhibition of ATGL in adipose tissue may ameliorate HFD-induced obesity as well as insulin resistance (IR) and type-2 diabetes.
Results
AKO/cTg Mice Are Protected from HFD-Induced Obesity.
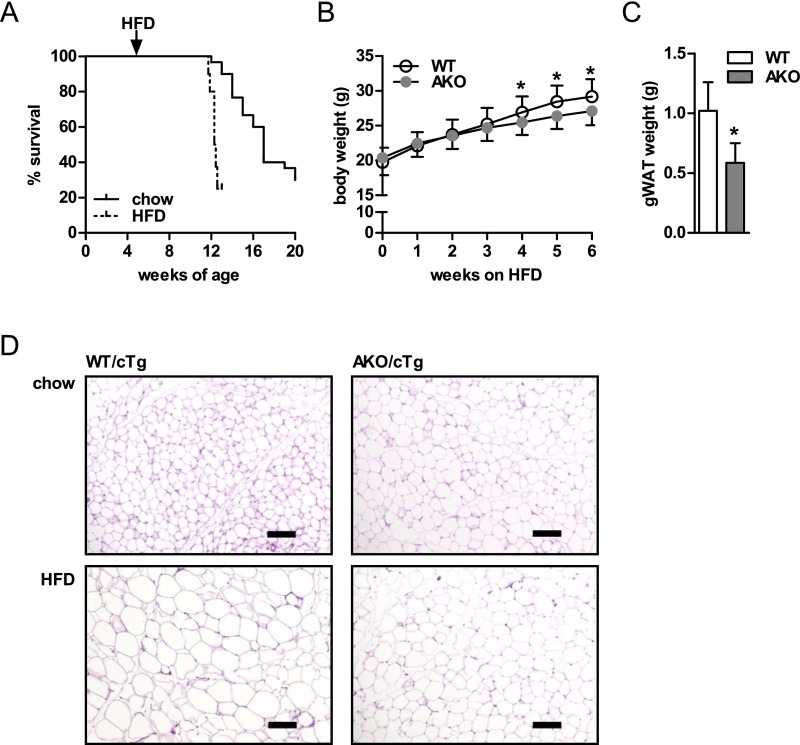
To assess whether lipolysis affects HFD-induced obesity, we initially fed 4- to 6-wk-old AKO mice a HFD for 8 wk. AKO mice on HFD died earlier than chow-fed AKO mice. On HFD, 50% of AKO mice died at the age of 11–13 wk versus 16–17 wk on chow (Fig. S1A; ref. 13). We also observed after 6 wk of HFD and prior to death that AKO mice gained less body weight (−9%) and gonadal white adipose tissue (gWAT) mass (−43%; Fig. S1 B and C) than WT mice on HFD. Nonetheless, the severe morbidity and early mortality observed in these animals placed the physiological relevance of these results in question and precluded meaningful metabolic studies including hyperinsulinemic-euglycemic clamp experiments.
Fig. S1.
AKO mice are protected from HFD-induced obesity. (A) Kaplan–Meier plot of AKO mice fed a chow (n = 30) and HFD (n = 10). Body weight (n = 20–25) (B) and gWAT mass (C) from HFD-fed AKO mice (n = 8–10). (D) Histological analyses of gWAT from chow and HFD-fed AKO/cTg and WT/cTg mice. Values are means ± SD. Student’s unpaired t test. *P < 0.05. (Scale bars: 100 µm.)
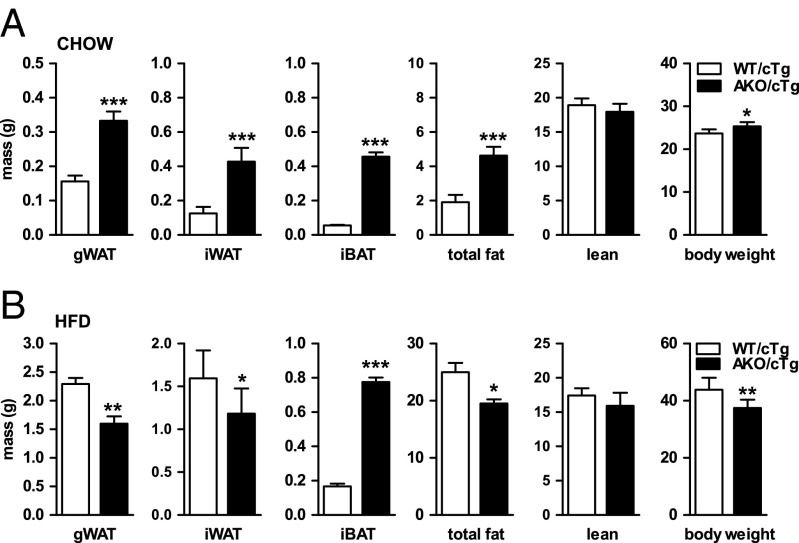
To circumvent the experimental limitations due to early cardiac death, we generated and characterized mice overexpressing ATGL exclusively in cardiac muscle but lacking the enzyme in all other tissues (AKO/cTg). Heart-restricted ATGL expression prevents cardiac steatosis, mitochondriopathy, dilated cardiomyopathy, and premature death resulting in normal life expectancy (16, 17). Compared with WT/cTg control mice, chow-fed AKO/cTg mice had increased fat depots when examined by time-domain NMR (Fig. 1A). Mass of gWAT, inguinal WAT (iWAT), intrascapular brown adipose tissue (iBAT), and total body fat mass were 2.1-, 3.4-, 8.2-, and 2.4-fold higher in AKO/cTg than in WT mice overexpressing ATGL in the heart (WT/cTg), respectively. Lean mass was unchanged. The increased fat mass in AKO/cTg mice led to a moderately higher body weight compared with WT/cTg. These findings are concordant with our earlier conclusion that defective lipolysis leads to increased adiposity in chow-fed mice (13, 14).
Fig. 1.
AKO/cTg mice are protected from HFD-induced obesity. Mass of gWAT, iWAT, iBAT, total fat, lean tissue, and body mass from animals fed chow diet (n = 8–9; A) and HFD (n = 7; B). Values are means ± SD. Student’s unpaired t test. *P < 0.05, **P < 0.01, ***P < 0.001.
The rescued heart phenotype in AKO/cTg mice enabled us to feed animals a HFD and perform extensive metabolic studies. Plasma glucose and lipid parameters of AKO/cTg mice were similar to WT/cTg mice fed a HFD (Table S1). As expected from ATGL deficiency, the most pronounced differences were observed in mice fasted for 4 h. Under this condition, HFD-fed AKO/cTg mice had 23%, 52%, 72%, and 51% lower circulating glucose, FA, TG, and glycerol levels, respectively, than WT/cTg mice. Moreover, plasma insulin levels were reduced by 90% in AKO/cTg mice.
Table S1.
Plasma parameters in AKO/cTg mice fed a HFD
| Fed | Fasted (4 h) | |||
| Plasma levels | WT/cTg | AKO/cTg | WT/cTg | AKO/cTg |
| Energy substrates | ||||
| Glucose, mg/dL | 213 ± 43 | 179 ± 16 | 212 ± 20 | 164 ± 25*** |
| FA, mM | 0.72 ± 0.19 | 0.65 ± 0.10 | 0.93 ± 0.21 | 0.45 ± 0.09*** |
| TG, mM | 1.02 ± 0.16 | 0.78 ± 0.13** | 0.25 ± 0.11 | 0.07 ± 0.06** |
| Glycerol, mM | 0.40 ± 0.10 | 0.34 ± 0.03 | 0.41 ± 0.11 | 0.20 ± 0.04*** |
| Hormones | ||||
| Insulin, ng/mL | 3.8 ± 1.8 | 4.6 ± 1.9 | 1.0 ± 0.6 | 0.1 ± 0.1** |
| Leptin, ng/mL | 39.5 ± 15.3 | 18.4 ± 11.0** | 19.4 ± 12.4 | 4.0 ± 2.5* |
| Adiponectin, µg/mL | 10.6 ± 1.2 | 7.2 ± 0.6*** | 6.9 ± 1.1 | 6.3 ± 1.0 |
Plasma parameters were analyzed in fed (refed for 2 h after fasting) or 4-h fasted mice. Values are means ± SD. (n ≥ 7). Student’s unpaired t test. *P < 0.05, **P < 0.01, ***P < 0.001.
Extrapolating the results obtained from our studies on chow diet, we hypothesized that AKO/cTg mice on HFD would develop a much more pronounced obesity than WT/cTg mice on HFD. But in contrast to our expectations, AKO/cTg mice fed a HFD accumulated less fat than age-matched WT/cTg mice (Fig. 1B). Mass of gWAT and iWAT were 30% and 25% lower in AKO/cTg than in WT/cTg animals. Unlike WAT depots, iBAT mass remained enlarged in AKO/cTg mice (3.6-fold). Adipocyte size in gWAT of AKO/cTg mice fed a chow diet was bigger than in WT/cTg but smaller when animals were fed a HFD (Fig. S1D). Overall, on HFD, AKO/cTg mice had less total body fat (−22%) and lean mass (−9%, not significant) as well as lower total body weight (−15%) than WT/cTg (Fig. 1B). Tibia length did not differ between genotypes, indicating that the lower body weight in AKO/cTg mice was not due to retarded growth (17.08 ± 0.47 mm for WT/cTg and 17.33 ± 0.56 mm for AKO/cTg). Consistent with reduced fat mass, plasma leptin levels were 53% lower in HFD-fed AKO/cTg mice than in HFD-fed WT/cTg (Table S1). Plasma adiponectin concentrations were in the normal range in both genotypes. Although fasting plasma insulin levels were significantly lower in AKO/cTg mice than in WT/cTg mice, they were similar in both groups upon refeeding, indicating that the glucose-stimulated insulin response in pancreatic islets was not impaired. Thus, quite counterintuitively, mice lacking ATGL in all tissues except the heart are resistant to HFD-induced obesity.
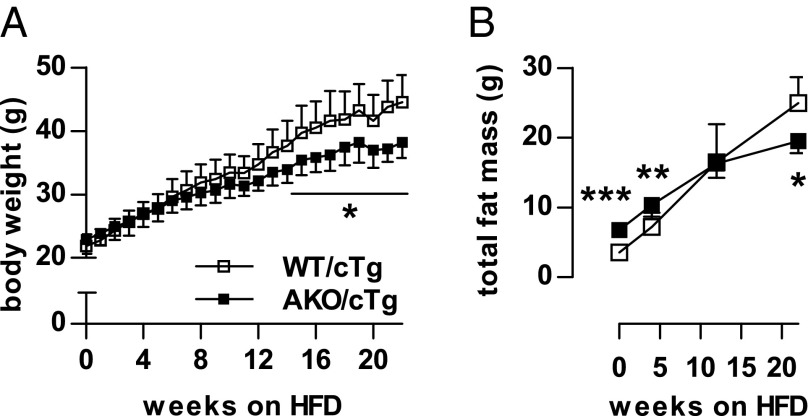
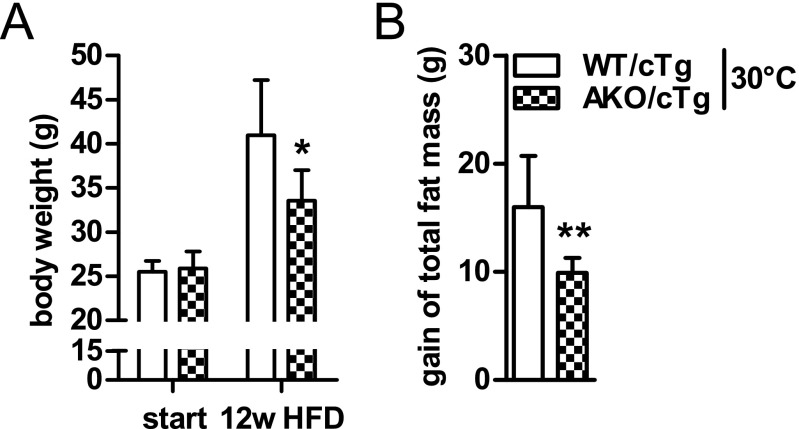
The resistance to gain body weight and WAT mass in AKO/cTg mice on HFD develops over a time course of several months (Fig. 2 A and B) suggesting that it is a slow, adaptive process. Furthermore, weight gain resistance persisted at thermoneutral housing conditions at 30 °C, suggesting that it was independent of thermoregulation at ambient temperature (Fig. S2 A and B).
Fig. 2.
Resistance to HFD-induced obesity is a slow adaptive process. Time-course of body weight (A) and total fat mass gain (B) during HFD intervention at 23 °C (n = 5–8). Values are means ± SD. Student’s unpaired t test. *P < 0.05, **P < 0.01, ***P < 0.001.
Fig. S2.
Resistance to HFD-induced obesity is independent of thermoregulation. Body weight (A) and gain of total fat mass (B) during HFD intervention at thermoneutrality (30 °C). (n = 5–8). Values are means ± SD. Student’s unpaired t test. *P < 0.05, **P < 0.01.
Decreased Food Intake Is Partially Responsible for the Obesity-Resistant Phenotype.
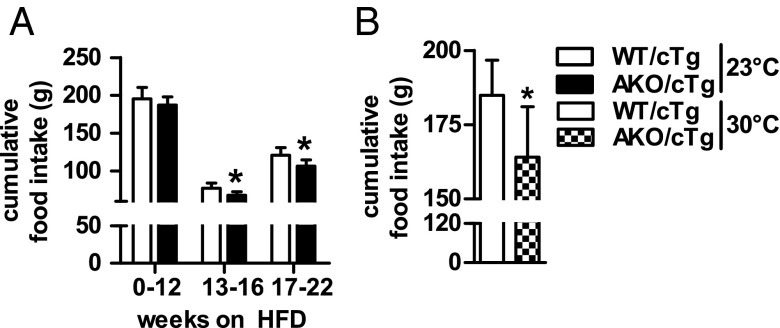
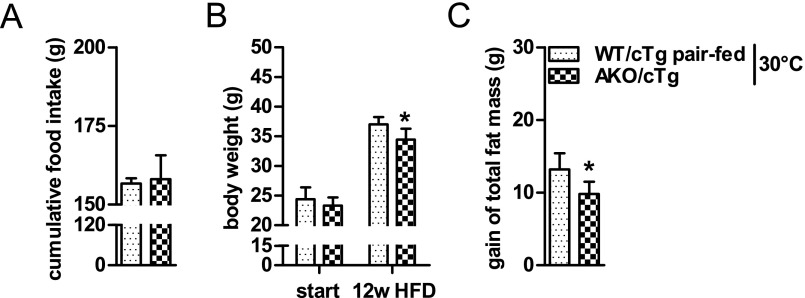
The mechanism(s) leading to resistance to HFD-induced obesity in AKO/cTg mice may involve decreased food intake or resorption, increased energy expenditure (EE), decreased adipogenesis, or reduced lipid synthesis in WAT. Notably, AKO/cTg mice consumed less food than WT/cTg mice. The small difference was significant from week 13 onwards when body weight and total body fat mass diverged between HFD-fed AKO/cTg and WT/cTg mice (Figs. 3A and 2 A and B). A similar 10% difference in cumulative food intake was also observed in mice kept at thermoneutrality (Fig. 3B). To examine the contribution of this moderate hypophagia to the obesity-resistant phenotype, we restricted food access for a separate WT/cTg cohort by pair-feeding at thermoneutrality. Despite equal food intake (Fig. S3A), AKO/cTg mice still gained less body weight and fat mass than pair-fed WT/cTg littermates (Fig. S3 B and C) although the obesity resistance phenotype was less pronounced than in ad libitum fed mice (Fig. S2 A and B). Collectively, these data suggest that decreased food intake partially contributes to HFD-induced obesity resistance in AKO/cTg mice but that other metabolic adaptations are additionally involved.
Fig. 3.
Decreased food intake is partially responsible for the obesity resistant phenotype. Cumulative food intake of animals housed at 23 °C during 22 wk of HFD intervention (A) and thermoneutrality (30 °C) during 12 wk of HFD intervention (B). n = 5–8. Values are means ± SD. Student’s unpaired t test. *P < 0.05.
Fig. S3.
Pair-feeding studies at thermoneutrality. Cumulative food intake (A), body weight (B), and gain of total fat mass (C) in pair-fed mice housed at thermoneutrality at 30 °C (n = 5–6). Values are means ± SD. Student’s unpaired t test. *P < 0.05, **P < 0.01, ***P < 0.001.
Lipogenesis and Lipid Synthesis Are Decreased in gWAT of AKO/cTg Mice Fed a HFD.
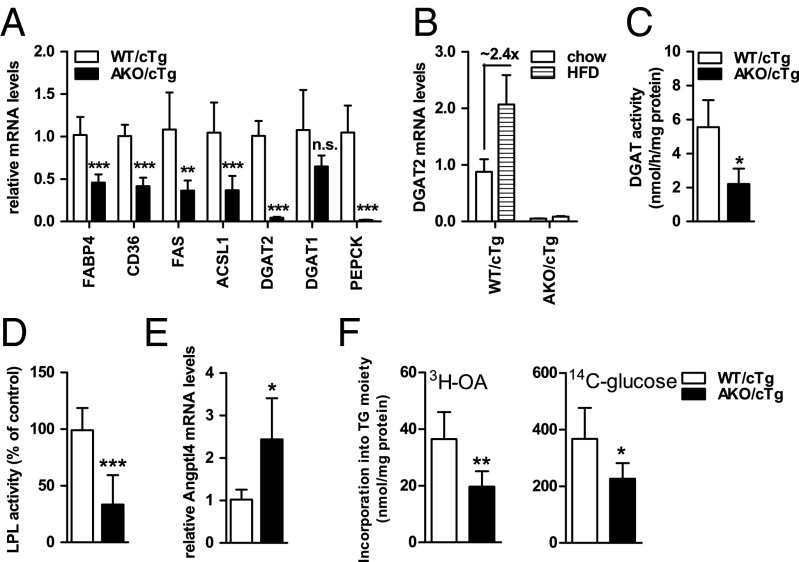
To delineate the metabolic adaptations in WAT that may underlie the obesity resistance of HFD-fed AKO/cTg mice, we analyzed lipid synthesis and storage pathways. mRNA levels of genes involved in FA transport [fatty acid binding protein 4 (FABP4); fatty acid translocase (CD36)], FA de novo synthesis [fatty acid synthase (FAS)], and TG synthesis [acyl-CoA synthetase 1 (ACSL1); acyl-CoA diglyceride acyltransferase-2 (DGAT2); phosphoenolpyruvate carboxykinase (PEPCK)] were collectively decreased between 50% and 98% in gWAT of HFD-fed AKO/cTg mice compared with WT/cTg mice (Fig. 4A). Upon HFD feeding, DGAT2 mRNA levels increased by 2.4-fold over levels in WT/cTg mice on chow diet but they were extremely low in AKO/cTg mice on either chow or HFD diet (Fig. 4B). In agreement with varied mRNA levels, selected enzyme activities were also decreased more than 60% in HFD-fed AKO/cTg compared with HFD-fed WT/cTg mice including DGAT (Fig. 4C) and heparin-releasable lipoprotein lipase activities (LPL; Fig. 4D). Concomitantly, mRNA levels of the LPL inhibitor angiopoietin-like protein 4 (Angptl4) increased by 2.4-fold in WAT of AKO/cTg mice compared with HFD-fed WT/cTg mice (Fig. 4E). Ex vivo fat pad assays showed a reduced incorporation of oleic acid (OA, −40%) and glucose (−46%) into TGs of gWAT derived from HFD-fed AKO/cTg compared with WT/cTg mice (Fig. 4F). Collectively, these data provide compelling evidence that defective lipolysis provokes a suppression of lipid synthesis and fat storage in WAT of mice challenged by HFD feeding.
Fig. 4.
Lipogenesis and TG synthesis are decreased in gWAT of AKO/cTg mice fed a HFD. (A and B) Gene expression (n = 6–7). (C) DGAT activities (n ≥ 3). (D) LPL activities (n ≥ 6). (E) Angptl4 mRNA levels (n = 5). (F) Incorporation of 3H-oleic acid (3H-OA) and 14C-glucose into TGs in ex vivo fat pad analyses (n = 5). Mice were refed before tissue harvest. Values are means ± SD. Student’s unpaired t test. *P < 0.05, **P < 0.01, ***P < 0.001.
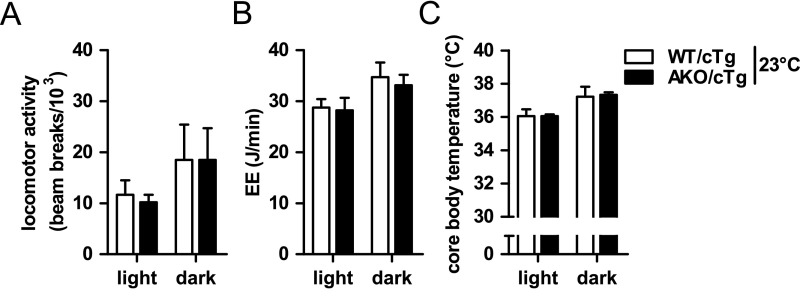
The decreased WAT mass in HFD-fed AKO/cTg mice compared to pair-fed WT/cTg mice suggested a redirection of calories and changes in energy balance. However, using indirect calorimetry and telemetry, no significant differences in locomotor activity, total EE, or core body temperature between HFD-fed AKO/cTg and WT/cTg mice (Fig. S4 A–C) were detected. Because body weight differed between genotypes, we performed an “analysis of co-variance (ANCOVA)” for total EE (18) and found no significant difference between genotypes (WT/cTg = 61.52 ± 0.92 J/min and AKO/cTg = 62.63 ± 1.13 J/min based on a body weight of 41.09 g). We assume that the small changes in daily EE that lead to the obesity resistant phenotype over the time course of many weeks are too small for the detection sensitivity of indirect calorimetry.
Fig. S4.
Energy expenditure in AKO/cTg mice fed a HFD. Locomotor activity (A), total energy enpenditure (EE) (B), and core body temperature (C) of ad libitum HFD-fed mice housed at 23 °C (n = 5–8). Values are means ± SD. Student’s unpaired t test. *P < 0.05, **P < 0.01, ***P < 0.001.
Reduced PPAR-γ2 Expression Limits Adipose Tissue Expansion in AKO/cTg Mice Fed a HFD.
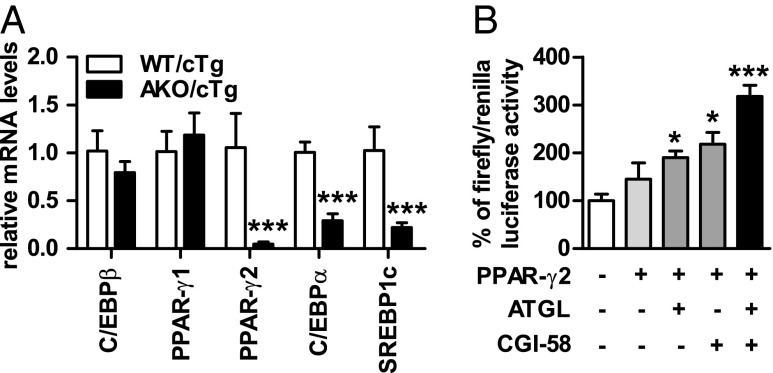
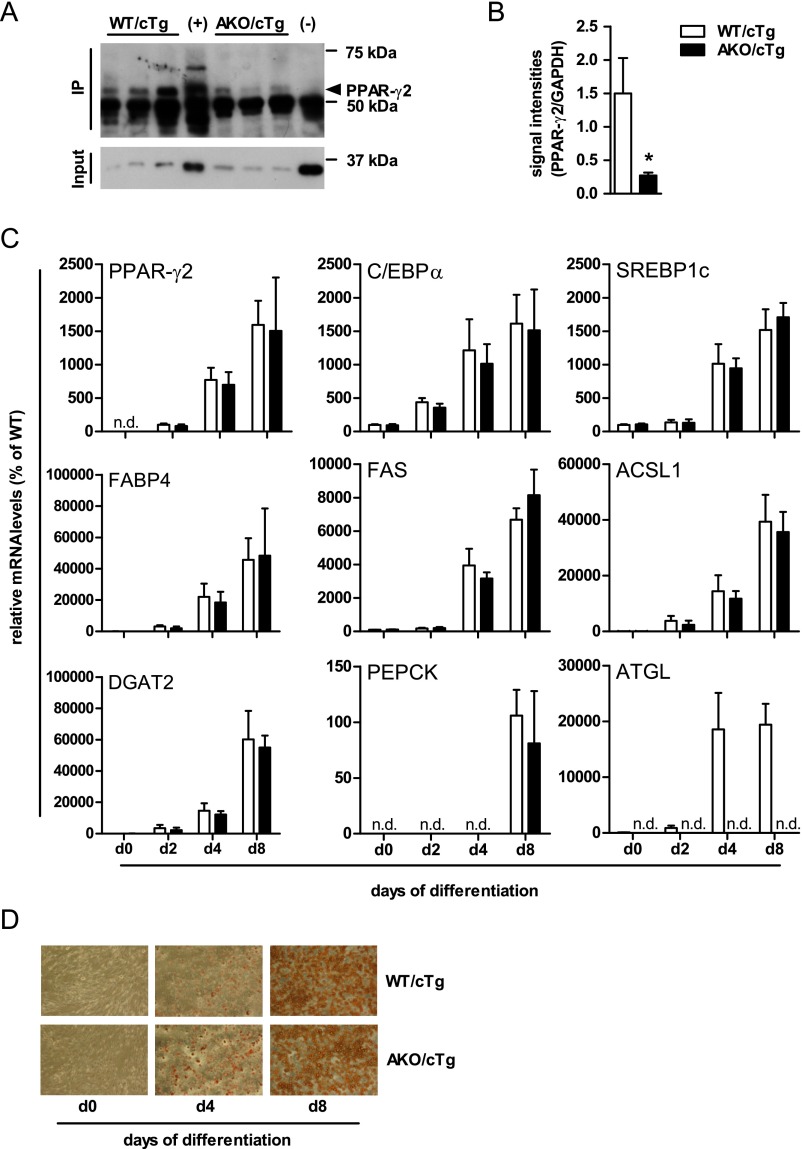
The main transcriptional drivers for adipogenesis, de novo lipogenesis, and TG synthesis in adipose tissue are the transcription factors C/EBPs, PPAR-γ, and SREBP1c. We found that mRNA levels for C/EBPβ, a transcription factor expressed early during adipogenesis, and PPAR-γ1, which is expressed in many tissues, were not altered between genotypes (Fig. 5A). In contrast, mRNA levels of transcription factors involved in late adipocyte differentiation/maturation and the expression of genes involved in lipogenesis and fat storage such as PPAR-γ2 (−95%), C/EBPα (−30%), and SREBP1c (−78%) were significantly lower in gWAT from HFD-fed AKO/cTg mice than from WT/cTg. Concordantly, PPAR-γ2 protein levels were 80% lower in AKO/cTg than in WT/cTg mice (Fig. S5 A and B). Defective lipolysis thus affects cell signaling by PPAR-γ2 and other transcription factors.
Fig. 5.
Reduced PPAR-γ2 expression limits adipose tissue expansion in AKO/cTg mice fed a HFD. (A) Gene expression in gWAT (n = 5). (B) PPAR-γ2 luciferase reporter assay (n = 3). Values are means ± SD. Student’s unpaired t test. *P < 0.05, ***P < 0.001.
Fig. S5.
Reduced PPAR-γ2 protein expression but adipocyte differentiation is intact. Western blot (A) and quantification (B) of PPAR-γ2 immunoprecipitation from gWAT [n = 3; (+) = WT PPAR-γ2 and (-) = PPAR-γ2–deficient iWAT; Input = α-GAPDH immunblot]. Gene expression (C) and light microscopy (D) of SVF cells upon oil red O staining (100× magnification) during differentiation. n = 3 independent experiments. Values are means ± SD. Student’s unpaired t test. *P < 0.05, **P < 0.01, ***P < 0.001; n.d. not detectable.
To directly test whether PPAR-γ2–activated gene expression can be regulated by ATGL-mediated lipolysis in vitro, we performed dual luciferase reporter assays in COS-7 cells where luciferase gene transcription is controlled by PPAR responsive promoter elements. Overexpression of PPAR-γ2 alone led to a 1.5-fold increase in luciferase activity (Fig. 5B). The additional presence of either ATGL or its coactivator CGI-58 caused a 1.9- and 2.2-fold increase, respectively. Luciferase activitiy was highest upon coexpression of ATGL and CGI-58 (3.2-fold). Together, these data suggest that impaired lipolysis restricts adipose tissue expansion upon HFD intervention by altering PPAR-γ2–regulated gene expression.
ATGL Deficiency Does Not Affect Adipocyte Differentiation.
Next, we tested whether the loss of ATGL affects adipocyte differentiation in a cell-autonomous manner. We isolated the stroma vascular fraction (SVF) from WAT derived from chow-fed mice and subjected these cells to an established in vitro differentiation program in the absence of a synthetic PPAR-γ agonist (19). SVF cells derived from WT/cTg or AKO/cTg mice differentiated normally, exhibited normal lipid droplet formation, and expressed similar mRNA levels of classical differentiation markers such as PPAR-γ2, C/EBPα, SREBP1c, or PPAR-γ target genes such as FABP4, FAS, ACSL1, DGAT2, and PEPCK between the genotypes (Fig. S5 C and D). Thus, adipocyte differentiation per se is not impaired upon ATGL deficiency.
Pharmacological PPAR-γ Activation Reverses the Obesity-Resistant Phenotype of AKO/cTg Mice Fed a HFD.
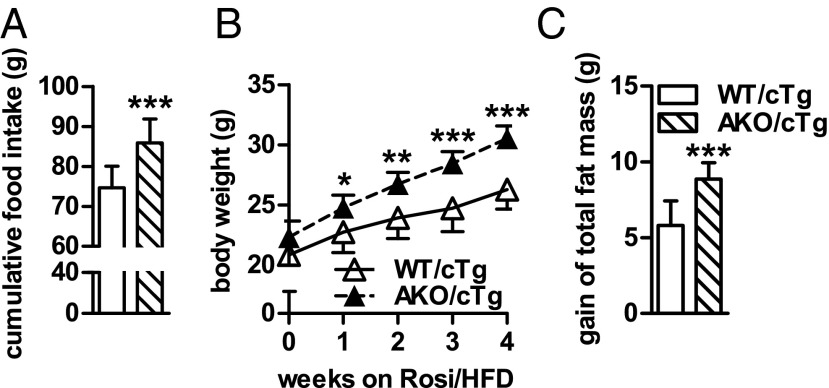
To substantiate the role of reduced PPAR-γ2 activity in the obesity-resistant phenotype in AKO/cTg mice fed a HFD, we fed mice a HFD supplemented with the synthetic PPAR-γ agonist rosiglitazone (Rosi/HFD). If the loss of ATGL-mediated lipolysis impairs PPAR-γ–driven lipid synthesis, then agonist treatment should increase PPAR-γ activity independently of ATGL and result in increased body weight and fat mass in HFD-fed AKO/cTg mice. Upon 4 wk of Rosi/HFD intervention, the obesity-resistant phenotype was completely reversed. Compared with WT/cTg, AKO/cTg mice became hyperphagic and gained 16% more body weight (Fig. 6 A and B). Total fat mass increased in mice of both genotypes, albeit the increase was more pronounced in AKO/cTg than in WT/cTg mice (Fig. 6C). In line with increased body weight and fat mass, expression of PPAR-γ2 and selected target genes was restored to WT/cTg levels (Fig. S6 A and B). Thus, pharmacological PPAR-γ activation abrogates the obesity-resistant phenotype in HFD-fed AKO/cTg mice, consistent with the concept that ATGL is crucial for PPAR-γ2–mediated lipogenesis and TG synthesis.
Fig. 6.
Pharmacological PPAR-γ activation reverses the obesity-resistant phenotype in AKO/cTg mice fed a HFD. Cumulative food intake (A), body weight (B), and gain of total body fat mass (C) of mice fed a Rosi/HFD (n = 8). Values are means ± SD. Student’s unpaired t test. *P < 0.05, **P < 0.01, ***P < 0.001.
Fig. S6.
Pharmacological PPAR-γ activation normalizes gene expression in gWAT of AKO/cTg mice fed a HFD. (A and B) Gene expression in gWAT from mice fed a HFD or Rosi/HFD (±Rosi, respectively; n = 5–8). Values are means ± SD. Two-way ANOVA/LSD post hoc analyses. §, compared with WT/cTg fed a HFD; #, comparison between WT/cTg and AKO/cTg fed a Rosi/HFD.
AKO/cTg Mice Are Resistant to HFD-Induced IR.
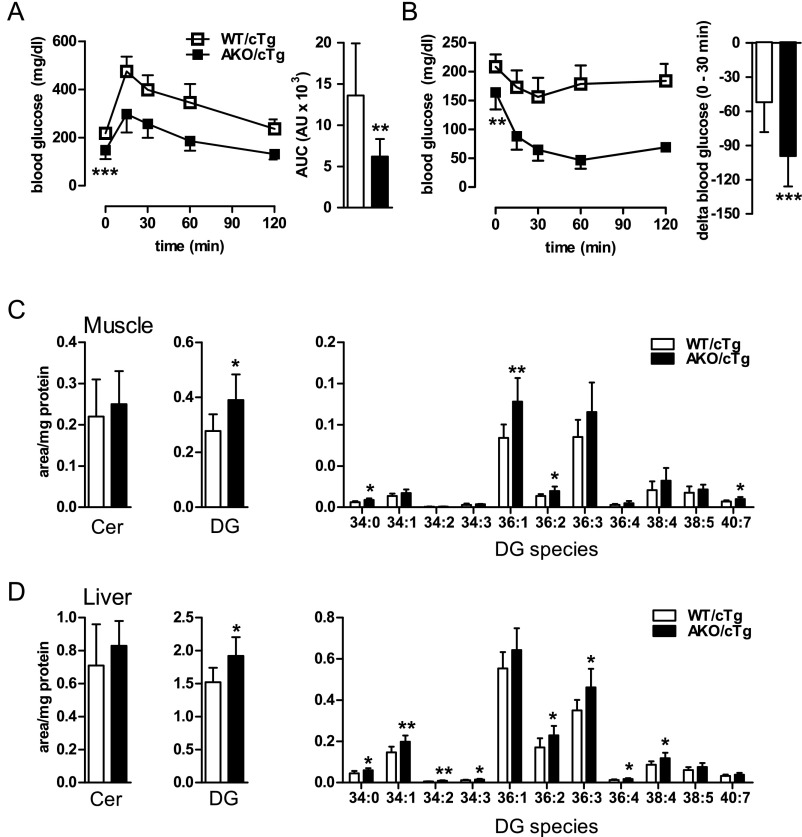
To assess whether altered insulin sensitivity affects lipid synthesis and storage in WAT of AKO/cTg mice, we performed glucose and insulin tolerance tests (GTT and ITT, respectively) as well as hyperinsulinemic/euglycemic clamp studies. GTTs revealed that blood glucose was cleared much more rapidly in HFD-fed AKO/cTg mice than in WT/cTg littermates (Fig. S7A). During ITT, blood glucose only marginally declined in HFD-fed WT/cTg mice, consistent with impaired insulin action (Fig. S7B). In contrast, blood glucose concentrations in AKO/cTg mice drastically decreased in response to insulin and remained extremely low during the entire experiment. Thirty minutes after insulin administration, blood glucose levels were lowered nearly twofold more efficiently in AKO/cTg mice than in WT/cTg.
Fig. S7.
Glucose tolerance, insulin sensitivity, and tissue lipid levels in mice fed a HFD. (A) GTT and area under the curve above baseline levels (AUC). (B) ITT and the reduction (delta) in blood glucose levels 30 min after insulin administration (n = 9–12). Ceramide (Cer) and DG levels in muscle (C) and liver (D) in mice fed a HFD (n = 8). Values are means ± SD. Student’s unpaired t test. *P < 0.05, **P < 0.01.
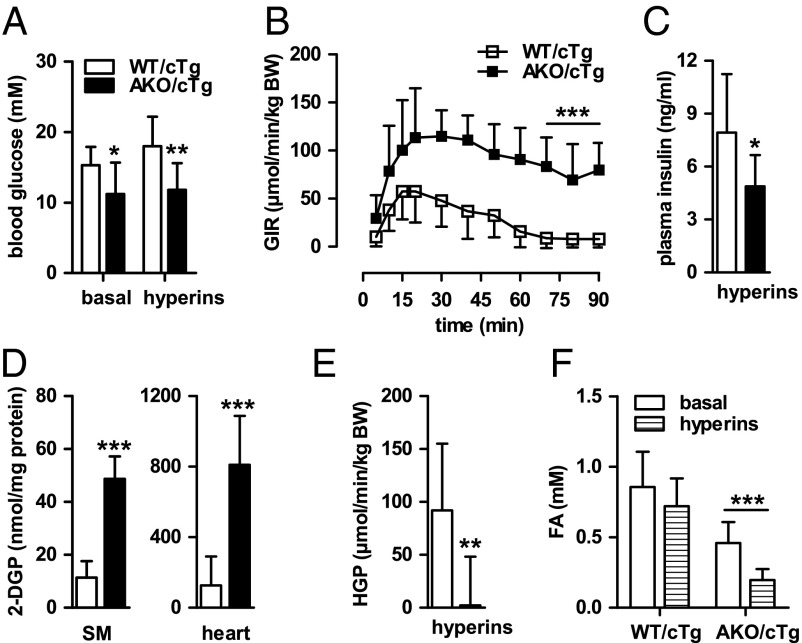
Hyperinsulinemic-euglycemic clamp experiments with HFD-fed AKO/cTg and WT/cTg mice confirmed the results of GTT and ITT. Because fasting blood glucose levels were 27% lower in AKO/cTg mice than in WT/cTg, individual glucose concentrations were defined as euglycemia for each genotype and blood glucose concentrations during steady-state hyperinsulinemia (hyperins) were clamped according to these basal levels for each genotype (Fig. 7A). Notably, the glucose infusion rate (GIR) required to maintain euglycemia was 11-fold higher in AKO/cTg than in WT/cTg mice (Fig. 7B), supporting the conclusion that, unlike WT/cTg mice, HFD-fed AKO/cTg mice remained highly insulin sensitive. This high insulin sensitivity in AKO/cTg mice during hyperinsulinemia was maintained despite lower plasma insulin concentrations (Fig. 7C). Remarkably, high insulin sensitivity of HFD-fed AKO/cTg mice was not associated with decreased concentrations of DGs or ceramides in muscle or liver (Fig. S7 C and D). Instead, total DG concentration was even slightly higher in AKO/cTg than in WT/cTg mice because of a small increase of 36:1 and 36:2 DG species in muscle and 34:1, 36:2, and 36:3 DG species in liver. To investigate which tissues contribute to enhanced insulin sensitivity, we determined the uptake of radioactively labeled 2-deoxy-glucose-phosphate (2-DGP). Tissue concentrations of 2-DGP were higher in skeletal muscle (SM) and heart of AKO/cTg animals than in WT/cTg (Fig. 7D). Concomitantly, hepatic glucose production (HGP) was completely shut off by hyperinsulinemia in AKO/cTg mice (Fig. 7E), arguing for high insulin sensitivity in muscle and liver of AKO/cTg mice. AKO/cTg mice on HFD also maintained high insulin sensitivity in WAT as evident from decreased basal plasma FA concentrations (−47%; Fig. 7F) that decreased further by 30% upon hyperinsulinemia. In contrast, plasma FA concentrations did not change in HFD-fed WT/cTg mice during hyperinsulinemia, proving an insulin-resistant state in these mice. Together, these data show that in contrast to WT/cTg mice, AKO/cTg mice remain insulin sensitive when kept on a HFD and exclude defective insulin signaling as cause for decreased adiposity in HFD-fed AKO/cTg mice.
Fig. 7.
AKO/cTg mice are resistant to HFD-induced IR. (A) Blood glucose levels upon 4 h fasting (basal) and during steady-state hyperinsulinemia (hyperins). (B) Glucose infusion rate (GIR). (C) Plasma insulin levels during hyperins. (D) Levels of 2-DGP in skeletal muscle (SM) and heart. (E) HGP during hyperins. (F) Plasma FA levels. Values are means ± SD. Student’s unpaired t test except for pairwise comparisons of data between basal and hyperins states (n ≥ 6). *P < 0.05, **P < 0.01, ***P < 0.001.
Discussion
Humans and mice lacking ATGL for the initiation of TG catabolism in adipose and nonadipose tissues are not, or only moderately, obese. These observations are quite unexpected considering the pivotal role of ATGL in WAT lipolysis. Even more surprisingly, we show that mice lacking ATGL are protected against HFD-induced obesity and remain highly insulin sensitive. As an underlying mechanism, we found that impaired ATGL-mediated TG hydrolysis in vivo causes hypophagia and reduced de novo lipogenesis and lipid synthesis in WAT protecting mice (and possibly humans) from excessive lipid accumulation in adipose tissue. Reduced lipid synthesis and storage arise from decreased PPAR-γ2 and SREBP1c target gene expression. The finding that ATGL-mediated lipolysis regulates food intake, transcription of lipogenic genes, and adipose tissue expansion adds an important aspect to adipose tissue lipid homeostasis, demonstrating that catabolic and anabolic lipid pathways are interdependent.
The mechanisms underlying decreased food intake in response to ATGL deficiency remain unknown. It is intriguing to note, however, that hypophagia can be turned into hyperphagia upon treatment of AKO/cTg mice with the synthetic PPAR-γ agonist rosiglitazone, suggesting a function of PPAR-γ in appetite regulation. In support of this concept, several recent studies underscored the importance of PPAR-γ in the brain for the regulation of food intake (20, 21). Because AKO/cTg mice lack ATGL in the brain, it is conceivable that central ATGL deficiency impairs PPAR-γ signaling in the brain, leading to reduced food intake. This concept awaits future study.
Although leptin represents an important orexigenic signal that is transmitted from the periphery to the hypothalamus (22), we found no evidence that it is involved in the hypophagic phenotype of AKO/cTg mice. Normally during HFD-induced obesity, mice develop hyperleptinemia, indicating a state of leptin resistance (23). In contrast, AKO/cTg mice had reduced plasma leptin concentrations, which do not provide an immediate explanation for the reduced food intake in HFD-fed AKO/cTg mice. Whether a conceivable leptin hypersensitivity contributes to the reduced food intake in AKO/cTg mice needs to be addressed in the future.
Pair-feeding studies revealed that hypophagia does not solely account for the resistance to HFD-induced obesity in ATGL-deficient mice. Low fat mass additionally resulted from decreased lipogenesis and lipid synthesis in WAT. This down-regulation of lipid synthetic pathways was most likely mediated by the reduced expression of key transcription factors (PPAR-γ, C/EBPα, and SREBP1c) and their target genes. Analyses of specific PPAR-γ isoforms revealed a drastic decrease of the adipose-specific and nutritionally regulated PPAR-γ2 isoform in gWAT of AKO/cTg mice (24–26). Decreased PPAR-γ2 activity in HFD-fed AKO/cTg mice also provides an explanation for the observed down-regulation C/EBPα mRNA levels. It is well established that these transcription factors positively regulate each other (27–30). Accordingly, decreased PPAR-γ2 signaling in response to ATGL deficiency may impair C/EBPα and, consequently, PPAR-γ2 transcription leading to the observed low transcript and protein levels of both transcription factors. Decreased SREBP1c expression may additionally contribute to reduced PPAR-γ transcription (31).
Although ATGL deficiency obviously impairs lipogenesis and lipid synthesis in HFD-fed AKO/cTg mice, the process is slow and does not lead to a complete loss of lipid anabolism. This assumption is based on our findings that (i) decreased PPAR-γ/C/EBPα/SREBP1c target gene expression and adipose mass in AKO/cTg mice was only observed in HFD-fed mice, (ii) ATGL-deficiency does not cause defective adipogenesis or adipocyte differentiation, and (iii) the development of resistance to HFD-induced obesity takes several weeks to become apparent. Therefore, we propose that ATGL deficiency in WAT initiates an adaptive, modulatory response that moderately curtails lipid synthesis, eventually leading to the observed resistance to HFD-induced obesity. This interpretation is also consistent with the recent finding that the activation of lipolysis by chronic β3-adrenergic stimulation promotes lipogenesis in an ATGL-dependent fashion (10).
The exact mechanism(s) whereby ATGL-mediated lipolysis affects PPAR-γ2 expression is still unknown, but several scenarios are conceivable. For example, it is possible that lipolysis generates a lipid product that directly (e.g., via FAs) or indirectly (by the conversion of lipolytic products into signaling lipids such as phospholipids, retinoids, or eicosanoids) interacts with the PPAR-γ/RXR heterodimer to activate target gene transcription. Our result that ATGL/CGI-58 expression induces PPAR-γ2 activity in transcriptional transactivation experiments is consistent with this concept. Other, more indirect mechanisms to regulate PPAR-γ/RXR activity in response to lipolysis may involve the dissociation and nuclear translocation of lipid droplet-associated transcriptional coregulators or changes in epigenetic modifications of transcription factors/coactivators (32).
PPAR-γ is not the only PPAR isoform that is linked to ATGL activity. ATGL-mediated lipolysis is also required for functional PPAR-α and PPAR-δ signaling in oxidative tissues and the pancreatic β-cell, respectively (16, 33–35). For example, absence of ATGL in cardiac muscle leads to reduced PPARα-mediated mitochondrial biogenesis, substrate oxidation, and respiration, resulting in the lethal cardiomyopathy (16).
Other lipolytic enzymes also affect PPAR-γ signaling and lipid accumulation in adipose tissue. More than a decade ago, several groups demonstrated that mice systemically lacking HSL (HKO) also exhibit reduced lipogenesis and TG synthesis (6, 9) and are resistant to HFD-induced obesity (8, 9, 36, 37). This defect in lipoanabolic processes in HKO mice was associated with a marked down-regulation of PPARγ-dependent gene expression, leading to an almost complete loss of WAT in older HKO mice (6). Similarly as in AKO/cTg mice, the obesity-resistant phenotype could be partially prevented by PPAR-γ agonist treatment (8). Recently, the first report on human individuals suffering from HSL deficiency confirmed the mouse findings and showed that the lack of HSL leads to decreased PPAR-γ target gene expression and partial lipodystrophy in affected patients (38). Collectively, these data suggest that lipolysis is required for functional PPAR-γ signaling, normal lipogenesis, and TG synthesis. Conversely, mice with dysfunctional PPAR-γ2 exhibit an impaired lipolytic response (7, 39), supporting the concept of a mutual dependence of lipid catabolism and lipid synthesis in WAT.
An important aspect of energy balance in AKO/cTg mice remains unclear. Because HFD-fed AKO/cTg mice accrued less WAT and body weight than pair-fed WT/cTg mice, they presumably consumed more energy. However, locomotor activity, core body temperature, and whole-body EE were identical in mice of both genotypes. Currently, we have no explanation for this apparent discrepency. Possibly, subtle changes in the daily EE as expected for an obesity-resistant phenotype developing over several months may be too small for the detection limits of indirect calorimetry (40, 41).
Insulin is the main anabolic hormone to drive lipogenesis and lipid synthesis. Therefore, we assessed whether IR in WAT leads to decreased lipid synthesis and storage in HFD-fed AKO/cTg mice. GTT, ITT, and hyperinsulinemic/euglycemic clamp experiments, however, clearly showed that AKO/cTg mice were much more glucose tolerant and insulin sensitive than insulin-resistant HFD-fed WT/cTg mice or mice lacking HSL (42) or MGL (43). Abolished HGP, increased muscle glucose uptake, and a pronounced antilipolytic WAT response to insulin confirmed that all classical insulin target tissues remained insulin sensitive in HFD-fed AKO/cTg mice and disproved the concept that IR prevented efficient lipid storage in this model. In accordance with the concept that hepatic acetyl-CoA concentrations regulate insulin sensitivity in the liver (44), it is conceivable that defective lipolysis and reduced FA flux from WAT to the liver in AKO/cTg mice leads to decreased hepatic FA oxidation, reduced acetyl-CoA concentrations, and low HGP.
The main finding of this study implicates that inhibition of ATGL-mediated lipolysis in WAT prevents HFD-induced obesity and IR.
Materials and Methods
Standard methods are described in SI Materials and Methods and Table S2.
Table S2.
Primer sequences for relative gene expression analysis
| Gene | Gene synonym | Accession no. | Primer forward/reverse |
| Fatty acid binding protein 4 | FABP4 | NM_024406 | 5′-AAGGTGAAGAGCATCATAACCCT-3′ |
| 5′-TCACGCCTTTCATAACACATTCC-3′ | |||
| Fatty acid synthase | FAS | NM_007988 | 5′-TCCTGGAACGAGAACACGATCT-3′ |
| 5′-GAGACGTGTCACTCCTGGACTTG-3′ | |||
| Fatty acid translocase | CD36 | NM_001159555 | 5′-GAACCTATTGAAGGCTTACATCC-3′ |
| 5′-CCCAGTCACTTGTGTTTTGAAC-3′ | |||
| Acyl-CoA-Synthase, long-chain | ACSL1 | NM_007981 | 5′-TGCCAGAGCTGATTGACATTC-3′ |
| 5′-GGCATACCAGAAGGTGGTGAG-3′ | |||
| Diacylglycerol-O-acyltransferase 1 | DGAT1 | NM_010046 | 5′-GTGCACAAGTGGTGCATCAG-3′ |
| 5′-CAGTGGGATCTGAGCCATCA-3′ | |||
| Diacylglycerol-O-acyltransferase 2 | DGAT2 | NM_026384 | 5′-TTCCTGGCATAAGGCCCTATT-3′ |
| 5′-AGTCTATGGTGTCTCGGTTGAC-3′ | |||
| Phosphoenolpyruvat-carboxykinase | PEPCK | NM_011044 | 5′-CATATGCTGATCCTGGGCATAAC-3′ |
| 5′-CAAACTTCATCCAGGCAATGTC-3′ | |||
| Angiopoietin-like Protein 4 | ANGPTL4 | NM_020581 | 5′-GTTTGCAGACTCAGCTCAAGG-3′ |
| 5′-CCAAGAGGTCTATCTGGCTCTG-3′ | |||
| CCAAT/enhancer binding protein beta | C/EBPβ | NM_001287738.1 | 5′-ACGACTTCCTCTCCGACCTCT-3′ |
| 5′-CGAGGCTCACGTAACCGTAGT-3′ | |||
| CCAAT/enhancer binding protein alpha | C/EBPα | NM_001287514.1 | 5′-CAAGAACAGCAACGAGTACCG-3′ |
| 5′-GTCACTGGTCAACTCCAGCAC-3′ | |||
| Peroxisome proliferator activated receptor-γ1 | PPAR-γ1 | NM_001127330.1 | 5-AACAAGACTACCCTTTACTGAAATTACCA-3′ |
| 5′-CACAGAGCTGATTCCGAAGTTG-3′ | |||
| Peroxisome proliferator activated receptor-γ2 | PPAR-γ2 | NM_011146.3 | 5′-CCAGAGCATGGTGCCTTCGCT-3′ |
| 5′-CAGCAACCATTGGGTCAG-3′ | |||
| Sterol regulatory element binding transcription factor 1c | SREBP1c | NM_011480.3 | 5′-GTTACTCGAGCCTGCCTTCAGG-3′ |
| 5′-CAAGCTTTGGACCTGGGTGTG-3′ | |||
| Adipose triglyceride lipase | ATGL | NM_001163689.1 | 5′-GAGACCAAGTGGAACATC-3′ |
| 5′-GTAGATGTGAGTGGCGTT-3′ | |||
| Ribosomal protein, large, P0 (Rplp0) | 36B4 | NM_007475 | 5′-GCTTCATTGTGGGAGCAGACA-3′ |
| 5′-CATGGTGTTCTTGCCCATCAG-3′ | |||
| Actin, beta | β-Actin | NM_007393 | 5′-AGCCATGTACGTAGCCATCCA -3′ |
| 5′-TCTCCGGAGTCCATCACAATG -3′ |
Ethics Statement.
Animal procedures were approved by the Austrian Federal Ministry for Science and Research, the ethics committee of the University of Graz, the U.K. Home Office, or the Wake Forest University School of Medicine.
Animals.
Mutant mice were generated as described (13, 16, 17). All studies were conducted in male mice on C56BL/6J background. Mice were bred and maintained at regular housing temperatures (23 °C) and 12-h light/12-h dark cycle starting at 7:00 a.m. Animals had ad libitum access to water and chow diet (4.5% fat, 34% starch, 5.0% sugar, and 22.0% protein; Ssniff Spezialdiäten) or HFD (34% fat, 1.1% starch, 23.8% sugar, and 24.1% protein; Ssniff EF R/M D12492 mod.). Mice fed a chow diet were analyzed at the age of 8–10 wk to allow a comparison with age-matched AKO mice. HFD intervention studies were started at the age of 4–6 wk and continued for 8 wk (AKO) or maximum 22 wk (AKO/cTg). Studies at thermoneutrality were performed at 30 °C. For pharmacological PPAR-γ activation, mice were fed a HFD supplemented with 200 mg/kg rosiglitazone (Rosi/HFD; Cayman Chemical) for 4 wk. For pair-feeding experiments, single-housed mice were daily fed according to control group. For physiological fasting experiments, mice were fasted from 7:00 to 11:00 a.m. For refed status, mice were fasted overnight from 8:00 p.m. until 7:00 a.m. the following day and then refed for 2 h.
Statistical Analyses.
Data are shown as means ± SD. Statistical significance between two groups was determined by Student’s two-tailed t test (unpaired or paired as indicated) and between more than two groups using two-way ANOVA and LSD (least significant difference) post hoc analyses. ANCOVA was applied for total EE by using body weight as covariance. For all analyses, group differences were considered statistically different for P < 0.05 (*), P < 0.01 (**), and P < 0.001 (***); and P < 0.05 compared with WT/cTg fed a HFD (§) and P < 0.05 for comparison between WT/cTg and AKO/cTg fed a Rosi/HFD (#).
SI Materials and Methods
Histology.
Animals were killed, and gWAT was fixed in 4% (vol/vol) buffered formalin and embedded in paraffin. Sections were stained with hematoxylin and eosing by using standard protocols.
Body Composition and Energy Balance.
Body mass composition was assessed in nonanesthetized mice by using the time-domain NMR minispec (Live Mice Analyzer system, Model LF90II, Bruker Optik). For food intake, mice were single housed and food consumption was measured every week. Locomotor activity, oxygen consumption, and carbon dioxide production of animals were monitored by using a laboratory animal monitoring system (PhenoMaster, TSE Systems). Energy expenditure (EE) was calculated from indirect calorimetry data as described (45). Mice were familiarized to single housing and drinking flasks for at least 24 h before metabolic phenotyping. Then, experiments were performed for four consecutive days. Data of the first recorded 24 h were excluded from all analyses and were then separated on the basis of regular light/dark cycle starting at 7:00 a.m. and averaged or summed up (locomotor activity) over three light/dark cycles. Data are presented as means over animal groups during light/dark period. For analyses of core body temperature, mice were implanted with a telemetry device TA-F10 (Data Sciences International). Before implantation, mice were familiarized to single housing. For the implantation procedure, mice were anesthetized with 80 µg of ketamine and 8 µg of xylacin per gram of body weight. The abdominal region was depilated and prepared with betadine. Thereafter, a small vertical incision was made in the center of the abdomen and the peritoneal cavity was opened. Then, a sterile telemetry device was inserted. The peritoneum and the abdomen were closed by using absorbable sutures and wound clips, respectively. Mice were returned to their home cages and kept on heating plates until full consciousness was retrieved. Animals received 0.1 mg of enrofloxacin and 2 mg of ibuprofen per mL of drinking water for 1 wk. Mice were allowed to recover from surgery for at least 2 wk. Finally, wound clips were removed before the start of analyses. CBT was assessed at an interval of 2 min for three consecutive days.
Relative Quantification of Gene Expression by Real-Time PCR.
Total RNA was extracted from gWAT derived from refed mice or SVF cells by using TRIzol reagent according to manufacturer’s instruction (Life Technologies). Reverse transcription of RNA was performed by using random primers (Life Technologies), and gene expression analyses were determined by quantitative PCR using the StepOnePlus Real-Time PCR System (Life Technologies) using SYBR Green technology. Relative mRNA levels were quantified by using ΔΔCt method using β-actin or 36B4 as housekeeping genes. A list of gene-specific primers is presented in Table S2.
Enzymatic Activity Assays.
DGAT activities were determined in 10-µg membrane fractions of gWAT from refed mice according to Coleman et al. (46) by using 3H-oleoly-CoA and rac-1,2-DG. The incorporated radioactivity into TGs was extracted, separated by TLC, and quantified by using scintillation counting (Tri-Carb 2100TR, Packard Instrument). For the determination of LPL activities, fresh gWAT tissues from refed mice were excised, weighed, minced with scissors, and transferred to ice-cold tubes containing 1 mL of DMEM containing 2% (wt/vol) FA-free BSA and 2 IU heparin. The tissues were incubated at 37 °C for 1 h. The mixture was then centrifuged and media was collected to determine heparin-releasable LPL activity. The substrate to assess LPL activity consisted of 1.2 × 10⁶ cpm glycerol tri[9,10(n)-3H]-oleate (PerkinElmer) and 1.04 µmol triolein per sample. Lipids were evaporated under a stream of nitrogen and emulsified by sonication (Bandelin SONOPLUS) in 0.1 M Tris/HCl (pH 8.6) and 0.1% Triton X-100. Then, 40 µL of heat-inactivated human serum as a source for apolipoprotein CII and 40 µL of 10% BSA as FA acceptor were added to the substrate. To determine LPL activities, 200 µL of substrate was mixed with 100 µL of media (heparin-releasable LPL) on ice and then incubated in a water bath at 37 °C for 1 h. Then, 3.25 mL of methanol/chloroform/heptane (10/9/7; vol/vol/vol) and 1 mL of 0.1 M potassium-carbonate/0.1 M boric acid (pH 10.5) were added to terminate the reaction. After the reaction, the mixture was intensively vortexed and centrifuged at 800 × g for 10 min, 0.2 mL of the upper aqueous phase was collected, and the radioactivity was analyzed by liquid scintillation counting (Tri-Carb 2100TR).
Ex Vivo Organ Analyses.
gWAT depots from refed mice were excised, cut into small pieces, and incubated for 3 h at 37 °C in DMEM media containing 1% FA-free BSA, 200 µM oleic acid (OA), 1 µCi 3H-OA, 1 g/L glucose, and 0.1 µCi 14C-glucose. Lipids were extracted by using CHCl3:methanol (2:1, vol/vol) for 2 h at room temperature. An aliquot of the lipid extract was then separated by TLC using hexane:diethylether:acetic acid (70:29:1, vol/vol/vol) as mobile phase. Lipids were visualized by using iodine vapor and comigrating radioactivity with TG species was quantified by scintillation counting.
PPAR-γ Immunoprecipitation.
Snap-frozen gWAT (500 mg) from refed mice was thawed on ice and disrupted by dounce homogenization in high salt lysis buffer (500 mM NaCl, 150 mM Tris⋅HCl pH 7.4, 0.2% Triton X-100, 5 µM Trichostatin A, 1 mM Na-butyrate, protease inhibitors). The homogenate was centrifuged at 20,000 × g and 4 °C for 30 min. The clear infranatant was then ultracentrifuged at 100,000 × g and 4 °C for 2 h for further delipidation. Immunoprecipitation was performed by incubating the delipidated lysate (= input) with 50 µL of PPARγ E-8 conjugated agarose (sc-7273; Santa Cruz Biotechnology) overnight at 4 °C. Bound proteins were eluted (= IP-fraction) after four consecutive wash steps with high salt lysis buffer by boiling the agarose in SDS sample buffer (50 mM Tris⋅HCl pH 6.8, 2.5% β-mercaptoethanol, 2% SDS, 10% glycerine). Protein expression was determined by immunoblotting using anti-PPAR-γ (H-100; Santa Cruz Biotechnology), and anti-GAPDH (2118, Cell Signaling Technology). Signal intensities were quantified by using ImageJ Software.
Dual Luciferase Reporter Assay.
Monkey embryonic kidney cells (COS-7; ATCC, CRL-1651) were seeded in 24-well plates, incubated with 200 µM OA complexed to BSA for 24 h, and then cotransfected by complexing the respective expression plasmids to Turbofect (Thermo Scientific Fisher). Control cells were cotransfected with pPPRE-Luc, a PPAR responsive expression vector of Photinus pyralis (firefly) luciferase, and pRLL-Luc encoding Renilla reniformis luciferase under control of a constitutive promoter (both were kind gifts from B. Steals, University of Lille, Lille, France). To determine the impact of ATGL and CGI-58 on PPAR-γ activation, cells were additionally transfected with expression vectors encoding PPAR-γ2, ATGL, or CGI-58. Total DNA amount was kept constant for all transfections by the addition of empty vectors. Luciferase activities were measured after passive cell lysis by using the Dual Luciferase Reporter Assay System (Promega) in a GloMax-Multi+ Microplate Multimode Reader (Promega).
In Vitro Adipogenesis.
For isolation and differentiation of adipose stroma vascular fraction (SVF), iWAT from two mice aged 6–8 wk was dissected, washed, minced, and digested at 37 °C for 45–60 min in PBS containing 1.5 mg/mL collagenase D (corresponds to 0.285 IU/mL; Roche Diagnostics), 3.2 mM CaCl2, 15 mM Hepes, and 0.5% BSA. Upon digestion, complete DMEM/F12 media containing Glutamax (Life Technologies), 10% FCS (Gibco, Life Technologies), pen/strep, and primocin (Lonza Cologne) was added to the mixture and then filtered through a 100-µm cell strainer to remove undigested tissue. The flow-through was centrifuged for 5 min at 600 × g at 4 °C. Floating lipids, adipocytes, and the supernatant were aspirated. The remaining cell pellet containing the SVF was resuspended in complete DMEM/F12, filtered through a 40-µm cell strainer, and centrifuged as described above. Finally, the SVF was resuspended in complete media and seeded on a 10-cm cell culture dish. At a confluency of ∼40%, SVF cells were propagated once. For differentiation, SVF cells were seeded on 6- and 12-well dishes and grown to confluency. Differentiation was induced by using Complete media supplemented with 1 µM dexamethasone, 0.5 mM isobutylmethylxanthine (IBMX), and 0.87 µM insulin. Two days after induction, cells were maintained in Complete media containing 0.87 µM insulin until harvest.
Oil Red O Staining.
Oil red O (500 mg) was dissolved in 100 mL of 2-propanol. For staining, this solution was diluted with double-distilled water in a ratio of 6:4 (vol/vol), allowed to sit for maximal 1 h, and cleared by using a 0.45-µm filter. Cells were washed with PBS, fixed with 4% buffered-formalin for 30 min, and washed. Then, lipids were stained for 15 min by using Oil red O solution. Cells were again washed with PBS, and lipid staining was visualized.
Blood Chemistry.
Blood glucose levels were monitored by using Accu-Check Active (Roche) or AlphaTRAK (Abbott) glucometer as indicated. Plasma levels of NEFA, TG, and glycerol were analyzed by using NEFA C (WAKO Chemicals), TG Infinity Reagent (Thermo Scientific), and Free Glycerol Reagent (Sigma Aldrich), respectively. Plasma insulin, leptin, and adiponectin were determined by using rat insulin, mouse leptin, and mouse adiponectin ELISA kits (Chrystal Chem).
GTT and ITT.
Tests to monitor glucose metabolism were performed in awake mice fasted for 2 h from 8:00 until 10:00 a.m. For i.p. GTTs, animals received a 200-µL bolus of a 20% glucose solution. For i.p. ITTs, mice were given 0.5 IU bovine insulin per kilogram of body weight. Blood was taken by tail vein puncture, and glucose levels were determined at indicated time points by using Accu-Check Active. For GTT, the area under the curve (AUC) above baseline glucose levels was calculated from absolute glucose values by using the trapezoid method. As a measure for insulin sensitivity, the reduction (delta) in blood glucose levels 30 min after insulin administration was calculated.
Hyperinsulinemic-Euglycemic Clamp and Calculations.
Clamp studies were performed as described (47) with minor modifications. Before the hyperinsulinemic-euglycemic clamp, mice were fasted for 4 h starting from 6:00 a.m. The study protocol consisted of a tracer equilibration period of 60 min (t = −60 to 0 min) starting at 9:00 a.m. followed by the experimental study of 90 min (t = 0–90 min). Before start of the equilibration period, animals were anesthetized via i.p. injection of an anesthetic/analgetic mixture to attain 0.3125 µg/kg fentanyl citrate (Martindale Pharmaceuticals), 62.5 µg/kg vetranquil (Novartis Animal Health), and 62.5 µg/kg midazolam (Roche). During the entire study, animals were kept on heating pads and s.c. anesthetic depots (100–200 µL) were given to maintain sedation. Then, a canula (27G 3/4-inch, BD Microlane) was placed into one tail vein to allow infusion of different solutions.
Equilibration of the tracer was started at t = – 60 min by using a priming infusion rate of 10 µCi/h [3-3H]-D-glucose for 1 min and maintained at 0.72 µCi/h for 1 h. Blood samples of ∼80 µL were collected at t = –10 and 0 min to assess basal parameters. Then, the clamp was started at t = 0 min applying a priming dose of human insulin (0.55 mU) followed by a constant infusion of insulin and [3-3H]-D-glucose tracer at 5.5 mU/h and 0.72 µCi/h, respectively. To compensate for insulin action, a variable infusion of 12.5% D-glucose was initiated 5–10 min after the clamp was started. Blood glucose levels were monitored every 5 min, and the GIR was adjusted accordingly to maintain euglycemia. At t = 30 min, blood sampling for glucose measurement was changed to 10-min intervals. Blood samples (∼80 µL) were collected at steady-state hyperinsulinemia (hyperins; t = 70–90 min) for determination of plasma parameters. At the end of hyperinsulinemic-euglycemic clamp (t = 90), animals were killed by cervical dislocation. For all time points, fresh blood was collected via tail cuts and blood glucose was determined by using AlphaTRAK glucometer. Haematocrit differed less than 5% between basal and hyperinsulinemic state. Nonsteady state analyses were applied to calculate the tracer-derived rate of glucose appearance according to Steele’s equation (48, 49).
Processing and Analysis of Hyperinsulinemic-Euglycemic Plasma Samples.
To determine the specific activity of plasma glucose, 10 µL of plasma were diluted with 90 µL of deionized water. Thereof, 80 µL were mixed with 80 µL of 20% trichloric acid and centrifuged for 10 min at 10,000 × g and 4 °C. To remove radiolabeled water, 150 µL of supernatant were transferred to a new tube, evaporated under a constant nitrogen stream at 70 °C, and resuspended in 100 µL of deionized water and the radioactivity in 90 µL was determined. All samples were measured by scintillation counting using SafeScint 1:1 (LabLogic Systems Limited) and β-counter (Hidex 300SL; Hidex).
Insulin-Stimulated Glucose Uptake.
During the clamp, a bolus of 2.5 µCi [1-14C]-2-deoxy-D-glucose was injected into the tail vein at t = 50 min to determine insulin-stimulated glucose uptake. Tissues were collected at the end of the clamp (t = 90 min) and snap frozen until further processing. To determine the accumulation of [1-14C]-2-deoxy-D-glucose-phosphate ([1-14C]-2-DGP) in different organs, tissues were homogenized in 2 mL of 0.5% perchloric acid and centrifuged for 20 min at 2,000 × g at 4 °C. Then, 1 mL of supernatant was neutralized by using 50 µL of 1 M K-phosphate (pH 7.0) and 50 µL of 10% KOH. After centrifugation for 10 min, the radioactivity was determined in an aliquot of 400 µL by scintillation counting (Hidex) representing total tissue counts of [1-14C]-2-DGP and [1-14C]-2-deoxy-D-glucose. In the remainder (500 µL), [1-14C]-2-DGP was precipitated by using 250 µL of 0.15 M Ba(OH)2 and 250 µL of 0.15 M ZnSO4. Both alkaline solutions were prepared before precipitation. After centrifugation at 20,000 × g and 5 min, 800 µL of the supernatant were measured to determine [1-14C]-2-deoxy-D-glucose only. [1-14C]-2-DGP was calculated as the difference between total tissue counts and 2-deoxy-D-glucose counts only. Protein content was determined by using BCA protein assay described below.
Tissue Lipid Analyses.
Lipids from mixed quadricepses or liver (∼100 mg) were extracted in the presence of an internal standard mix containing ceramide 17:0 and DG 26:0 (∼5 µg of each lipid species) by using CHCl3:methanol (2:1, vol/vol). For the analyses of ceramides, total lipid extracts were dried, redissolved in 400 µL of CHCl3:methanol:water (16:16:5, vol/vol/vol), and 400 µL of methanolic 0.4 M NaOH. After incubation at room temperature for 1 h, 800 µL of 0.5 M EDTA and 150 µL of 0.5 M acetic acid were added. Then, lipids were extracted three times by using 2 mL of CHCl3 and again dried under nitrogen. All lipids were dissolved in CHCl3:methanol (2:1, 20%) and 2-propanol (80%) before analysis by UPLC-MS as described (50).
Determination of Protein Content.
For determination of protein content, tissue pellets from LPL assays and 2-DGP uptake were lysed overnight at 55 °C in 0.3 M NaOH/0.1% SDS, and protein content was analyzed by BCA protein assay (Pierce Thermo Scientific). Protein content in gWAT membrane fractions and cell lysates was determined by using Bio-Rad protein assay. BSA was used as standard.
Acknowledgments
We thank S. Huetter, S. Osborn, and D. Hart for excellent technical assistance; W. Alzoughbi and S. Schauer for histological analyses; and M. Kumari, W. Dijk, and G. Schoiswohl for experimental advice in SVF differentiation. This research was supported by Foundation Leducq Transatlantic Network TNT Grant 12CVD04; Doktoratskolleg Molecular Enzymology Grant W901; the Wittgenstein Award Z136; and SFB LIPOTOX F30, which are funded by the Austrian Science Fund. R. Zechner has received funding from the European Research Council under European Union’s Seventh Framework Programme Grant FP/2007-2013/ERC Grant Agreement 340896, LipoCheX, and we gratefully acknowledge the support of NAWI Graz, Medical Research Council Disease Model Core, and Wellcome Trust.
Footnotes
The authors declare no conflict of interest.
This article is a PNAS Direct Submission.
This article contains supporting information online at www.pnas.org/lookup/suppl/doi:10.1073/pnas.1516004112/-/DCSupplemental.
References
- 1.Rosen ED, Spiegelman BM. What we talk about when we talk about fat. Cell. 2014;156(1-2):20–44. doi: 10.1016/j.cell.2013.12.012. [DOI] [PMC free article] [PubMed] [Google Scholar]
- 2.Lefterova MI, et al. PPARgamma and C/EBP factors orchestrate adipocyte biology via adjacent binding on a genome-wide scale. Genes Dev. 2008;22(21):2941–2952. doi: 10.1101/gad.1709008. [DOI] [PMC free article] [PubMed] [Google Scholar]
- 3.Rosen ED, Walkey CJ, Puigserver P, Spiegelman BM. Transcriptional regulation of adipogenesis. Genes Dev. 2000;14(11):1293–1307. [PubMed] [Google Scholar]
- 4.Zechner R, et al. FAT SIGNALS--lipases and lipolysis in lipid metabolism and signaling. Cell Metab. 2012;15(3):279–291. doi: 10.1016/j.cmet.2011.12.018. [DOI] [PMC free article] [PubMed] [Google Scholar]
- 5.Collins S. A heart-adipose tissue connection in the regulation of energy metabolism. Nat Rev Endocrinol. 2014;10(3):157–163. doi: 10.1038/nrendo.2013.234. [DOI] [PubMed] [Google Scholar]
- 6.Zimmermann R, et al. Decreased fatty acid esterification compensates for the reduced lipolytic activity in hormone-sensitive lipase-deficient white adipose tissue. J Lipid Res. 2003;44(11):2089–2099. doi: 10.1194/jlr.M300190-JLR200. [DOI] [PubMed] [Google Scholar]
- 7.Rodriguez-Cuenca S, Carobbio S, Vidal-Puig A. Ablation of Pparg2 impairs lipolysis and reveals murine strain differences in lipolytic responses. FASEB J. 2012;26(5):1835–1844. doi: 10.1096/fj.11-193631. [DOI] [PubMed] [Google Scholar]
- 8.Shen WJ, et al. Hormone-sensitive lipase modulates adipose metabolism through PPARγ. Biochim Biophys Acta. 2011;1811(1):9–16. doi: 10.1016/j.bbalip.2010.10.001. [DOI] [PMC free article] [PubMed] [Google Scholar]
- 9.Harada K, et al. Resistance to high-fat diet-induced obesity and altered expression of adipose-specific genes in HSL-deficient mice. Am J Physiol Endocrinol Metab. 2003;285(6):E1182–E1195. doi: 10.1152/ajpendo.00259.2003. [DOI] [PubMed] [Google Scholar]
- 10.Mottillo EP, et al. Coupling of lipolysis and de novo lipogenesis in brown, beige, and white adipose tissues during chronic β3-adrenergic receptor activation. J Lipid Res. 2014;55(11):2276–2286. doi: 10.1194/jlr.M050005. [DOI] [PMC free article] [PubMed] [Google Scholar]
- 11.Ahmadian M, et al. PPARγ signaling and metabolism: The good, the bad and the future. Nat Med. 2013;19(5):557–566. doi: 10.1038/nm.3159. [DOI] [PMC free article] [PubMed] [Google Scholar]
- 12.Schweiger M, Lass A, Zimmermann R, Eichmann TO, Zechner R. Neutral lipid storage disease: Genetic disorders caused by mutations in adipose triglyceride lipase/PNPLA2 or CGI-58/ABHD5. Am J Physiol Endocrinol Metab. 2009;297(2):E289–E296. doi: 10.1152/ajpendo.00099.2009. [DOI] [PubMed] [Google Scholar]
- 13.Haemmerle G, et al. Defective lipolysis and altered energy metabolism in mice lacking adipose triglyceride lipase. Science. 2006;312(5774):734–737. doi: 10.1126/science.1123965. [DOI] [PubMed] [Google Scholar]
- 14.Kienesberger PC, et al. Adipose triglyceride lipase deficiency causes tissue-specific changes in insulin signaling. J Biol Chem. 2009;284(44):30218–30229. doi: 10.1074/jbc.M109.047787. [DOI] [PMC free article] [PubMed] [Google Scholar]
- 15.Hoy AJ, et al. Adipose triglyceride lipase-null mice are resistant to high-fat diet-induced insulin resistance despite reduced energy expenditure and ectopic lipid accumulation. Endocrinology. 2011;152(1):48–58. doi: 10.1210/en.2010-0661. [DOI] [PubMed] [Google Scholar]
- 16.Haemmerle G, et al. ATGL-mediated fat catabolism regulates cardiac mitochondrial function via PPAR-α and PGC-1. Nat Med. 2011;17(9):1076–1085. doi: 10.1038/nm.2439. [DOI] [PMC free article] [PubMed] [Google Scholar]
- 17.Schoiswohl G, et al. Adipose triglyceride lipase plays a key role in the supply of the working muscle with fatty acids. J Lipid Res. 2010;51(3):490–499. doi: 10.1194/jlr.M001073. [DOI] [PMC free article] [PubMed] [Google Scholar]
- 18.Tschöp MH, et al. A guide to analysis of mouse energy metabolism. Nat Methods. 2012;9(1):57–63. doi: 10.1038/nmeth.1806. [DOI] [PMC free article] [PubMed] [Google Scholar]
- 19.Gupta RK, et al. Zfp423 expression identifies committed preadipocytes and localizes to adipose endothelial and perivascular cells. Cell Metab. 2012;15(2):230–239. doi: 10.1016/j.cmet.2012.01.010. [DOI] [PMC free article] [PubMed] [Google Scholar]
- 20.Lu M, et al. Brain PPAR-γ promotes obesity and is required for the insulin-sensitizing effect of thiazolidinediones. Nat Med. 2011;17(5):618–622. doi: 10.1038/nm.2332. [DOI] [PMC free article] [PubMed] [Google Scholar]
- 21.Ryan KK, et al. A role for central nervous system PPAR-γ in the regulation of energy balance. Nat Med. 2011;17(5):623–626. doi: 10.1038/nm.2349. [DOI] [PMC free article] [PubMed] [Google Scholar]
- 22.Myers MG, Jr, Olson DP. Central nervous system control of metabolism. Nature. 2012;491(7424):357–363. doi: 10.1038/nature11705. [DOI] [PubMed] [Google Scholar]
- 23.Lin S, Thomas TC, Storlien LHHX, Huang XF. Development of high fat diet-induced obesity and leptin resistance in C57Bl/6J mice. Int J Obes Relat Metab Disord. 2000;24(5):639–646. doi: 10.1038/sj.ijo.0801209. [DOI] [PubMed] [Google Scholar]
- 24.Escher P, et al. Rat PPARs: Quantitative analysis in adult rat tissues and regulation in fasting and refeeding. Endocrinology. 2001;142(10):4195–4202. doi: 10.1210/endo.142.10.8458. [DOI] [PubMed] [Google Scholar]
- 25.Vidal-Puig A, et al. Regulation of PPAR gamma gene expression by nutrition and obesity in rodents. J Clin Invest. 1996;97(11):2553–2561. doi: 10.1172/JCI118703. [DOI] [PMC free article] [PubMed] [Google Scholar]
- 26.Tontonoz P, Hu E, Graves RA, Budavari AI, Spiegelman BM. mPPAR gamma 2: Tissue-specific regulator of an adipocyte enhancer. Genes Dev. 1994;8:1224–1234. doi: 10.1101/gad.8.10.1224. [DOI] [PubMed] [Google Scholar]
- 27.Wu Z, et al. Cross-regulation of C/EBP α and PPAR γ controls the transcriptional pathway of adipogenesis and insulin sensitivity. Mol Cell. 1999;3(2):151–158. doi: 10.1016/s1097-2765(00)80306-8. [DOI] [PubMed] [Google Scholar]
- 28.Elberg G, Gimble JM, Tsai SY. Modulation of the murine peroxisome proliferator-activated receptor gamma 2 promoter activity by CCAAT/enhancer-binding proteins. J Biol Chem. 2000;275(36):27815–27822. doi: 10.1074/jbc.M003593200. [DOI] [PubMed] [Google Scholar]
- 29.Farmer SR. Transcriptional control of adipocyte formation. Cell Metab. 2006;4(4):263–273. doi: 10.1016/j.cmet.2006.07.001. [DOI] [PMC free article] [PubMed] [Google Scholar]
- 30.Rosen ED, et al. C/EBPalpha induces adipogenesis through PPARgamma: A unified pathway. Genes Dev. 2002;16(1):22–26. doi: 10.1101/gad.948702. [DOI] [PMC free article] [PubMed] [Google Scholar]
- 31.Fajas L, et al. Regulation of peroxisome proliferator-activated receptor gamma expression by adipocyte differentiation and determination factor 1/sterol regulatory element binding protein 1: Implications for adipocyte differentiation and metabolism. Mol Cell Biol. 1999;19(8):5495–5503. doi: 10.1128/mcb.19.8.5495. [DOI] [PMC free article] [PubMed] [Google Scholar]
- 32.Khan SA, et al. ATGL-catalyzed lipolysis regulates SIRT1 to control PGC-1α/PPAR-α signaling. Diabetes. 2015;64(2):418–426. doi: 10.2337/db14-0325. [DOI] [PMC free article] [PubMed] [Google Scholar]
- 33.Ahmadian M, et al. Desnutrin/ATGL is regulated by AMPK and is required for a brown adipose phenotype. Cell Metab. 2011;13(6):739–748. doi: 10.1016/j.cmet.2011.05.002. [DOI] [PMC free article] [PubMed] [Google Scholar]
- 34.Tang T, et al. Desnutrin/ATGL activates PPARδ to promote mitochondrial function for insulin secretion in islet β cells. Cell Metab. 2013;18(6):883–895. doi: 10.1016/j.cmet.2013.10.012. [DOI] [PMC free article] [PubMed] [Google Scholar]
- 35.Mottillo EP, Bloch AE, Leff T, Granneman JG. Lipolytic products activate peroxisome proliferator-activated receptor (PPAR) α and δ in brown adipocytes to match fatty acid oxidation with supply. J Biol Chem. 2012;287(30):25038–25048. doi: 10.1074/jbc.M112.374041. [DOI] [PMC free article] [PubMed] [Google Scholar]
- 36.Strom K, et al. Attainment of brown adipocyte features in white adipocytes of hormone-sensitive lipase null mice. PLoS One. 2008;3:e1793. doi: 10.1371/journal.pone.0001793. [DOI] [PMC free article] [PubMed] [Google Scholar]
- 37.Sekiya M, et al. Absence of hormone-sensitive lipase inhibits obesity and adipogenesis in Lep ob/ob mice. J Biol Chem. 2004;279(15):15084–15090. doi: 10.1074/jbc.M310985200. [DOI] [PubMed] [Google Scholar]
- 38.Albert JS, et al. Null mutation in hormone-sensitive lipase gene and risk of type 2 diabetes. N Engl J Med. 2014;370(24):2307–2315. doi: 10.1056/NEJMoa1315496. [DOI] [PMC free article] [PubMed] [Google Scholar]
- 39.Rodriguez-Cuenca S, et al. Peroxisome proliferator-activated receptor γ-dependent regulation of lipolytic nodes and metabolic flexibility. Mol Cell Biol. 2012;32(8):1555–1565. doi: 10.1128/MCB.06154-11. [DOI] [PMC free article] [PubMed] [Google Scholar]
- 40.Butler AA, Kozak LP. A recurring problem with the analysis of energy expenditure in genetic models expressing lean and obese phenotypes. Diabetes. 2010;59(2):323–329. doi: 10.2337/db09-1471. [DOI] [PMC free article] [PubMed] [Google Scholar]
- 41.Wernstedt Asterholm I, et al. Adipocyte inflammation is essential for healthy adipose tissue expansion and remodeling. Cell Metab. 2014;20(1):103–118. doi: 10.1016/j.cmet.2014.05.005. [DOI] [PMC free article] [PubMed] [Google Scholar]
- 42.Girousse A, et al. Partial inhibition of adipose tissue lipolysis improves glucose metabolism and insulin sensitivity without alteration of fat mass. PLoS Biol. 2013;11(2):e1001485. doi: 10.1371/journal.pbio.1001485. [DOI] [PMC free article] [PubMed] [Google Scholar]
- 43.Taschler U, et al. Monoglyceride lipase deficiency in mice impairs lipolysis and attenuates diet-induced insulin resistance. J Biol Chem. 2011;286(20):17467–17477. doi: 10.1074/jbc.M110.215434. [DOI] [PMC free article] [PubMed] [Google Scholar]
- 44.Perry RJ, et al. Hepatic acetyl CoA links adipose tissue inflammation to hepatic insulin resistance and type 2 diabetes. Cell. 2015;160(4):745–758. doi: 10.1016/j.cell.2015.01.012. [DOI] [PMC free article] [PubMed] [Google Scholar]
- 45.Elia M, Livesey G. Energy expenditure and fuel selection in biological systems: The theory and practice of calculations based on indirect calorimetry and tracer methods. World Rev Nutr Diet. 1992;70:68–131. doi: 10.1159/000421672. [DOI] [PubMed] [Google Scholar]
- 46.Coleman RA. Diacylglycerol acyltransferase and monoacylglycerol acyltransferase from liver and intestine. Methods Enzymol. 1992;209:98–104. doi: 10.1016/0076-6879(92)09013-s. [DOI] [PubMed] [Google Scholar]
- 47.Voshol PJ, et al. Increased hepatic insulin sensitivity together with decreased hepatic triglyceride stores in hormone-sensitive lipase-deficient mice. Endocrinology. 2003;144(8):3456–3462. doi: 10.1210/en.2002-0036. [DOI] [PubMed] [Google Scholar]
- 48.Proietto J, et al. Non-steady-state measurement of glucose turnover in rats by using a one-compartment model. Am J Physiol. 1987;252(1 Pt 1):E77–E84. doi: 10.1152/ajpendo.1987.252.1.E77. [DOI] [PubMed] [Google Scholar]
- 49.Steele R. Influences of glucose loading and of injected insulin on hepatic glucose output. Ann N Y Acad Sci. 1959;82:420–430. doi: 10.1111/j.1749-6632.1959.tb44923.x. [DOI] [PubMed] [Google Scholar]
- 50.Knittelfelder OL, Weberhofer BP, Eichmann TO, Kohlwein SD, Rechberger GN. A versatile ultra-high performance LC-MS method for lipid profiling. J Chromatogr B Analyt Technol Biomed Life Sci. 2014;951-952:119–128. doi: 10.1016/j.jchromb.2014.01.011. [DOI] [PMC free article] [PubMed] [Google Scholar]


