Significance
Epithelial barrier integrity is dependent on progenitor cells that either divide to replenish themselves or differentiate into a functional epithelium. In the placenta, cytotrophoblast cells comprise this progenitor population, but the differentiation program they undertake is unlike any other in human tissues: acquisition of hormonogenesis and cell fusion to form a syncytialized (syncytio)trophoblast. Syncytiotrophoblast forms the primary epithelial barrier separating maternal and fetal tissue and performs functions vital for pregnancy. In the present study, we found that OVO-like 1 (OVOL1), a transcription factor homolog of Drosophila ovo, regulates the transition between progenitor and differentiated cytotrophoblast. It does so by repressing genes that maintain cytotrophoblast progenitor traits. This study provides insight into the role of OVOL1 in human trophoblast development.
Keywords: epithelial barrier, placenta, trophoblast, OVO-like 1, differentiation
Abstract
Epithelial barrier integrity is dependent on progenitor cells that either divide to replenish themselves or differentiate into a specialized epithelium. This paradigm exists in human placenta, where cytotrophoblast cells either propagate or undergo a unique differentiation program: fusion into an overlying syncytiotrophoblast. Syncytiotrophoblast is the primary barrier regulating the exchange of nutrients and gases between maternal and fetal blood and is the principal site for synthesizing hormones vital for human pregnancy. How trophoblast cells regulate their differentiation into a syncytium is not well understood. In this study, we show that the transcription factor OVO-like 1 (OVOL1), a homolog of Drosophila ovo, regulates the transition from progenitor to differentiated trophoblast cells. OVOL1 is expressed in human placenta and was robustly induced following stimulation of trophoblast differentiation. Disruption of OVOL1 abrogated cytotrophoblast fusion and inhibited the expression of a broad set of genes required for trophoblast cell fusion and hormonogenesis. OVOL1 was required to suppress genes that maintain cytotrophoblast cells in a progenitor state, including MYC, ID1, TP63, and ASCL2, and bound specifically to regions upstream of each of these genes. Our results reveal an important function of OVOL1 as a regulator of trophoblast progenitor cell fate during human trophoblast development.
Epithelial cells turn over regularly and are reliant on a pool of cells that either replenish the reservoir of progenitor cells or differentiate into the specialized epithelium required for that tissue’s function. An excellent paradigm of epithelial turnover exists in the human placenta, where mononuclear cytotrophoblast cells lining the inner portion of the chorionic villi comprise the progenitor cells of the placental epithelium. These cells either propagate to maintain an adequate reservoir of progenitor cells or undergo a differentiation program that results in fusion with an overlying syncytium (1). This syncytium, termed “syncytiotrophoblast,” forms the principal epithelial barrier separating maternal and fetal blood. Syncytiotrophoblast plays a vital role in regulating nutrient, water, waste, and gas exchange between maternal and fetal circulations and produces various hormones vital for fetal development and the maintenance of human pregnancy (2). Because of its importance for fetal health and development, disruptions in syncytiotrophoblast formation or functionality can have devastating consequences for pregnancy (3–5).
Syncytiotrophoblast has a limited lifespan and is shed into the maternal circulation throughout pregnancy (6, 7). Therefore, to maintain the integrity of the maternal–fetal exchange surface, syncytiotrophoblast is continually replenished by select populations of cytotrophoblast cells that forego self-renewal and instead fuse into the overlying syncytiotrophoblast. This feature, analogous to paradigms established in other epithelial barrier systems in which differentiated cells are replenished by underlying stem/progenitor cell populations but unique in the nature of the differentiation program (cell fusion), is fundamental to human placentation (1). A key question that remains to be addressed is how cytotrophoblast cells “decide” to exit their progenitor state and commence cell fusion. Activation of cytotrophoblast fusion is a highly synchronized event, requiring that (i) the genes involved with maintenance of progenitor states are turned off and (ii) genes characteristic of differentiated phenotypes are turned on. To date, several regulatory factors and signaling pathways have been linked with the promotion of human cytotrophoblast fusion (reviewed in refs. 8–10). The most notable of these factors include the syncytin genes ERVW-1 and ERVFRD-1, which are co-opted retroviral env genes embedded in the human genome. These genes, uniquely expressed by trophoblast cells, encode proteins that act as cellular fusogens (11, 12). Transcriptional activation of both ERVW-1 and ERVFRD-1 is promoted by the chorion-specific transcription factor glial cells missing-1 (GCM1) (13, 14). However, there is a dearth of knowledge about how regulatory factors promoting the maintenance of the cytotrophoblast progenitor state are suppressed to facilitate cell differentiation.
To gain insight into potential transcriptional regulators of trophoblast differentiation, we performed a DNA microarray using a well-characterized in vitro model of human trophoblast fusion. Using this approach, we found that OVO-like 1 (OVOL1) was the most highly induced transcription factor associated with trophoblast syncytialization. The robust increase of OVOL1 expression is intriguing, given its known role as an early inducer of terminal differentiation in distinct epithelial cell lineages of a wide spectrum of organisms [e.g., flies, worms, and mice (15–20)]. OVOL1 is a highly conserved C2H2 zinc finger transcription factor homologous to Drosophila ovo. An initial characterization of OVOL1 expression in human tissues revealed high levels in placenta and weaker expression in only one other organ, fetal kidney (21), although studies in mice indicate that it may be expressed in some other epithelial tissues (e.g., epidermis and male germinal epithelium) (17). Given the evidence that OVOL1 is involved in the regulation of epithelial differentiation during early development, and because trophoblast cells are epithelial in nature, we postulated that OVOL1 is involved in human trophoblast differentiation. In this study, we examined OVOL1 expression in human placenta and used a loss-of-function approach using several models of human trophoblast cell differentiation to determine the importance of OVOL1 in syncytiotrophoblast formation. We show that OVOL1 is required to restrict the expression of key factors that maintain cytotrophoblast cells in a progenitor state, thereby facilitating the induction of differentiation-associated transcripts, including major genes required for syncytiotrophoblast hormonogenesis and both human fusogenic syncytin genes.
Results
Gene-Expression Changes Associated with Syncytiotrophoblast Development.
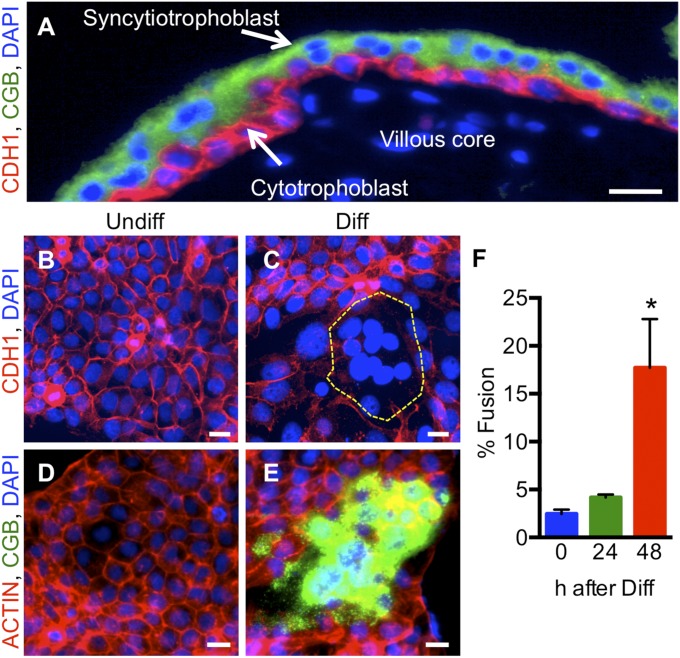
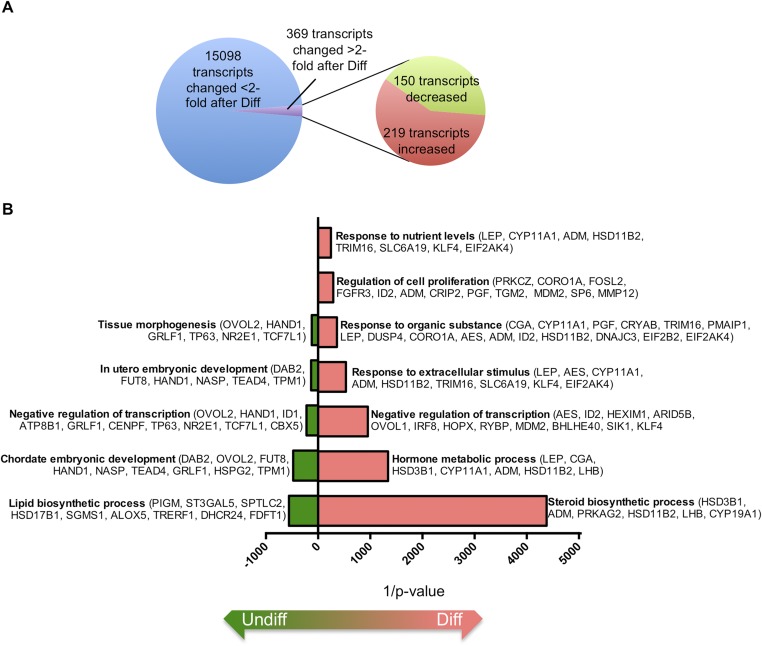
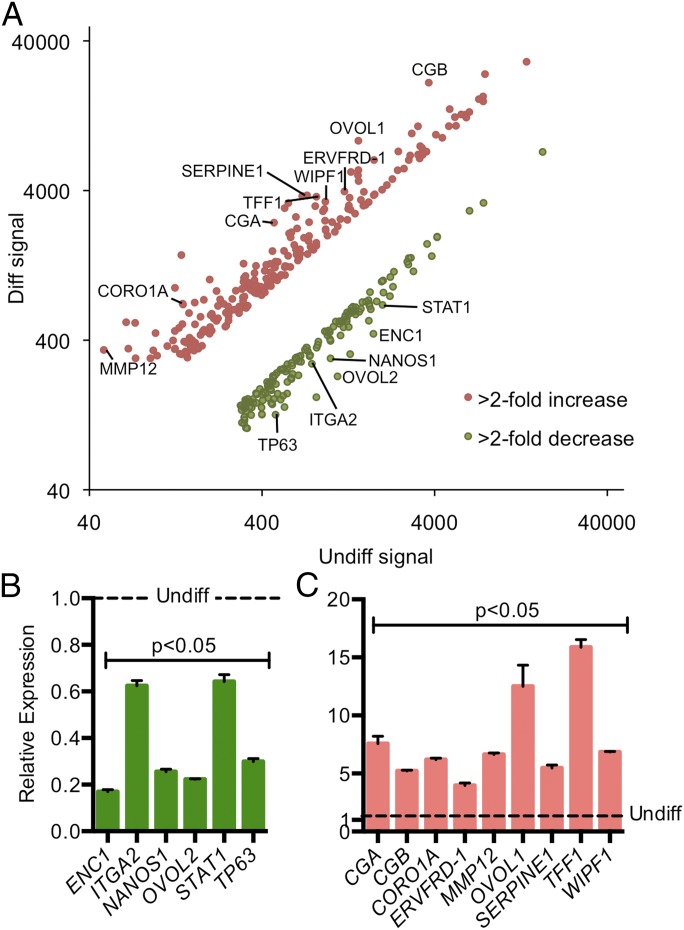
In human placenta, trophoblast cells lining chorionic villi are segregated into two layers: a basal layer of mononuclear cytotrophoblast cells that express E-cadherin (CDH1) and an outer multinucleated syncytiotrophoblast layer that lacks CDH1 but robustly expresses the pregnancy hormone chorionic gonadotropin [CG; immunostaining for the CG β subunit (CGB) is shown in Fig. 1A]. This cellular transition from CDH1-expressing mononuclear trophoblast cells to CG-expressing (CDH1-lacking) multinucleated syncytiotrophoblast can be modeled in vitro by exposing BeWo trophoblast cells to cAMP analogs (Fig. 1 B–E) (22). Induction of differentiation in this model requires that trophoblast cells switch from a progenitor state to a committed cytotrophoblast state before ultimately undergoing cell fusion. We noted a progressive, time-dependent increase in syncytialization events (clusters of cells that lost their CDH1 skeleton and gained expression of CGB) following exposure to 250 μM 8-bromo-cAMP (henceforth referred to as “differentiating conditions” unless otherwise indicated). When these cells were exposed to differentiating conditions for 48 h, ∼20% of cell nuclei were contained within syncytia (Fig. 1F). Therefore, to profile early changes in gene expression before the initiation of cell fusion, we performed a DNA microarray comparing cells cultured under control conditions or following incubation for 24 h in differentiating conditions. Overall, from a total of 15,098 transcripts examined, 369 were changed significantly (more than twofold) between the two groups (P < 0.05). Of these, 150 transcripts were decreased, and 219 transcripts were increased (Fig. S1A). The top 45 transcripts exhibiting an increase or decrease following exposure to differentiating conditions are listed in Table S1. Transcripts that were induced following differentiation included those involved in hormonogenesis (CGA, CGB, HSD3B1, HSD11B2, and CYP19A1), as is consistent with transitioning to an endocrinologically competent syncytiotrophoblast (Fig. S1B and Table S1). From this DNA microarray analysis, we determined that the conserved C2H2 zinc finger transcription factor OVOL1 was the most highly up-regulated transcript encoding a transcription factor (5.95-fold increase) (Fig. 2).
Fig. 1.
In situ and in vitro analysis of syncytiotrophoblast. (A) Eight-week human placenta immunostained for CDH1 (red) and CGB (green). Nuclei are counterstained blue using DAPI. Note that CDH1 is expressed specifically by cytotrophoblast cells, whereas CGB localizes exclusively to syncytiotrophoblast. (B–E) BeWo trophoblast cells cultured under undifferentiated (Undiff; B and D) or differentiating (Diff; C and E) conditions. Cells subsequently were immunostained with CDH1 (B and C) or CGB (D and E). Cells were counterstained with phalloidin in D and E to demarcate the actin cytoskeleton and with DAPI to identify nuclei in all panels. Note the presence of cell clusters that have lost CDH1 expression and express CGB following exposure to differentiating conditions. (Scale bars, 25 μm.) (F) Graphical depiction showing the number of nuclei associated with fused cells following 0, 24, and 48 h exposure to differentiating conditions. *P < 0.05, n = 4.
Fig. S1.
Gene pathway analysis comparing trophoblast cells cultured under undifferentiated or differentiating conditions. (A) Pie chart showing the number of transcripts with altered expression levels in BeWo trophoblast cells following 24-h exposure to differentiating (Diff) conditions compared with cells maintained in undifferentiating (Undiff) conditions. (B) DAVID pathway analysis of genes significantly altered following BeWo trophoblast differentiation.
Table S1.
Top up-regulated and down-regulated transcripts following BeWo trophoblast differentiation
| Gene | Undifferentiated | Differentiating | FoldΔ | Gene name |
| Up-regulated transcripts | ||||
| PRR9 | 136.31 | 1,482.43 | 10.88 | Proline rich 9 |
| CRIP2 | 65.28 | 527.13 | 8.07 | Cysteine-rich protein 2 |
| GREB1 | 125.15 | 895.39 | 7.15 | GREB1 protein |
| MMP12 | 48.45 | 344.33 | 7.11 | Matrix metallopeptidase 12 (macrophage elastase) |
| TGM2 | 73.62 | 522.15 | 7.09 | Transglutaminase 2 |
| OVOL1 | 1,445.95 | 8607.53 | 5.95 | Ovo-like 1(Drosophila) |
| CGB | 3,698.46 | 2,1043.60 | 5.69 | CG; β polypeptide |
| SLC6A19 | 540.41 | 3052.59 | 5.65 | Solute carrier family 6 (neutral amino acid transporter); member 19 |
| LHB | 683.57 | 3674.48 | 5.38 | Luteinizing hormone beta polypeptide |
| SLC19A1 | 67.21 | 351.21 | 5.23 | Solute carrier family 19 (folate transporter); member 1 |
| CGA | 469.15 | 2,440.61 | 5.20 | Glycoprotein hormones; alpha polypeptide |
| OVOL1 | 199.01 | 1,016.53 | 5.11 | Ovo-like 1(Drosophila) |
| TFF1 | 729.03 | 3,712.17 | 5.09 | Trefoil factor 1 |
| CORO1A | 138.75 | 701.04 | 5.05 | Coronin; actin-binding protein; 1A |
| INSL4 | 139.38 | 692.86 | 4.97 | Insulin-like 4 (placenta) |
| COL27A1 | 96.62 | 446.13 | 4.62 | Collagen; type XXVII; alpha 1 |
| SERPINE1 | 825.81 | 3,636.59 | 4.40 | Serpin peptidase inhibitor; clade E, member 1 |
| RSAD2 | 162.93 | 713.58 | 4.38 | Radical S-adenosyl methionine domain containing 2 |
| SIK1 | 628.01 | 2,664.13 | 4.24 | Salt-inducible kinase 1 |
| PTPN21 | 312.58 | 1,298.91 | 4.16 | Protein tyrosine phosphatase; nonreceptor type 21 |
| FOSL2 | 74.05 | 302.84 | 4.09 | FOS-like antigen 2 |
| SGK1 | 1,308.83 | 5,322.08 | 4.07 | Serum/glucocorticoid regulated kinase 1 |
| HSD3B1 | 183.95 | 744.51 | 4.05 | Hydroxy-δ-5-steroid dehydrogenase; |
| ANGPT4 | 150.97 | 607.60 | 4.02 | Angiopoietin 4 |
| WIPF1 | 217.95 | 852.72 | 3.91 | WAS/WASL interacting protein family; member 1 |
| CD59 | 813.51 | 3,146.33 | 3.87 | CD59 molecule; complement regulatory protein |
| CXCR7 | 1,446.51 | 5,479.55 | 3.79 | Chemokine (C-X-C motif) receptor 7 |
| DUSP4 | 138.23 | 512.31 | 3.71 | Dual specificity phosphatase 4 |
| TGM2 | 124.98 | 460.57 | 3.69 | Transglutaminase 2 |
| RSAD2 | 132.11 | 483.21 | 3.66 | Radical S-adenosyl methionine domain containing 2 |
| VGLL3 | 93.74 | 341.83 | 3.65 | Vestigial like 3 (Drosophila) |
| CD59 | 930.67 | 3,371.21 | 3.62 | CD59 molecule; complement regulatory protein |
| MXD1 | 573.73 | 2,066.21 | 3.60 | MAX dimerization protein 1 |
| SP6 | 1,781.73 | 6,398.21 | 3.59 | Sp6 transcription factor |
| FGFR3 | 591.76 | 2,105.17 | 3.56 | Fibroblast growth factor receptor 3 |
| HOPX | 1,437.74 | 5,054.33 | 3.52 | HOP homeobox |
| PMAIP1 | 459.45 | 1,576.06 | 3.43 | Phorbol-12-myristate-13-acetate-induced protein 1 |
| NDRG1 | 368.75 | 1,255.84 | 3.41 | N-myc downstream regulated 1 |
| LAIR2 | 3,202.28 | 10,751.16 | 3.36 | Leukocyte-associated Ig-like receptor 2 |
| ADAM33 | 90.26 | 302.81 | 3.36 | ADAM metallopeptidase domain 33 |
| C15orf48 | 320.76 | 1,074.67 | 3.35 | Chromosome 15 ORF 48 |
| FAM43A | 585.31 | 1,946.03 | 3.32 | Family with sequence similarity 43; member A |
| ST8SIA4 | 314.41 | 1,043.62 | 3.32 | ST8 alpha-N-acetyl-neuraminide alpha-2;8-sialyltransferase 4 |
| HERV-FRD | 1,200.14 | 3,946.61 | 3.29 | HERV-FRD provirus ancestral Env polyprotein |
| Down-regulated transcripts | ||||
| ST3GAL5 | 825.20 | 166.31 | 0.20 | ST3 beta-galactoside alpha-2;3-sialyltransferase 5 |
| OVOL2 | 1,094.92 | 229.17 | 0.21 | Ovo-like 2 (Drosophila) |
| RNF144B | 1,295.38 | 322.93 | 0.25 | Ring finger protein 144B |
| ENC1 | 1,766.98 | 441.29 | 0.25 | Ectodermal-neural cortex (with BTB-like domain) |
| LOC645431 | 539.58 | 142.95 | 0.26 | Hypothetical LOC645431 |
| SCARA3 | 478.81 | 127.07 | 0.27 | Scavenger receptor class A; member 3 |
| NANOS1 | 997.31 | 302.30 | 0.30 | Nanos homolog 1 (Drosophila) |
| IL17RD | 512.59 | 160.32 | 0.31 | Interleukin 17 receptor D |
| NR2E1 | 327.66 | 103.21 | 0.31 | Nuclear receptor subfamily 2; group E; member 1 |
| RNF125 | 399.46 | 127.27 | 0.32 | Ring finger protein 125 |
| TP63 | 530.14 | 169.93 | 0.32 | Tumor protein p63 |
| MYOZ1 | 322.70 | 103.64 | 0.32 | Myozenin 1 |
| VTCN1 | 399.07 | 128.22 | 0.32 | V-set domain containing T-cell activation inhibitor 1 |
| KANK4 | 1,662.05 | 539.58 | 0.32 | KN motif and ankyrin repeat domains 4 |
| GRLF1 | 458.36 | 149.14 | 0.33 | Glucocorticoid receptor DNA-binding factor 1 |
| TCF7L1 | 452.03 | 151.93 | 0.34 | Transcription factor 7-like 1 (T-cell specific; HMG-box) |
| DFNA5 | 1,995.57 | 688.43 | 0.34 | Deafness; autosomal dominant 5 |
| ANGPTL2 | 467.28 | 161.72 | 0.35 | Angiopoietin-like 2 |
| WNT11 | 315.07 | 110.59 | 0.35 | Wingless-type MMTV integration site family; member 11 |
| NEXN | 492.66 | 175.57 | 0.36 | Nexilin (F actin-binding protein) |
| FAM189A2 | 397.21 | 141.97 | 0.36 | Family with sequence similarity 189; member A2 |
| C14orf139 | 2,202.68 | 787.43 | 0.36 | Chromosome 14 ORF 139 |
| C1orf105 | 777.45 | 278.05 | 0.36 | Chromosome 1 ORF 105 |
| CBX5 | 649.78 | 233.09 | 0.36 | Chromobox homolog 5 (HP1 alpha homolog; Drosophila) |
| SORBS2 | 305.77 | 112.35 | 0.37 | Sorbin and SH3 domain containing 2 |
| HAND1 | 592.20 | 220.10 | 0.37 | Heart and neural crest derivatives expressed 1 |
| TRERF1 | 560.82 | 210.39 | 0.38 | Transcriptional regulating factor 1 |
| STAT1 | 1,706.06 | 643.62 | 0.38 | Signal transducer and activator of transcription 1; 91kDa |
| RHPN2 | 1,139.72 | 430.29 | 0.38 | Rhophilin; Rho GTPase-binding protein 2 |
| MOCS1 | 434.60 | 164.57 | 0.38 | Molybdenum cofactor synthesis 1 |
| LOC729680 | 3,849.00 | 1,457.97 | 0.38 | Hypothetical protein LOC729680 |
| TMEM139 | 588.01 | 224.15 | 0.38 | Transmembrane protein 139 |
| CRAT | 3,014.61 | 1,153.44 | 0.38 | Carnitine acetyltransferase |
| KRCC1 | 1,270.83 | 489.98 | 0.39 | Lysine-rich coiled-coil 1 |
| ANXA9 | 315.26 | 122.06 | 0.39 | Annexin A9 |
| PIK3R3 | 1,846.28 | 726.41 | 0.39 | Phosphoinositide-3-kinase; regulatory subunit 3 (gamma) |
| KRCC1 | 601.78 | 237.99 | 0.40 | Lysine-rich coiled-coil 1 |
| RBPMS | 2,294.36 | 910.26 | 0.40 | RNA-binding protein with multiple splicing |
| TAF12 | 997.12 | 395.76 | 0.40 | TAF12 RNA polymerase II |
| PMP22 | 1,678.82 | 675.47 | 0.40 | Peripheral myelin protein 22 |
| HP/HPR | 348.54 | 141.90 | 0.41 | Haptoglobin/haptoglobin-related protein |
| HUNK | 1,185.84 | 487.24 | 0.41 | Hormonally up-regulated Neu-associated kinase |
| FAM119A | 989.39 | 406.67 | 0.41 | Family with sequence similarity 119; member A |
| FBXO11 | 370.82 | 152.53 | 0.41 | F-box protein 11 |
OVOL1 is shown in boldface.
Fig. 2.
DNA microarray analysis was conducted on BeWo trophoblast cells cultured under undifferentiated (Undiff) or differentiating (Diff) conditions for 24 h. (A) Scatter plot showing the signal intensity of probe sets. Transcripts highlighted in pink are increased significantly (twofold or more); transcripts highlighted in green are decreased significantly (twofold or more). Selected transcripts are identified. (B and C) qRT-PCR validation of selected transcripts that decreased (B; n = 3; all P < 0.05) and increased (C; n = 3; all P < 0.05) following differentiation. Data are normalized to values obtained from trophoblast cells under undifferentiated conditions denoted with a dashed line.
Expression of OVOL1 in Trophoblast Cells and in Human Placenta.
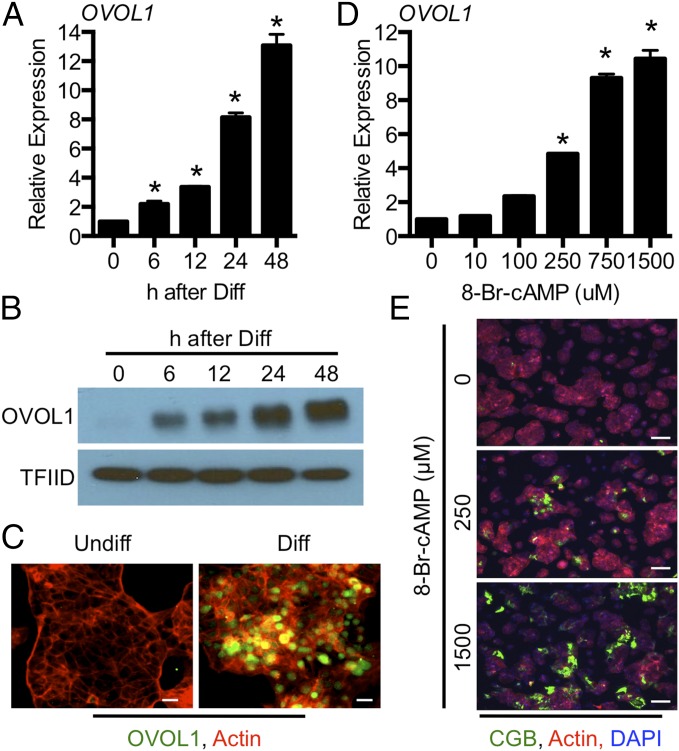
OVOL1 was induced robustly at both RNA and protein levels following stimulation of differentiation (Fig. 3 A and B). OVOL1 protein expression was detectable as early as 6 h following exposure to differentiation conditions and was maximal at 24 and 48 h postinduction. Both nuclear/cytoplasmic cell fractionation and immunofluorescence showed that OVOL1 accumulates in the nucleus following stimulation of differentiation (Fig. 3 B and C). OVOL1 is detected at strong levels in mononuclear cells, indicating that it is induced before cell fusion; expression also was detected to a lesser extent in fused cells. We also demonstrated that OVOL1 transcript was stimulated by 8-Br-cAMP in a dose-responsive manner (Fig. 3D). Higher doses of 8-Br-cAMP increased the extent of trophoblast differentiation (0 μg/mL 8-Br-cAMP: <1% of nuclei in syncytia; 250 μg/mL 8-Br-cAMP: 13.9% of nuclei in syncytia; 1,500 μg/mL 8-Br-cAMP: 29.4% of nuclei in syncytia, P < 0.05; representative images are shown in Fig. 3E).
Fig. 3.
OVOL1 is induced under differentiating conditions. BeWo trophoblast cells were exposed to differentiating (Diff) conditions for 6, 12, 24, or 48 h. Undifferentiated (Undiff) cells (0 h) were used as controls. (A and B) qRT-PCR (A) and Western blotting (B) showing expression of OVOL1 mRNA and nuclear protein accumulation, respectively. (C) OVOL1 immunolocalization in cells maintained in undifferentiated or differentiating conditions for 48 h. (D) qRT-PCR for OVOL1 expression following exposure to various concentrations of 8-Br-cAMP for 48 h. (E) Immunofluorescence images of CGB (green) showing differentiated BeWo trophoblast cells cultured under control conditions or in the presence of 250 or 1,500 μM 8-Br-cAMP for 48 h. Phalloidin was used as a counterstain in C and E to demarcate the actin cytoskeleton. *P < 0.05; n = 3. (Scale bars, 50 μm.)
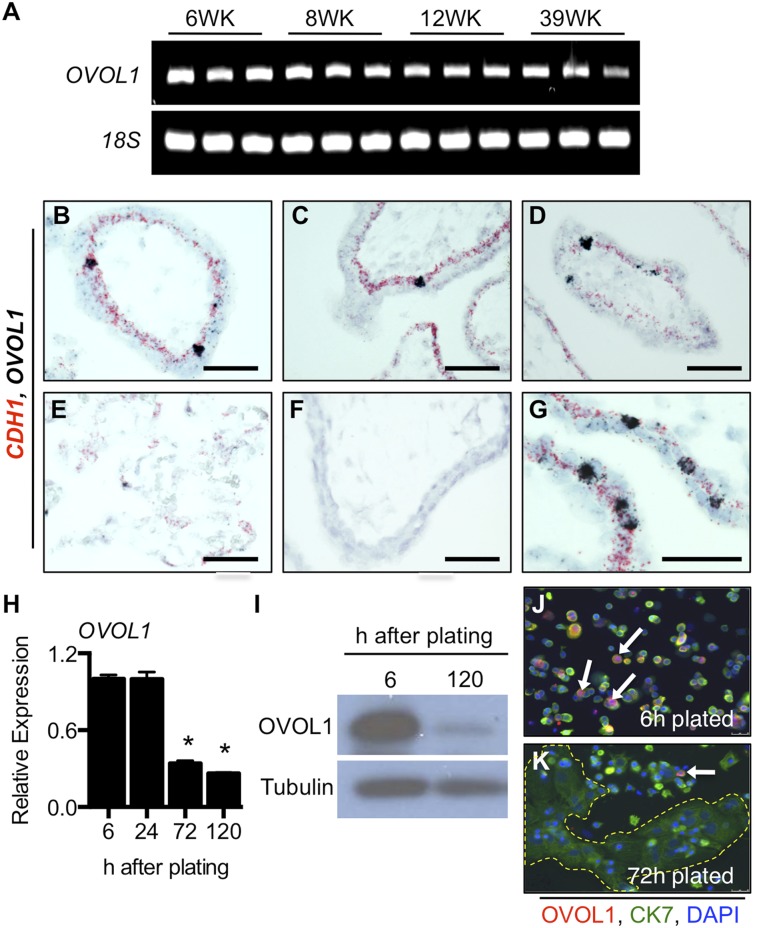
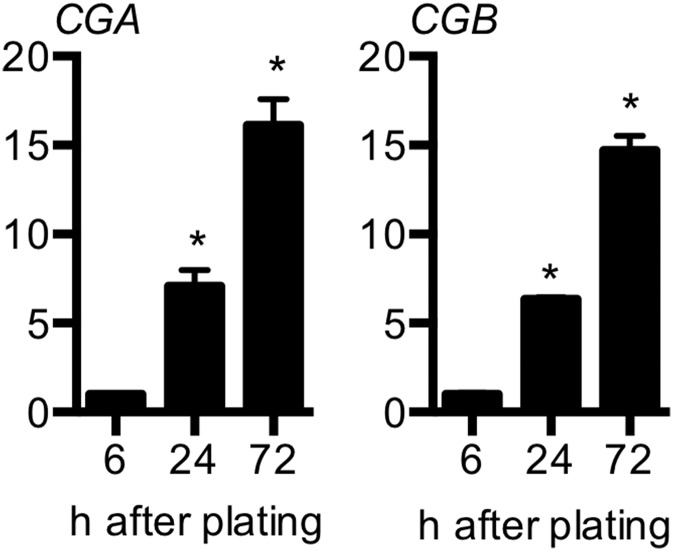
To determine whether OVOL1 is expressed in human placenta, we performed RT-PCR analysis at four gestational ages: 6, 8, 12, and 39 wk of gestation. OVOL1 was expressed in human placenta throughout pregnancy (Fig. 4A). In situ hybridization analysis revealed that OVOL1 was expressed by a subset of CDH1+ cytotrophoblast cells (Fig. 4 B–G). The frequency of OVOL1+ cells was higher in the early stages of pregnancy, when many cytotrophoblast cells are present, and waned by term, when the relative number of cytotrophoblast cells declines. We also isolated primary cytotrophoblast cells from term placenta. Under our culture conditions, primary cytotrophoblast cells rapidly lose their progenitor characteristics and thus do not proliferate ex vivo; instead they fuse spontaneously to form syncytiotrophoblast (Fig. 4H). We identified high expression of OVOL1 in freshly isolated cytotrophoblast cells (6 h plated), but expression declined once cells syncytialized (Fig. 4 H–K; CGA and CGB transcript expression profiles are presented in Fig. S2). These results are consistent with a predominantly cytotrophoblastic expression pattern of OVOL1.
Fig. 4.
OVOL1 is expressed in human placenta. (A) RT-PCR analysis of human placenta collected at 6, 8, 12, and 39 wk of gestation. 18S rRNA was used as a loading control. (B–G) Two-plex in situ hybridization of OVOL1 (black) and CDH1 (red) in 6-wk (B), 8-wk (C), 12-wk (D), and 39-wk (E) placentae. Note that OVOL1 is expressed specifically in select cells within the CDH1-positive cytotrophoblast layer. (F) Hybridization using a negative control probe (DapB). (G) Higher magnification of OVOL1 and CDH1 at 6-wk gestation. (H) Term cytotrophoblast cells were plated for 6, 24, 72, or 120 h. Relative transcript expression of OVOL1 was assessed at each time point. *P < 0.05; n = 3. (I) Protein expression of OVOL1 in primary trophoblast cell lysates following 6-h and 120-h plating, as determined by Western blotting. Tubulin was used as a loading control. (J and K) Immunofluorescent images of OVOL1 (red) and cytokeratin 7 (green) are shown at 6-h plating (J) and 72-h plating (K). Nuclei are counterstained with DAPI. The dashed line in K demarcates a large syncytial cluster; white arrows indicate cells expressing high levels of OVOL1. (Scale bars, 50 μm.)
Fig. S2.
Expression of CGA and CGB in primary cytotrophoblast cells isolated from term placenta. Primary trophoblast cells were isolated and plated for 6-, 24-, or 72-h duration. RNA was extracted at each time point, and relative expression of CGA and CGB transcript was examined by qRT-PCR compared with 18S rRNA. *P < 0.05; n = 3.
OVOL Factors in Rodent Placenta.
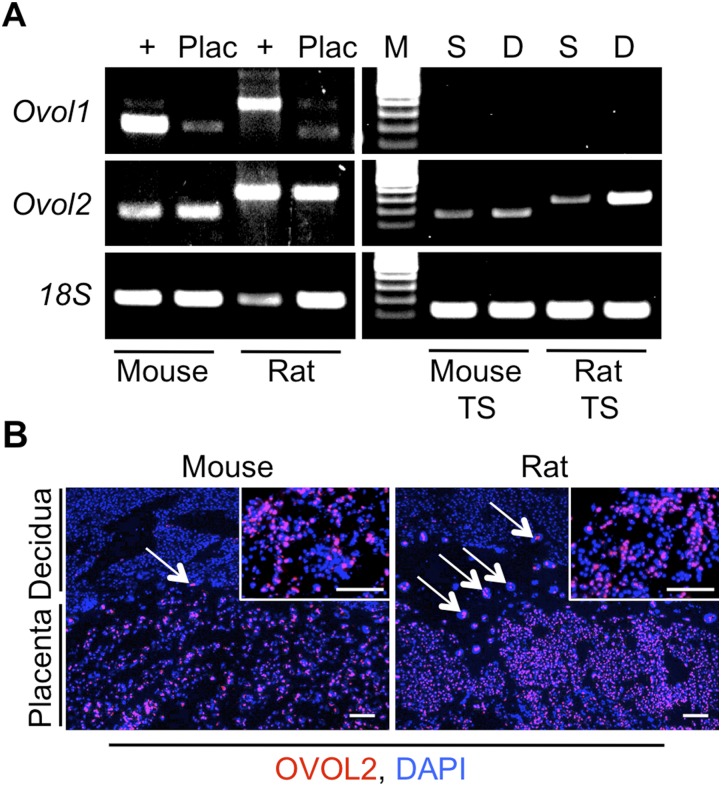
Because mice and rats exhibit hemochorial placentation and have a fetal–maternal exchange surface lined by syncytialized trophoblast, features shared with the human, we sought to determine whether Ovol1 is expressed in rodent placenta. RT-PCR analysis on mouse and rat placentae revealed that Ovol1 is expressed at low levels in both tissues. Mouse and rat skin were used as positive controls. Ovol1 mRNA was not detectable in mouse trophoblast stem (TS) cells or rat TS cells in either stem or differentiated states. However, a related transcription factor, Ovol2, was readily detectable in both mouse and rat placentae as well as in mouse and rat TS cells following induction of differentiation (Fig. S3A). OVOL2 expression was readily apparent in trophoblast cells located in both labyrinth and junctional zones of mouse and rat placenta, but blood cells, deciduas, and most embryonic tissues were negative (Fig. S3B; decidua is shown at the top of each panel and represents a negative control).
Fig. S3.
Expression of OVOL1 and OVOL2 in mouse and rat trophoblast cells. (A) RT-PCR analysis of mouse and rat placenta (Plac) and mouse and rat TS cells for Ovol1 and Ovol2. 18S rRNA was used as a loading control. Mouse and rat skin were used as positive controls (+). D, TS cells under differentiating conditions (8 d); M, DNA ladder; S, TS cells maintained in stem conditions. (B) Immunohistochemistry for OVOL2 (red) in mouse and rat placenta. Nuclei are counterstained blue using DAPI. Note the OVOL2+ trophoblast giant cells at the interface of the placenta and decidua (white arrows). Insets show a high-magnification view of the labyrinth zone. (Scale bar, 100 μm.)
OVOL1 Is Required for Trophoblast Syncytialization.
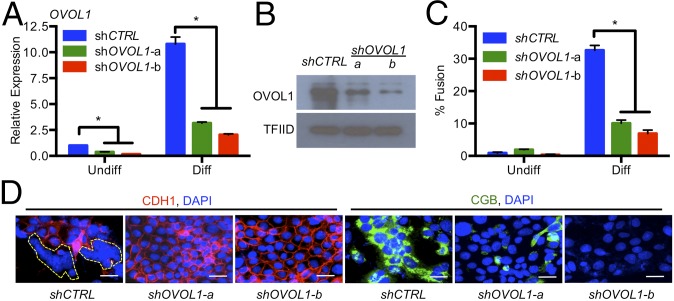
To determine the biological significance of OVOL1 in human trophoblast cells, we used a loss-of-function strategy to decrease OVOL1 expression. Lentiviral vectors were used to deliver shRNAs targeting OVOL1 in BeWo trophoblast cells. Two shRNAs targeting OVOL1 were used: shOVOL1-a and shOVOL1-b. Controls consisted of cells infected with virus carrying an shRNA with no known mammalian target. Incorporation of shRNAs had no discernable effect on cell proliferation or viability under undifferentiated conditions. Following stimulation of differentiation for 48 h, we observed a marked reduction of OVOL1 mRNA and protein expression in cells expressing either OVOL1-a or OVOL1-b shRNAs (Fig. 5 A and B, respectively). Cells expressing OVOL1-a or OVOL1-b shRNAs exhibited a 69% and 79% reduction, respectively, in cell fusion compared with cells expressing the control shRNA (Fig. 5C; representative images are shown in Fig. 5D). These results demonstrate that OVOL1 contributes to the regulation of trophoblast syncytialization.
Fig. 5.
OVOL1 regulates trophoblast cell fusion. BeWo trophoblast cells expressing control shRNA (shCTRL) or OVOL1 shRNAs (shOVOL1-a and shOVOL1-b) were cultured under standard (Undiff) or differentiating (Diff) conditions for 48 h. (A and B) Efficiency of OVOL1 knockdown was determined by qRT-PCR (A) and Western blotting (B). (C) The number of nuclei associated with fused cells. (D) Representative images of CDH1 and CGB expression in trophoblast cells expressing shCTRL, shOVOL1-a, or shOVOL1-b cultured under differentiating conditions. Nuclei are counterstained blue using DAPI. *P < 0.05; n ≥ 3. (Scale bars, 50 μm.)
Whole Transcriptome Analysis Reveals the Importance of OVOL1 for the Promotion of Trophoblast Differentiation.
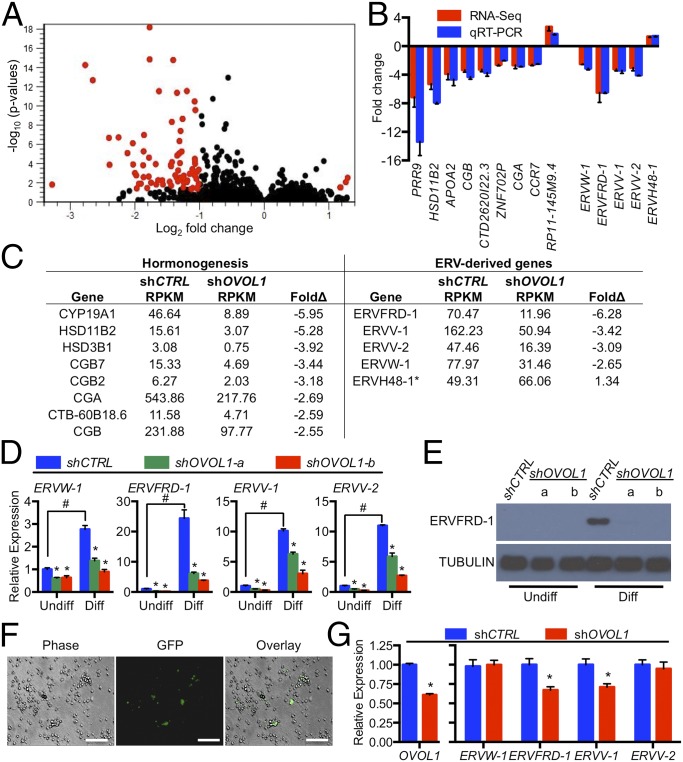
To ascertain globally the transcriptional targets dependent on OVOL1 expression, we performed high-throughput RNA sequencing (RNA-seq) comparing BeWo trophoblast cells expressing control shRNA versus cells deficient in OVOL1 (expressing shOVOL1-b), cultured under differentiating conditions. Overall, 4,452 transcripts met or exceeded the threshold reads per kilobase of exon per million reads mapped (RPKM) in at least one of the two groups (Fig. 6A). Of these, 79 transcripts were changed significantly (twofold or more; P < 0.05) between the two groups (Table S2). Fourteen transcripts, 13 that were differentially expressed between the two groups and one that was not significantly changed (ERVH48-1), were validated by quantitative RT-PCR (qRT-PCR) (Fig. 6B). Transcripts that were significantly decreased in OVOL1-deficient trophoblast cells included those encoding hormone subunits and hormone biosynthetic machinery robustly expressed in syncytiotrophoblast (CGA, CGB, CGB7, CGB5, CGB8, CTB-60B18.6, HSD3B1, HSD11B2, and CYP19A1), as is consistent with OVOL1 having an essential role in facilitating syncytiotrophoblast development (Fig. 6 B and C). Intriguingly, we also noted that OVOL1 deficiency caused a marked reduction in the expression of four endogenous retrovirus-derived genes, including transcripts that encode both syncytin fusogens [ERVW-1 (syncytin-1), 60% decrease; ERVFRD-1 (syncytin-2), 83% decrease; ERVV-1, 69% decrease; ERVV-2, 66% decrease; Fig. 6 B and C]. We also confirmed that the expression of all four of these endogenous retrovirus-derived genes was induced following stimulation of differentiation (ERVW-1: 2.8-fold; ERVFRD-1: 24.4-fold; ERVV-1: 10.1-fold; ERVV-2: 11.0-fold) and that trophoblast cells deficient in OVOL1 (i.e., expressing either shOVOL1-a or shOVOL1-b) exhibited markedly reduced expression of each gene (Fig. 6D). Expression of a fifth endogenous retrovirus-derived gene, ERVH48-1, which was highly expressed in trophoblast cells, was not altered during the course of trophoblast differentiation, nor was it affected by OVOL1 depletion, indicating that OVOL1 does not generically target genes with retroviral origins. We also performed Western blotting for ERVFRD-1 to determine whether protein levels correlated with the changes we observed in mRNA levels. ERVFRD-1 protein was robustly increased in control cells cultured in differentiating conditions but not in OVOL1-deficient cells (Fig. 6E). Finally, to determine the effect of OVOL1 deficiency on the expression of endogenous retroviral-derived genes in primary cytotrophoblast cells, we transduced these cells with lentivirus encoding control shRNA, shOVOL1-b, or GFP (to examine transduction efficiency; Fig. 6F) and 48 h later assessed transcript levels of these retroviral genes. Using this strategy, we achieved ∼40% knockdown of OVOL1. Intriguingly, despite the limited degree of OVOL1 knockdown, we still observed reduced expression of two endogenous retrovirus-derived genes in cells with OVOL1 knockdown: ERVFRD-1 (34% decrease) and ERVV-1 (30% decrease) (Fig. 6G). Collectively, these results demonstrate that OVOL1 regulates genes associated with syncytiotrophoblast formation and function.
Fig. 6.
Analysis of transcripts affected by OVOL1 knockdown in trophoblast cells. RNA-seq was performed on BeWo trophoblast cells expressing either control shRNA (shCTRL) or shOVOL1-b under differentiating (Diff) conditions. (A) Volcano plot showing 4,552 unique transcripts expressed in trophoblast cells. Transcripts altered twofold or more (P < 0.05) in cells expressing shOVOL1-b are shown in red. (B) Correlative analysis comparing mRNA fold changes of 14 transcripts in trophoblast cells expressing shOVOL1-b relative to cells expressing shCTRL, as determined by RNA-seq (red bars) and qRT-PCR (blue bars). (C) Fold differences in RPKM in selected transcripts associated with hormonogenesis (Left) and endogenous retrovirus (ERV)-derived genes (Right) between trophoblast cells expressing shOVOL1-b compared with cells expressing shCTRL. (D) qRT-PCR analysis of ERV-derived genes in trophoblast cells expressing shCTRL, shOVOL1-a, or shOVOL1-b under undifferentiated (Undiff) or differentiating conditions. #P < 0.05, comparing cells cultured in undifferentiated and differentiating conditions. (E) Protein expression of ERVFRD-1 in trophoblast cells expressing shCTRL, shOVOL1-a, or shOVOL1-b under undifferentiated or differentiating conditions. α-Tubulin was used as a loading control. (F) Primary cytotrophoblast cells were infected with a GFP-containing pLKO.3G vector. The number of GFP-expressing trophoblast cells was assessed 48 h later. (Scale bars, 100 μm.) (G) Transcript expression of OVOL1, ERVW-1, ERVFRD-1, ERVV-1, and ERVV-2 in primary cytotrophoblast cells transduced with shRNAs targeting OVOL1 (shOVOL1-b). *P < 0.05 comparing cells expressing shCTRL or shOVOL1. n = 3 except in G, in which n = 6.
Table S2.
Transcripts altered more than twofold following OVOL1 knockdown
| Gene | shCTRL RPKM | shOVOL1 RPKM | FoldΔ | Gene | shCTRL RPKM | shOVOL1 RPKM | FoldΔ |
| PHOSPHO1 | 2.15 | 0.12 | −9.72 | AC007566.10 | 22.81 | 9.54 | −2.54 |
| PRR9 | 29.96 | 4.61 | −6.81 | HSPB8 | 9.41 | 3.92 | −2.52 |
| ERVFRD-1 | 70.47 | 11.96 | −6.28 | SDC1 | 15.14 | 6.38 | −2.52 |
| HSD11B2 | 15.61 | 3.07 | −5.28 | SQSTM1 | 26.14 | 11.19 | −2.49 |
| RP11-463P17.1 | 8.61 | 1.65 | −5.25 | RP11-770G2.5 | 133.23 | 57.62 | −2.48 |
| SMIM13 | 16.55 | 3.63 | −4.77 | C5orf45 | 20.30 | 8.75 | −2.47 |
| GADD45G | 16.03 | 3.88 | −4.33 | RP11-1100L3.8 | 21.93 | 9.54 | −2.45 |
| TREML2 | 24.33 | 6.30 | −4.09 | CGB8 | 955.83 | 419.18 | −2.45 |
| HSPB1P2 | 11.12 | 2.83 | −4.08 | ALAS1 | 11.61 | 5.05 | −2.43 |
| RIN3 | 7.95 | 2.04 | −4.00 | FHDC1 | 11.44 | 4.98 | −2.43 |
| LGALS16 | 7.09 | 1.83 | −3.94 | OVOL1 | 32.45 | 14.31 | −2.42 |
| HSD3B1 | 3.08 | 0.75 | −3.92 | CGB1 | 234.75 | 105.09 | −2.40 |
| KLF4 | 4.55 | 1.18 | −3.84 | RP5-943J3.2 | 7.03 | 3.09 | −2.38 |
| DUSP5 | 5.12 | 1.37 | −3.75 | PITX1 | 9.59 | 4.26 | −2.38 |
| HSPB1P1 | 14.63 | 4.19 | −3.67 | PMAIP1 | 15.98 | 7.17 | −2.37 |
| HSPB1 | 7.32 | 2.06 | −3.65 | RP11-106M3.1 | 10.59 | 4.88 | −2.29 |
| AL590714.1 | 16.98 | 4.90 | −3.65 | CGB5 | 551.48 | 258.54 | −2.29 |
| APOA2 | 27.30 | 7.97 | −3.63 | ALPPL2 | 12.81 | 5.96 | −2.28 |
| INSL4 | 3.82 | 1.07 | −3.51 | GDF15 | 34.25 | 16.49 | −2.22 |
| SLC7A8 | 7.96 | 2.38 | −3.45 | AC068134.8 | 6.88 | 3.30 | −2.19 |
| CGB7 | 15.33 | 4.69 | −3.44 | KATNBL1P6 | 22.07 | 10.90 | −2.16 |
| ERVV-1 | 162.23 | 50.94 | −3.42 | RP11-169L17.5 | 8.43 | 4.13 | −2.15 |
| CTD-2620I22.3 | 61.52 | 19.25 | −3.42 | RP11-809N8.2 | 19.62 | 9.88 | −2.12 |
| KRT23 | 6.50 | 1.98 | −3.37 | NUS1P1 | 99.28 | 50.48 | −2.11 |
| LYPD3 | 14.46 | 4.76 | −3.20 | EAF1 | 32.42 | 16.46 | −2.10 |
| CGB2 | 6.27 | 2.03 | −3.18 | EAF1-AS1 | 30.16 | 15.35 | −2.10 |
| JUNB | 7.38 | 2.45 | −3.12 | RP11-457K10.2 | 33.08 | 16.87 | −2.10 |
| ERVV-2 | 47.46 | 16.39 | −3.09 | NUPR1 | 47.17 | 24.16 | −2.09 |
| SLC40A1 | 7.33 | 2.55 | −2.98 | FDX1P1 | 75.45 | 38.62 | −2.09 |
| FOXI3 | 6.22 | 2.17 | −2.96 | DNAJB9 | 16.25 | 8.36 | −2.07 |
| LEP | 9.75 | 3.71 | −2.76 | RHOB | 22.56 | 11.73 | −2.05 |
| ZNF702P | 16.85 | 6.56 | −2.72 | C2orf72 | 9.35 | 4.83 | −2.05 |
| TBX3 | 15.39 | 6.00 | −2.71 | FBRS | 7.72 | 3.98 | −2.05 |
| TNFRSF1B | 6.39 | 2.45 | −2.71 | KRT8P33 | 12.59 | 6.63 | −2.02 |
| CCR7 | 39.72 | 15.74 | −2.69 | CTSL | 25.58 | 13.54 | −2.02 |
| CGA | 543.86 | 217.76 | −2.69 | AC007620.3 | 3.48 | 8.60 | 2.26 |
| ERVW-1 | 77.97 | 31.46 | −2.65 | RP11-734J24.1 | 3.49 | 8.65 | 2.27 |
| CTB-60B18.6 | 11.58 | 4.71 | −2.59 | RP11-145M9.4 | 3.87 | 10.14 | 2.40 |
| ARL4C | 11.79 | 4.87 | −2.56 | RP11-349N19.2 | 17.63 | 46.61 | 2.44 |
| CGB | 231.88 | 97.77 | −2.55 |
OVOL1 Regulates Development of the Syncytiotrophoblast Phenotype in Bone Morphogenetic Protein-Treated Human Pluripotent Stem Cells.
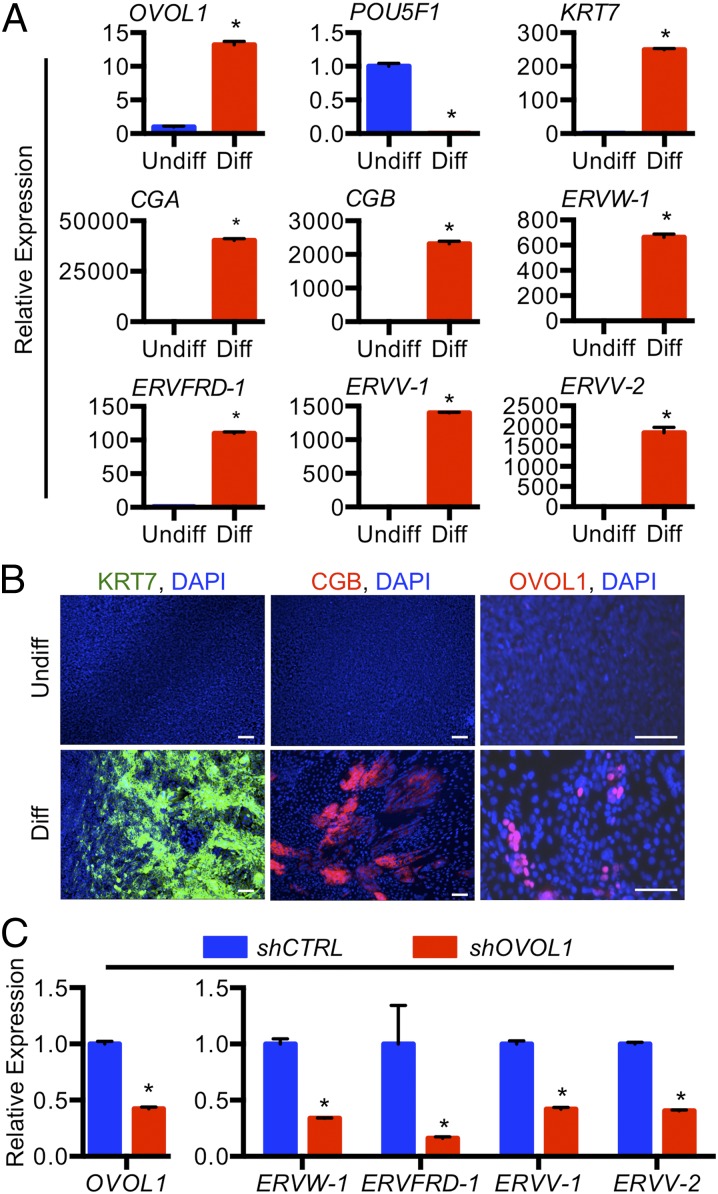
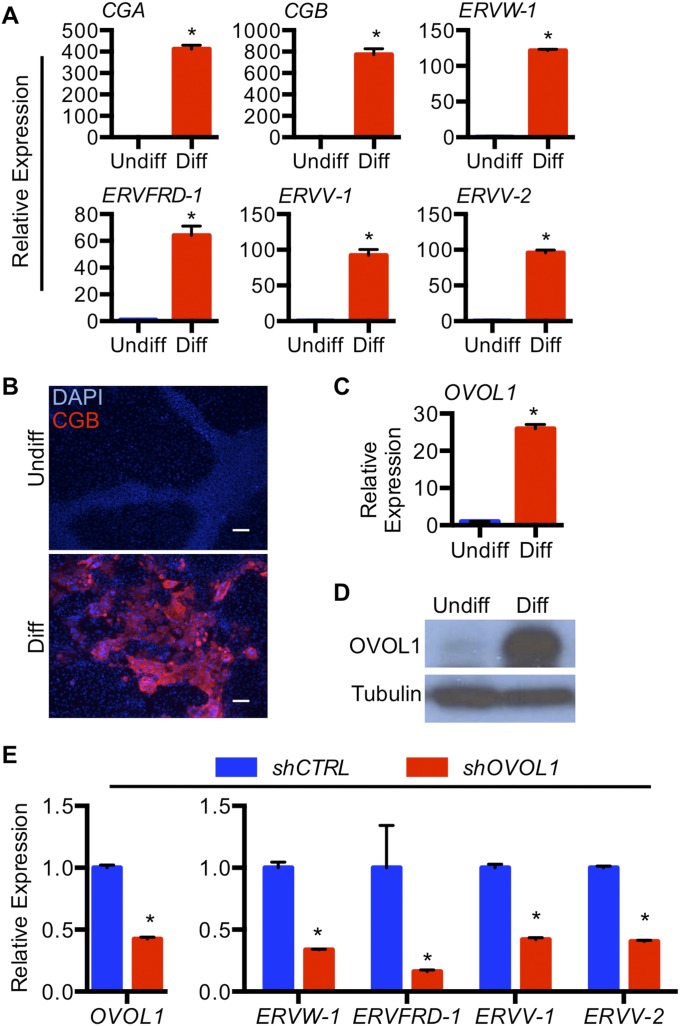
To gain insight into the role of OVOL1 in the regulation of syncytiotrophoblast development in a complementary model of human trophoblast differentiation, we treated human ES cells with bone morphogenetic protein 4 (BMP4). Treatment of human ES cells with BMP4 promotes the acquisition of a trophoblast cell fate, including expression of genes associated with syncytiotrophoblast differentiation (23–26). After stimulating ES cells with BMP4, we noted a substantial induction of transcripts expressed by differentiated trophoblast cells, including CGA (40,360-fold), CGB (2,316-fold), and the aforementioned endogenous retrovirus-derived genes ERVW-1 (650-fold), ERVFRD-1 (110-fold), ERVV-1 (1,400-fold), and ERVV-2 (1,828-fold) (all P < 0.05) (Fig. 7A). CGB immunofluorescence is shown in Fig. 7B. Compellingly, OVOL1 was increased substantially at both RNA (25-fold; P < 0.05) and protein levels following differentiation. Similar results were obtained using human induced pluripotent stem (iPS) cells (Fig. S4). Knockdown of OVOL1 in human ES cells before differentiation abrogated the expression of CGA (89% decrease), CGB (79% decrease), and all four endogenous retrovirus-derived genes (ERVW-1: 73% decrease; ERVFRD-1: 57% decrease; ERVV-1: 78% decrease; ERVV-2: 82% decrease; all P < 0.05) (Fig. 7C). Again, similar results were obtained using OVOL1-deficient human iPS cells (ERVW-1: 66% decrease; ERVFRD-1: 84% decrease; ERVV-1: 58% decrease; ERVV-2: 60% decrease, all P < 0.05) (Fig. S4).
Fig. 7.
OVOL1 regulates syncytiotrophoblast gene expression in human ES cells induced to differentiate along the trophoblast lineage. Human ES cells were maintained in undifferentiated (Undiff) conditions or were exposed to 10 ng/mL BMP4 (Diff) for 7 d. (A) Transcript expression of OVOL1, POU5F1, KRT7, CGA, CGB, ERVW-1, ERVFRD-1, ERVV-1, and ERVV-2 in human ES cells maintained in undifferentiated or differentiating conditions. (B) Immunofluorescence for KRT7, CGB, and OVOL1 in human ES cells maintained in undifferentiated or differentiating conditions. DAPI was used to identify nuclei. (Scale bars, 100 μm.) (C) Transcript expression of OVOL1, CGA, CGB, ERVW-1, ERVFRD-1, ERVV-1, and ERVV-2 in OVOL1 shRNA-expressing human ES cells maintained in differentiated conditions. Human ES cells expressing control shRNA (shCTRL) were used as controls. *P < 0.05; all n = 3.
Fig. S4.
OVOL1 regulates syncytiotrophoblast gene expression in human iPS cells induced to differentiate along the trophoblast lineage. Human iPS cells were maintained in FGF2 (undifferentiated, Undiff) or BMP4 (differentiating, Diff) for 7 d. (A) Transcript expression of CGA, CGB, ERVW-1, ERVFRD-1, ERVV-1, and ERVV-2 in human iPS cells maintained in undifferentiated or differentiating conditions. (B) CGB immunofluorescence in human iPS cells maintained in undifferentiated or differentiating conditions. (Scale bars, 100 μm.) (C and D) Transcript (C) and protein expression (D) of OVOL1 in human iPS cells maintained in undifferentiated or differentiating conditions. (E) Effect of OVOL1 deficiency (shOVOL1) in human iPS cells maintained in differentiating conditions on endogenous retrovirus-derived gene expression (ERVW-1, ERVFRD-1, ERVV-1, and ERVV-2) compared with cells expressing control shRNA (shCTRL). *P < 0.05; n = 3.
OVOL1 Suppresses Factors Involved in Maintaining the Cytotrophoblast Progenitor State.
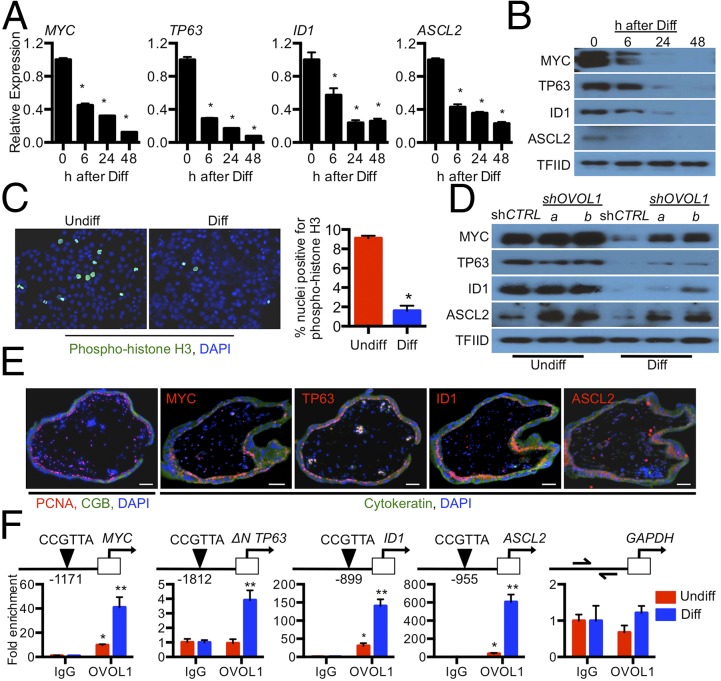
We reasoned that the effects of OVOL1 deficiency on the expression of genes associated with syncytiotrophoblast differentiation could be explained best by (i) OVOL1 directly repressing genes that maintain the cytotrophoblast progenitor state or (ii) OVOL1 facilitating the activation of genes that promote syncytiotrophoblast formation. The first option is consistent with the recognized role of OVOL1 as a transcriptional repressor (27). Therefore, to screen for potential intermediary targets of OVOL1 involved in maintaining the progenitor status of cytotrophoblast cells, we perused our DNA microarray for known transcriptional regulators whose expression was down-regulated early during differentiation. Through this analysis we found that MYC, ID1, and TP63 were all significantly down-regulated following 24-h stimulation of differentiation (MYC: 38% decrease; ID1: 57% decrease; TP63: 68% decrease; all P < 0.05). We also examined the expression of ASCL2, which encodes a basic helix–loop–helix transcription factor essential for diploid trophoblast development in mice (28), because its expression trended upward following OVOL1 knockdown (1.9-fold increase following OVOL1 knockdown). We confirmed by both qRT-PCR and Western blotting that the expression of each of these factors declined progressively during BeWo trophoblast differentiation in a time-dependent manner (Fig. 8 A and B). Immunofluorescence staining for phospho-histone H3 revealed a loss of proliferative potential in cells during differentiation (75% fewer cells expressed phospho-histone H3 following stimulation of differentiation; P < 0.05) (Fig. 8C). To determine whether MYC, TP63, ID1, and ASCL2 are expressed by proliferating cytotrophoblast cells in vivo, we assessed the expression of these proteins in human placenta using immunohistochemistry. Proliferating cell nuclear antigen (PCNA) was used to detect cytotrophoblast cells maintained in a progenitor state; CGB was used as a marker for syncytiotrophoblast. MYC, TP63, ID1, and ASCL2 were detected exclusively in cytotrophoblast cells in situ. MYC and TP63 were detected in cytotrophoblast nuclei; ID1 and ASCL2 exhibited both cytoplasmic and nuclear staining (Fig. 8E). These factors were not expressed in syncytiotrophoblast. Therefore, decreased expression of MYC, TP63, ID1, and ASCL2 correlates with loss of trophoblast cell capacity for self-renewal and promotion of differentiation.
Fig. 8.
OVOL1 represses genes that promote the trophoblast progenitor state. (A and B) qRT-PCR (A) and Western blot (B) analysis of MYC, TP63, ID1, and ASCL2 transcript and protein levels, respectively, in BeWo trophoblast cells cultured under standard conditions (Undiff, 0 h) or following 6-, 24-, or 48-h exposure to differentiating (Diff) conditions. TFIID was used as a loading control. (C) Phospho-histone H3 immunofluorescence in BeWo trophoblast cells cultured in undifferentiated or differentiating conditions. DAPI was used to identify nuclei. The percentage of phospho-histone H3-positive nuclei is shown on the right. (D) Protein expression of MYC, TP63, ID1, and ASCL2 in BeWo trophoblast cells expressing shCTRL, shOVOL1-a, or shOVOL1-b maintained in undifferentiated or differentiating conditions. (E) Immunofluorescence of MYC, ID1, TP63, and ASCL2 in 8-wk human placenta. Antibodies that detect PCNA and CGB were used to identify proliferating cytotrophoblast cells and syncytiotrophoblast, respectively. (Scale bars, 50 μm.) (F) ChIP analysis using antibodies for OVOL1 or IgG (negative control) in lysates of BeWo trophoblast cells maintained in undifferentiated or differentiating conditions. *P < 0.05, **P < 0.05, n ≥ 3.
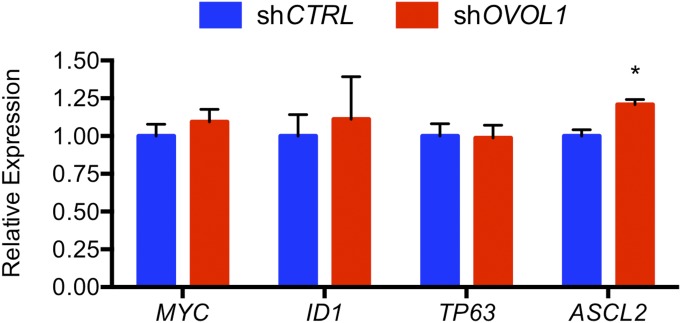
We next examined whether expression of MYC, TP63, ID1, or ASCL2 was altered following OVOL1 knockdown. To do so, we assessed these proteins in nuclear lysates of control or OVOL1-deficient BeWo trophoblast cells under undifferentiated or differentiating conditions. In control shRNA-expressing trophoblast cells, stimulation of differentiation caused a marked reduction in the expression of all four factors, similar to the time-dependent reduction in the levels of these proteins following trophoblast differentiation described above. In contrast, in cells deficient in OVOL1, high levels of MYC, TP63, ID1, and ASCL2 were retained even as cells were cultured under differentiating conditions (Fig. 8D). Similarly, in primary cytotrophoblast cells, we observed a 20% increase in ASCL2 expression following knockdown of OVOL1 (P < 0.05) (Fig. S5).
Fig. S5.
Effect of OVOL1 knockdown in primary cytotrophoblast cells on genes linked with the cytotrophoblast progenitor state. Transcript expression of MYC, ID1, TP63, and ASCL2 in primary cytotrophoblasts transduced with shRNAs targeting OVOL1 (shOVOL1). *P < 0.05; n = 6.
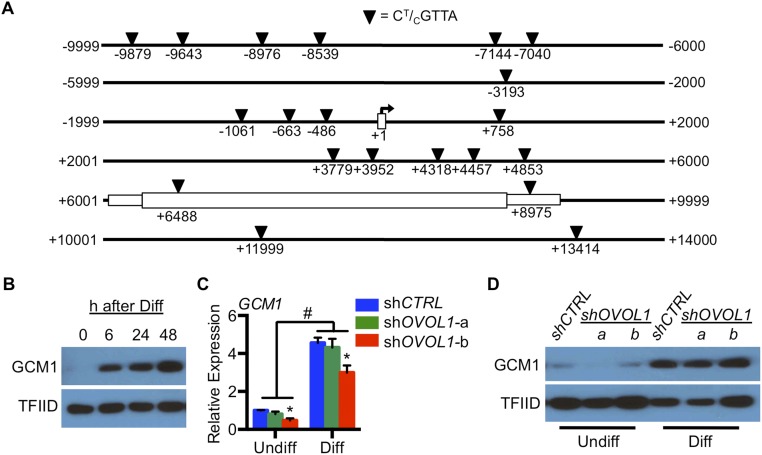
We next sought to determine whether OVOL1 bound directly within the upstream genomic region of MYC, ID1, TP63, and ASCL2. Putative OVOL1-binding sites were identified within the proximal promoter regions of MYC (CCGTTA, 1,171 bp upstream of the transcription start site), ID1 (CCGTTA, 899 bp upstream), TP63 (CCGTTA, 1,812 bp upstream of the alternative initiation site ΔNP63), and ASCL2 (CCGTTA, 955 bp upstream). We also identified several putative OVOL1-binding sites proximate to and within (10 kb upstream to 5 kb downstream) ERVFRD-1 (Fig. S6A). We chose to examine OVOL1 binding near ERVFRD-1 because ERVFRD-1 is a potent inducer of trophoblast fusion (29) and because the encoded transcript for this gene was one of the most robustly affected following disruption of OVOL1 in our RNA-seq analysis and in primary cytotrophoblast cells. Thus, ERVFRD-1 served as a prototype to determine whether OVOL1 is capable of directly activating genes that promote syncytiotrophoblast formation. Using ChIP, we observed enrichment of OVOL1 in the upstream genomic regions of MYC (40-fold), TP63 (threefold), ID1 (135-fold), and ASCL2 (600-fold) (all P < 0.05 compared with nonspecific IgG binding) (Fig. 8F). No enrichment was identified in the proximal promoter region of GAPDH lacking putative OVOL1-binding sites (negative control) or at any of the potential OVOL1-binding sites surrounding ERVFRD-1. We also did not observe any changes in nuclear GCM1 levels between control and OVOL1-deficient trophoblast cells, despite a robust induction of GCM1 when trophoblast cells were exposed to differentiating conditions (Fig. S6). Therefore, we were unable to demonstrate that the actions of OVOL1 on trophoblast differentiation are dependent on directly targeting genes that promote syncytiotrophoblast formation (such as GCM1 or ERVFRD-1). Rather, our findings show that the likely function of OVOL1 in human placenta is to restrict the expression of key factors such as MYC, ID1, TP63, and ASCL2 that maintain cytotrophoblast cells in a progenitor state.
Fig. S6.
OVOL1 was not detected binding genomic regions near ERVFRD-1 and did not affect GCM1 expression. (A) ChIP was conducted in lysates of BeWo trophoblast cells maintained in differentiating conditions using antibodies for OVOL1 or IgG (negative control). Primers were designed to span regions containing putative OVOL1-binding sites (indicated by inverted triangles) near ERVFRD-1. (B) Nuclear protein expression of GCM1 in trophoblast cells cultured under differentiating conditions for 6, 24, or 48 h. Cells maintained in undifferentiated conditions (Undiff; 0 h) were used as controls. (C and D) BeWo trophoblast cells expressing control shRNA (shCTRL) or shRNAs targeting OVOL1 (shOVOL1-a or shOVOL1-b) were maintained under undifferentiated or differentiating (Diff) conditions for 48 h. Subsequently, qRT-PCR (C) and Western blotting (D) were conducted to detect transcript and nuclear protein of GCM1, respectively. TFIID was used as a loading control for Western blotting. *P < 0.05, OVOL1-deficient trophoblast cells vs. shCTRL-expressing trophoblast cells; n = 3; #P < 0.05, trophoblast cells maintained in undifferentiated vs. differentiating conditions; n = 3.
Discussion
We have found that OVOL1 is a critical determinant of cytotrophoblast differentiation in human placenta. OVOL1 promotes syncytiotrophoblast formation by restricting progenitor cell traits associated with cytotrophoblast cells and facilitating the activation of genes involved in both cell fusion and hormonogenesis. This study sheds light on the transcriptional regulation of human trophoblast differentiation, emphasizing the previously unrecognized importance of transcriptional repression in guiding cytotrophoblast cell fate.
For our experiments, we used three well-established models of human trophoblast syncytialization: cAMP-stimulated BeWo trophoblast cells, BMP4-treated human pluripotent stem cells, and primary term cytotrophoblast cells. Each of these models has its own merits and limitations, but combined they provide a compelling strategy for assessing molecular mechanisms that regulate human trophoblast differentiation, especially when used in addition to in situ assessment of the human placenta. In particular, the use of BeWo trophoblast cells and BMP4-treated human pluripotent stem cells is advantageous, because they can be induced to cease proliferation and commence differentiation by exogenous agents, thereby enabling the identification of factors controlling the development of more committed trophoblast lineages. BeWo trophoblast cells have been used as an in vitro model of cell fusion and hormonogenesis for decades (30). These cells are maintained as progenitor-like cells but can be induced to differentiate following exposure to cAMP analogs. How elevated intracellular cAMP facilitates fusion in these trophoblast cells is still not well understood. Stimulation of human pluripotent stem cells with BMP4 in the presence of fibroblast conditioned medium, causing the induction of genes consistent with trophoblast cells, was first reported by Xu et al. (23). The advantage of this system is that trophoblast differentiation can be studied through its entirety, i.e., from pluripotent stem cells to multipotent trophoblast precursors to terminally differentiated trophoblast-derived lineages (25). We have demonstrated a vital role for OVOL1 in trophoblast differentiation in each model.
Cytotrophoblast cells enzymatically isolated from placenta fail to proliferate ex vivo and differentiate spontaneously in culture. The use of primary cytotrophoblast cells has provided invaluable information about factors promoting syncytiotrophoblast derivation and function, although using isolated cytotrophoblast cells to delineate factors involved in the maintenance of the cytotrophoblast progenitor state is difficult because these cells initiate terminal differentiation following isolation. These cells thus are inherently different from their in vivo counterparts, in that culture conditions that facilitate the progression of these cells through the cell cycle have not been established. Therefore we identified robust OVOL1 expression in cytotrophoblast cells immediately after isolation, consistent with these cells having initiated differentiation. We were successful in achieving a degree of OVOL1 knockdown in these cells using a lentiviral strategy; however, because of the transient nature of the experiment, selection of transduced cells was not possible, and the degree of knockdown was modest. Despite these limitations, we were able to demonstrate significant differences in the transcript levels of genes required for fusion (such as ERVFRD-1) and self-renewal (such as ASCL2) in primary trophoblast cells following OVOL1 knockdown; these results are similar to our observations in other trophoblast differentiation models.
Our finding that OVOL1 acts as a “switch” enabling commencement of differentiation is consistent with its role in several other epithelial lineages of other organisms. For example, in flies, ovo (a transcription factor homologous to OVOL1) is required for both oogenesis and cuticular development. Mutations in this gene result in egg chambers filled with undifferentiated germ cells and impairment of differentiated epidermal appendages (16, 31, 32). In mice, OVOL1 deficiency causes reduced meiotic progression of spermatogonia as well as basal epidermal hyperproliferation caused by ineffective transition to the initial stages of terminal differentiation (17–19). Thus, OVOL1 may be fundamental for the regulation of differentiation of several distinct mammalian epithelial lineages.
Despite the seemingly conserved function of OVOL1 as a core regulator of epithelial differentiation, cytotrophoblast fusion to generate syncytiotrophoblast is rather exceptional. Unlike any other epithelial differentiation program in human tissues, formation of syncytiotrophoblast is both an endocrinological event and a cell-fusion event. The onset of hormonogenesis and of fusion are coupled during differentiation but are regulated by distinct signaling pathways (30). The endocrinological machinery of syncytiotrophoblast includes the proteins encoded by the CG subunits CGA and CGB, which maintain ovarian corpus luteum function; HSD3B1, which is necessary for progesterone synthesis; CYP19A1, which catalyzes the conversion of androgens to estrogens; and HSD11B2, which protects the embryo from the potentially detrimental effects of cortisol (33). Collectively, these genes encode proteins that prevent pregnancy failure and promote fetal development and thus are vital for human reproduction. Our finding that all these genes are downstream of OVOL1 actions emphasizes the importance of OVOL1 in the regulation of placental hormonogenesis and, thus, in human pregnancy.
With respect to the cell-fusion component of syncytiotrophoblast derivation, the expression of both ERVW-1 (syncytin-1) and ERVFRD-1 (syncytin-2)—the remnants of ancient retroviral env genes that are uniquely expressed by trophoblast cells and which encode the only two known fusogenic genes in human tissues—was strongly increased during in vitro syncytiotrophoblast derivation, as is consistent with other reports (29). We also found that two other endogenous retrovirus-derived genes, ERVV-1 and ERVV-2, also were induced robustly during trophoblast differentiation. The proteins encoded by these genes do not possess fusogenic properties in human trophoblast cells, but their orthologs are capable of promoting fusion in the placentae of more distantly related primates (34). We discovered that the expression of all four of these retrovirus-derived genes in trophoblast cells is downstream of OVOL1 actions. Reduced expression of the syncytin genes is a likely reason for the decreased cell fusion apparent in OVOL1-deficient trophoblast cells.
There are two probable explanations for how OVOL1 promotes the expression of endocrinologically relevant genes, endogenous retrovirus-derived genes, and syncytiotrophoblast development in general. The first is that OVOL1 represses genes that maintain the progenitor status of cytotrophoblast cells, thereby indirectly facilitating the activation of differentiation-associated transcripts. Alternatively, it is possible that OVOL1 stimulates the expression of a differentiation-associated factor (or factors) directly. The former option is consistent with the published role of OVOL1 in other epithelial systems.
OVOL1 represses key genes involved in the maintenance of epithelial stem-like properties to promote differentiation (18, 19, 35). It does so either by competing for DNA binding with other transcription factors or by actively recruiting corepressor complexes (27). We identified four potential targets of OVOL1-mediated repression in trophoblast cells: MYC, TP63, ID1, and ASCL2. The products encoded by each of these genes decreased progressively during in vitro syncytiotrophoblast development, inversely correlating with OVOL1 levels. Each factor also was strongly expressed in proliferating cytotrophoblast cells in situ and was absent in syncytiotrophoblast, as is consistent with other reports (36–38). Importantly, each of these factors has been linked to maintaining a proproliferation and/or antidifferentiation state in various epithelial lineages (39–41). In cytotrophoblast cells, ectopic expression of either TP63 or ASCL2 impairs trophoblast differentiation and prevents fusion (26, 42–44); similarly, MYC maintains trophoblast cells in an undifferentiated state by inducing microRNAs that specifically target and repress differentiation-inducing factors (45). Although less is known about how ID1 is involved in human placental development, all four ID proteins (ID1, ID2, ID3, and ID4) have been immunolocalized to cytotrophoblast cells (37), as is fitting, given their primary role in preventing differentiation of progenitor cells (39). The potential importance of ID1 for cytotrophoblast proliferation is underscored by the excessive production of this transcriptional modulator in gestational trophoblastic disease (37). We found that OVOL1 bound directly upstream of each of MYC, TP63, ID1, and ASCL2 and that cells deficient in OVOL1 were incapable of suppressing each factor following induction of differentiation. Our finding in trophoblast cells that MYC is a target for OVOL1-mediated repression is consistent with another report in mouse epidermis, in which OVOL1 directly and autonomously repressed Myc expression during epidermal differentiation by binding to a conserved site upstream of the Myc transcription start site (19). Thus, OVOL1-mediated repression of MYC may be a conserved regulatory feature of epithelial differentiation. We also have shown that OVOL1 binds upstream of ID1, ASCL2, and TP63 and in each case is associated with gene repression. OVOL-binding sites upstream of the ΔN alternative promoter of mouse Trp63 were reported previously in embryonic epidermal progenitor cells (46). Although our study focused on MYC, TP63, ID1, and ASCL2 because of their known roles in maintaining the progenitor status of epithelial cells and more specifically in cytotrophoblast cells, we fully expect that there are other genes expressed by cytotrophoblast cells that are subject to OVOL1-mediated repression and contribute to the maintenance of the progenitor state.
We also addressed the possibility that, in addition to repressing genes that maintain cytotrophoblast progenitor traits, OVOL1 directly activates genes that promote syncytiotrophoblast development. However, we did not detect OVOL1 binding within the immediate vicinity of ERVFRD-1, despite the dramatic effect on transcript levels following OVOL1 knockdown. Thus, we have no evidence for direct activation of this gene by OVOL1. We also determined that GCM1, a key activator of syncytiotrophoblast development and syncytin gene transcription (47, 48), was not substantially modified in cells deficient in OVOL1 despite profound effects on expression of syncytin genes and cell fusion. This finding emphasizes that GCM1 levels are not the only factor to be considered when determining the expression of syncytin genes and cell fusion in the human placenta. GCM1 is expressed heterogeneously in the human placenta in vivo, including throughout trophoblast cell columns where no fusion occurs (49). Although OVOL1 did not affect GCM1 expression significantly, it certainly is feasible that genes directly targeted by OVOL1 ultimately affect GCM1 activity or DNA-binding affinity, thereby facilitating the expression of syncytin genes and consequent cell fusion. It also is possible that OVOL1 is induced directly by GCM1 and that GCM1-induced OVOL1 is at least partially responsible for mediating the prodifferentiation actions of GCM1. Regardless, in human placenta, we propose that OVOL1 executes the essential function of repressing major regulators that maintain cytotrophoblast progenitor traits, thereby facilitating syncytiotrophoblast development.
Syncytiotrophoblast is not a cell type unique to human placenta. The primary epithelial barrier separating maternal and fetal blood in many other mammals, including mice and rats, is comprised of syncytialized trophoblast. Ovol1 was detected at low levels in mouse and rat placentae and was not detected in mouse or rat TS cells in stem or differentiated conditions. However, an Ovol1 paralog, Ovol2, is highly expressed in mouse and rat placentae (this study and ref. 50), and we found that Ovol2 is induced in mouse and rat TS cells following differentiation in vitro. Intriguingly, OVOL1-deficient mice are viable until birth, and no evident defects in placentation have been reported (20), but OVOL2-deficient mice die by midgestation with severe deficits in the development of the labyrinth placenta, the murine equivalent of the chorionic villi (50). OVOL2 binds to the same DNA-binding site as OVOL1 and can exert functions redundant to those of OVOL1 (46, 51, 52). Thus, it could be proposed that OVOL2 regulates placentation in mice and rats in a manner similar to the actions of OVOL1 in humans.
In conclusion, we have found that OVOL1 is a major regulator of cytotrophoblast differentiation in the human placenta. We also have uncovered a previously unidentified mechanism of action whereby OVOL1 acts to repress four key transcriptional regulators known to maintain cytotrophoblast cells in a progenitor state. The importance of the “brake” provided by OVOL1 on these upstream factors is manifest, given the broad and powerful effects of manipulating OVOL1 levels on diverse sets of genes required for both hormonogenesis and fusion (e.g., syncytins). Our research paves the way for future studies, including the identification of additional OVOL1 target genes and their roles in maintaining the cytotrophoblast progenitor state, determination of whether OVOL1 is also important for extravillous trophoblast development, and assessment of whether OVOL1 expression or activity is dysregulated in diseases associated with a suboptimal syncytiotrophoblast barrier (e.g., preeclampsia or intrauterine growth restriction) or in pathologies associated with cytotrophoblast hyperproliferation (e.g., gestational trophoblastic disease).
Methods
Human Placenta Collection and Trophoblast Cell Isolation.
Paraffin-embedded and frozen human placental tissue was obtained from the Research Centre for Women’s and Children’s Health Biobank (Mount Sinai Hospital, Toronto). All collections were performed with appropriate consent and were approved by the University of Toronto and the University of Kansas Medical Center (KUMC) human research ethics boards. Term trophoblast cells were processed from placental villous tissue obtained with consent from the University of Kansas Hospital under a protocol approved by the KUMC Institutional Review Board. Trophoblast cells were processed according to the method of Kliman et al. (53).
Animals and Tissue Collection.
C57BL/6 mice were obtained from The Jackson Laboratory. Holtzman Sprague–Dawley rats were obtained from Harlan Laboratories. Males and females of the appropriate species were caged together overnight, and the presence of a seminal plug or sperm in the vaginal smear was designated day 0.5 of pregnancy. Placental and epidermal tissues were collected on gestation days 13.5 for rats and 15.5 for mice. Tissues were frozen in dry ice-cooled heptane for immunohistochemical analysis or were snap-frozen in liquid nitrogen and were stored at −80 °C until processing. The KUMC Animal Care and Use Committee approved the protocols for the care and use of animals.
Cells.
All cells were maintained at 37 °C, 5% CO2. BeWo trophoblast cells and HEK-293FT cells were obtained from the American Type Culture Collection. To stimulate BeWo trophoblast differentiation, cells were treated with 8-Br-cAMP (Sigma-Aldrich), which is commonly used to stimulate syncytialization in these cells (22).
Human ES cells were obtained from WiCell (clone WA09, feeder-independent). Cells were maintained on growth factor-reduced Matrigel (Corning-Fisher Scientific) in mTESR1 medium (STEMCELL Technologies). To induce trophoblast differentiation, mTESR1 medium was removed, and cells were exposed to 10 ng/mL BMP4 (R&D Systems) diluted in mouse embryonic fibroblast-conditioned medium containing 80% knockout DMEM/20% knockout serum replacement (Life Technologies) with 1 mM l-glutamine, nonessential amino acid supplement, and 0.1 mM 2-mercaptoethanol (all from Sigma-Aldrich). Cells were exposed to BMP4 for 7 d, similar to published reports (23–25, 54).
Human iPS cells were obtained from the Harvard Stem Cell Institute iPS cell core facility (Line 11b derived from skin fibroblasts of a healthy female) (55). Cells were maintained on growth factor-reduced Matrigel in 80% DMEM/F12 supplemented with 20% knockout serum replacement, 1 mM l-glutamine, nonessential amino acid supplement, 0.1 mM 2-mercaptoethanol, and 4 ng/mL FGF2 at subconfluent conditions. To induce trophoblast differentiation, the medium was supplemented with 10 ng/mL BMP4 in place of FGF2.
Mouse TS cells were a kind gift from Janet Rossant of The Hospital for Sick Children, Toronto, and were cultured as previously described (56). Rat TS cells were generated and characterized previously (57). Differentiation of the TS cells was induced by the removal of FGF4, heparin, and the embryonic fibroblast-conditioned medium (56). Medium was changed every 2 d for a total of 8 d.
RT-PCR.
Total cellular RNA was extracted using Tri-Reagent (Sigma-Aldrich). CDNA was synthesized through reverse transcription using the High Capacity cDNA Reverse Transcription kit (Applied Biosystems). Primers used for PCR are detailed in Table S3. Conventional PCR was performed for 30–35 cycles (94 °C for 30 s; 55–60 °C for 30 s; 72 °C for 30 s). qRT-PCR was performed using SYBR Green PCR Master Mix (Applied Biosystems). Amplification and fluorescence detection were carried out using an ABI Prism 7500 Real Time PCR system (Applied Biosystems). Relative mRNA expression was calculated by the ΔΔCt method, using 18S rRNA as a reference RNA.
Table S3.
Primers used for RT-PCR
| Gene | Accession no. | Forward primer | Reverse primer | Size, bp |
| Primers used for qRT-PCR | ||||
| RNA18S5 | NR_003286.2 | GCAGCCCAAACTAACCTCAC | TAGCCATAAGGTCCGCTCTC | 123 |
| APOA2 | NM_001643.1 | TTCGTGGAACTTGGAACACA | GCAAAGAGTGGGTAGGGACA | 124 |
| ASCL2 | NM_005170.2 | AACTTGAGCTGCTGGAGGGACA | TCTTGGCCAGCATGGAAAACTC | 132 |
| CCR7 | NM_001838.3 | GGAGACTTCTTGGCTTGGTG | GTGAGGGGATGAGTGTGCTT | 148 |
| CGA | NM_000735.3 | TTTCTGGTCACATTGTCGGT | TGGGCAATCCTGCACATCAG | 65 |
| CGB | NM_000737.3 | CCTGGCCTTGTCTACCTCTT | GGCTTTATACCTCGGGGTTG | 108 |
| CORO1A | NM_007074.3 | TGCACCCAGACACGATCTAC | CGGTCCTTCTCAGCTACGAC | 126 |
| CTD-2620I22.3 | HG511000.1 | CCACAAAAACCCAAGAGGAA | AGGGCCTAGGAAAGTGGAGA | 104 |
| ENC1 | NM_003633.3 | CCGTGACCGTCGCTAGAA | ACGCTGCTGGCGTAAAAG | 192 |
| ERVFRD-1 | NM_207582.2 | CCAAATTCCCTCCTCTCCTC | CGGGTGTTAGTTTGCTTGGT | 115 |
| ERVH48-1 | BC005107.1 | AGGTAGGAGGGAGCCAAAGA | AGTGCGATAACCCCATGAAC | 109 |
| ERVV-1 | NM_152473.2 | TAACAGTGGGGCGATAGAGG | AGACTTCACAGCCTCCCAAA | 111 |
| ERVV-2 | NM_001191055.1 | CAGGCACAGTGGAATGAAAA | GACCTGGTGATGAAGTTGTGG | 103 |
| ERVW-1 | NM_014590.3 | CTACCCCAACTGCGGTTAAA | GGTTCCTTTGGCAGTATCCA | 84 |
| GCM1 | NM_003643.3 | GCAACACCAACAACCACAAC | GTAAATCTTGCGGCCTTCCT | 100 |
| HSD11B2 | NM_000196.3 | CAGATGGACCTGACCAAACC | AGCTCCGCATCAGCAACTAC | 130 |
| ID1 | NM_002165.3 | GGTGGTGCGCTGTCTGTCT | AGCACGTTTACCTGCTGCTC | 104 |
| ITGA2 | NM_002203.3 | TCAGGCTCACCGAGGTGACCAG | GGTGCTGACCCAAAATGCCCTCTT | 184 |
| KRT7 | NM_005556.3 | ACACATCTGTGGTGCTGTCC | CTCATACTGCGCCTTGACCT | 150 |
| MMP12 | NM_002426.4 | TGGTTTTTGCCCGTGGAGCTCAT | GAATGGCCAATCTCGTGAACAGCA | 186 |
| MYC | NM_002467.4 | GGAGGCTATTCTGCCCATTT | GGCTGCTGGTTTTCCACTAC | 121 |
| NANOS1 | NM_199461.2 | GAACAACAAGGAGGCGATG | CGGGCAGTACTTGATGGTGT | 144 |
| OVOL1 | NM_004561.3 | CCGTGCGTCTCCACGTGCAA | GGCTGTGGTGGGCAGAAGCC | 100 |
| OVOL2 | NM_021220.3 | CCGATGGACACCTGGCGACC | GACGGTTCAGCATGCGCTGC | 140 |
| POU5F1 | NM_002701.5 | ATTCAGCCAAACGACCATCT | AGCTTCCTCCACCCACTTCT | 99 |
| PRR9 | NM_001195571.1 | CCAAACAACCAGAAGGGAAA | ACAGACCAGCCTGCATCAC | 148 |
| RP11-145M9.4 | HG496359.1 | GAACAGGCCCTTTTGCTGT | TTTGGCAGCTATGCTGTTTG | 149 |
| SERPINE1 | NM_000602.4 | CTCTCTCTGCCCTCACCAAC | CCAGGTTCTCTAGGGGCTTC | 143 |
| STAT1 | NM_007315.3 | GACCGCACCTTCAGTCTTTT | TGAACTGGACCCCTGTCTTC | 117 |
| TFF1 | NM_003225.2 | CACCATGGAGAACAAGGTGA | TGACACCAGGAAAACCACAA | 133 |
| TP63 | NM_003722.4 | GAAACGTACAGGCAACAGCA | GATAAGCTGGCTCACAGAAGG | 149 |
| WIPF1 | NM_003387.4 | GACGGTCACCAATGACAGAA | CTGGAACAATCCTCCCAGAC | 171 |
| ZNF702P | NR_003578.1 | CATGTGCTTGGCCATGTTAG | ACCCTGGCTCCTTTTCTTTG | 104 |
| Primers used for conventional RT-PCR | ||||
| hOVOL1 | NM_004561.3 | CGCGGCGAGATCTACGTGCC | GCCGCACGCCAGTGTGAGTT | 438 |
| mOvol1 | NM_019935.3 | TCGACTTACCAGAGCGAACC | GTCTCGAAGGCTCATGTCCAA | 244 |
| mOvol2 | NM_026924.3 | CCACCCTGAGTGAAGAGGAG | TTGCTGTCCCAAAAGAAGAGA | 163 |
| rOvol1 | NM_001107572.1 | CAGAGACCAGGGCTTCCTAC | TGGGTTCGGACATGTCTCTTG | 218 |
| rOvol2 | NM_001106519.1 | CCTACAAATGCGAGGTGTGTT | TGGGGATGTCAGCTTGTTCT | 262 |
In Situ Hybridization.
In situ hybridization for OVOL1 and CDH1 expression was performed on paraffin-embedded sections using the RNAScope 2-plex chromogenic assay (Advanced Cell Diagnostics 320494), following the protocols provided by the manufacturer. Probes were designed to detect OVOL1 (NM_004561.3, probe region 893–2,313), CDH1 (NM_004360.3, probe region 263–1,255), POLR2A (positive control, NM_000937.4, probe region 2,514–3,433), PPIB (positive control, NM_000942.4, probe region 139–989), and DapB (negative control, EF191515, probe region 414–862).
Western Blotting.
Whole-cell lysates were prepared using 62.5 mM Tris⋅HCl (pH 6.8), 10% glycerol, 2% SDS, and 50 mM DTT; nuclear lysates were prepared using the NE-PER nuclear/cytoplasmic protein extraction kit (Thermo Fisher Scientific). Protein was electrophoretically separated on SDS/PAGE gels and transferred to polyvinylidene fluoride membranes. Membranes were subsequently probed using antibodies for OVOL1 (1 μg/mL; clone ARP38500; Aviva Systems Biology), ERVFRD-1 (1 μg/mL; ARP56008_050; Aviva Systems Biology), MYC (1:1,000; clone D84C12; Cell Signaling Technology), TP63α (1:1,000; 4892, Cell Signaling Technology), ID1 (1:1,000; clone EPR7098; Abcam), ASCL2 (1 μg/mL; AF6539; R&D Systems), GCM1 (0.1 μg/mL; HPA011343; Sigma-Aldrich), transcription factor II D (TFIID) (0.2 μg/mL; sc-56794; Santa Cruz Biotechnology), and α-tubulin (0.05 μg/mL; clone CP06; EMD-Millipore Corp.). Membranes then were incubated with HRP-conjugated antibodies, immersed in Luminata Classico chemiluminescence reagent (EMD-Millipore Corp.), and detected using GeneMate basic blue autoradiography film (BioExpress).
Immunofluorescence and Immunohistochemistry.
For immunofluorescence studies, cells were fixed using 4% paraformaldehyde and were permeabilized. Paraffin-embedded tissues were sectioned at 5-μm thickness, deparaffinized, rehydrated in a graded series of ethanol washes, and subjected to antigen retrieval at 95 °C in decloaking agent (RV1000M, Biocare Medical). Subsequently, cells or tissues were probed with antibodies specific for OVOL1 (1:50; clone HPA003984; Sigma-Aldrich), CGB (1:200; clone RB-059A; DAKO), CDH1 (1:200; clone 24E10; Cell Signaling Technology), cytokeratin 7 (1:100; clone OV-TL 12/30; DAKO), phospho-histone H3 Ser10 (1:400; 9701; Cell Signaling Technology), MYC (1:200; clone Y69; Abcam), TP63 (1:100; clone 4A4; Biocare Medical), ID1 (1:1,000; Abcam), ASCL2 (5 μg/mL; R&D Systems), PCNA (1:200; clone PC10; Santa Cruz Biotechnology), OVOL2 (1:100; clone NBP1-88754; Novus Biologicals), and FITC-conjugated pan-cytokeratin antibody (1:400; clone C-11; Sigma-Aldrich). Following a 1-h incubation with species-appropriate fluorescent-conjugated antibodies, cells were incubated with DAPI (Molecular Probes) to detect nuclei or with rhodamine-phalloidin (1:100; Life Technologies) to detect actin fibers (F-actin) and were visualized using a Leica DMI 4000 microscope (Leica Microsystems GmbH). For analysis of cell fusion, images were taken from four randomly selected fields per well in triplicate at 40× magnification. Lack of CDH1 or actin staining combined with CGB fluorescence was used to denote clusters of cells that had syncytialized. The total number of nuclei in these syncytialized clusters was divided by the number of nuclei within the field and multiplied by 100 to calculate a “% fusion” index. For analysis of phospho-histone H3 staining, two fields per well in four wells were examined for each group at 40× magnification. The number of nuclei that stained positively for phospho-histone H3 was divided by the total number of nuclei within that field and multiplied by 100 to calculate the percent of nuclei positive for phospho-histone H3.
DNA Microarray.
Affymetrix human U133 2.0 DNA microarray chips (Affymetrix) were probed with cDNAs generated from BeWo trophoblast cells grown under control conditions or following treatment with 8-Br-cAMP. Each group was analyzed in triplicate. Chips were subsequently scanned using the Affymetrix GeneChip Scanner 3000 (Affymetrix) with autoloader by the KUMC Biotechnology Support Facility. Hybridization signals were normalized to internal controls using the MAS5 algorithm in the Expression Console (Affymetrix), and fold change was calculated. Significant differences were determined by Student’s t tests. Analysis was limited to probe sets changing at least twofold between groups, with signal strengths ≥300 for the maximal value. Genes significantly altered were categorized using the Database for Annotation, Visualization and Integrated Discovery (DAVID) software (58). Data are available on the Gene Expression Omnibus website (accession no. GSE66840).
RNA-Seq.
Deep sequencing was conducted on mRNA isolated from 8-Br-cAMP–exposed BeWo trophoblast cells expressing control shRNA versus OVOL1 shRNA (in triplicate). CDNA libraries from total RNA samples (500 ng input) were prepared from Illumina TruSeq RNA sample preparation kits (Illumina), and protocols followed the manufacturer's recommendations. RNA integrity was assessed using an Agilent 2100 Bioanalyzer (Agilent Technologies Inc.) before sequencing. Libraries were clustered onto a TruSeq paired-end flow cell and were sequenced (100-bp paired-end reads) using a TruSEq 200-cycle SBS kit (Illumina). Samples were run on an Illumina HiSeq2000 sequencer located at the KUMC Genome Sequencing Facility. Reads from *.fastq files were mapped to the human reference genome (hg19) using CLC Bio Genomics Workbench 7.0 (CLC Bio), and transcript abundance was expressed as RPKM. Analysis was restricted to transcripts in which all replicates >0 RPKM and with a weighted difference between groups ≥1 × 10⁻⁶. Statistical significance was calculated by empirical analysis of digital gene expression, followed by Bonferroni’s correction. Data are available on the Gene Expression Omnibus website (accession no. GSE66962).
shRNA Constructs and Production of Lentiviruses.
Human OVOL1 shRNA constructs in pLKO.1 vectors were obtained from Sigma-Aldrich. Control shRNA that does not target any known mammalian gene was obtained from Addgene (pLKO.1-shScramble, plasmid 1864); a plasmid with the same backbone as pLKO.1 but with a GFP cassette replacing the puromycin resistance cassette was obtained from Addgene (pLKO.3G, plasmid 14748). The sense target sites for the shRNAs are OVOL1-a, AGTGTCACAACGACGTCAAGA; OVOL1-b, CCGCCACATGAAGTGTCACAA; Control, CCTAAGGTTAAGTCGCCCTCG. Lentiviruses were generated from Lipofectamine 2000-based transfection of HEK-293FT cells as previously described (59, 60).
ChIP.
ChIP was performed as previously described (59). Briefly, fixed, sonicated lysates were incubated with OVOL1 antibody (2.5 μg) (Clone HPA003984; Sigma-Aldrich) or affinity-purified rabbit IgG (negative control; 550875; BD Biosciences). Immunoprecipitated chromatin fragments were captured using protein A-conjugated Sepharose beads (GE Healthcare); eluted and purified DNA fragments were assessed by qPCR using SYBR Green PCR master mix. Primers were designed to span the region surrounding consensus OVOL1 DNA-binding motifs CC/TGTTA (Table S4) (19, 46, 61). Relative occupancy was normalized to input samples by use of the ΔΔCt method.
Table S4.
Primers used for ChIP
| Gene name | CT/CGTTA | Forward primer | Reverse primer |
| ASCL2 | −955 | TCCACAAAAATCTCCGTTCC | CACTGCAGAAATGCGAAAAA |
| ERVFRD-1 | −9,879 | TGGAAGAGAAGACAAGTGCAAA | ACACACACACCTGCATACACAC |
| ERVFRD-1 | −9,643 | GGGGAATGAAGGAAGTAAAACC | CACTTTGGGTCTGGGAATTGT |
| ERVFRD-1 | −8,976 | TGGAAGACAGCCAGCTACATAA | TGTCACCATGAAAATCTGAGAAA |
| ERVFRD-1 | −8,539 | AGCCACCTGGTCTATGGTATTT | GTTATACTGCACCTGGGCTTTT |
| ERVFRD-1 | −7,144 | ATGTGCTTCAGTTTCCTGTTCT | TTTTAGGCATTCACTTTAGCTTG |
| ERVFRD-1 | −7,040 | CCATTCTCAAAGGGTATGTGGT | CTTAGAGGGGAGGAGGTTGG |
| ERVFRD-1 | −3,193 | CGAAATGCAACAAAATCCAC | GACCTCAAGTGATCCACCTACC |
| ERVFRD-1 | −1,061 | AGGAGGCAAAGGTTGCAGTGAG | ATGAGAGTGGTTTCCAGCTTTTG |
| ERVFRD-1 | −663 | AAATTAGCTGGGCATGGTGGTG | CAATCTTGGCTCACTGCAACCT |
| ERVFRD-1 | −486 | CAGAGCGAGGCTGTCTCCAAAA | GCTCATGTCTGCCTGACTACCTAC |
| ERVFRD-1 | 758 | TGACTTACCATATGCTTTTCATCC | CCTTAAGGGCTACAGAGTGAGGT |
| ERVFRD-1 | 3,779 | ACTGTTCACAGACCTTCCCATT | AGCTAGAAGGATTCTTGGGCTGA |
| ERVFRD-1 | 3,952 | AAGAGGGATTTCAGCTTCTGACT | GGTCCTGGACTAGCCTGTATTTT |
| ERVFRD-1 | 4,318 | CAGGACCTAAGTCTTGAGAGGAG | GGACTAGATGTTGGATTCCCAGT |
| ERVFRD-1 | 4,457 | CGTGTCTGAAAACAGACTCCTAAA | GGAAACTGAGTTAAGGGTGGAAC |
| ERVFRD-1 | 4,853 | ACACGTTTCTGGTTCTTCACACT | ACTGTGCACTATTGTCACCTCCT |
| ERVFRD-1 | 6,488 | GTTCTCATTCTCACGCCTTCACT | AGTAAGGGGATCCTGTACTTTGG |
| ERVFRD-1 | 8,975 | CTCCTGCTATAAAACTTGCCTTG | ACACTGAGTCGGGTGTTAGTTTG |
| ERVFRD-1 | 11,999 | GCTTCTCTACCTCTACCCTCACC | CCAAGCTCCTACAAATGAAACAC |
| ERVFRD-1 | 13,414 | GGACTAAGAAGCGACCACCA | GGTGTTTTCTACCCCCACTATTC |
| GAPDH | – | ACCCCCTTCCTTACAAGTGTTC | ACAGGGGATCCATTCTTCTGGT |
| ID1 | −899 | CGTCCGGGTTTTATGAATGG | CCTGCAACAGTTCGTGATTTTT |
| MYC | −1,171 | GGGAAAGAGGACCTGGAAAGG | AGAGACAAATCCCCTTTGCGC |
| ΔNP63 | −1,812 | AATGACTTTGGTAGGCAGTTGTG | GCTAGGCGGTTCTGGATGAG |
Statistical Analysis.
Statistical analyses of data obtained by DNA microarray and RNA-seq are discussed above. For other measures, statistical comparisons between two means were performed with Student’s t test. Comparisons of multiple groups were evaluated with ANOVA. The source of variation from significant F-ratios was determined with Bonferroni’s multiple comparison test. Results were deemed statistically significant when P < 0.05. All experiments were conducted at least in triplicate and were replicated at least two to three times. Graphing and statistical analyses were performed using GraphPad Prism 6.0.
Acknowledgments
We thank Dr. Margaret Petroff, Michigan State University, for providing human trophoblast cells; Kelsey E. Pierson, University of Kansas Medical Center (KUMC), for technical assistance with ES and induced pluripotent cells (iPS) cell culture; Dr. Janet Rossant, The Hospital for Sick Children, for providing mouse trophoblast stem (TS) cells; Drs. R. Michael Roberts and Toshihiko Ezashi, University of Missouri, and Dr. Mana Parast, University of California, San Diego, for advice in the maintenance and differentiation of human ES cells; Dr. Jeremy Chien, KUMC, for guidance in the bioinformatic analysis of the RNA-seq data; and Dr. Michael W. Wolfe, KUMC, for comments and advice during various stages of this project. This work was supported by Grants HD020676, HD079363, and HD079850.
Footnotes
The authors declare no conflict of interest.
This article is a PNAS Direct Submission.
Data deposition: The sequences reported in this paper have been deposited in the Gene Expression Omnibus database (accession nos. GSE66840 and GSE66962).
This article contains supporting information online at www.pnas.org/lookup/suppl/doi:10.1073/pnas.1507397112/-/DCSupplemental.
References
- 1.Simpson RA, Mayhew TM, Barnes PR. From 13 weeks to term, the trophoblast of human placenta grows by the continuous recruitment of new proliferative units: A study of nuclear number using the disector. Placenta. 1992;13(5):501–512. doi: 10.1016/0143-4004(92)90055-x. [DOI] [PubMed] [Google Scholar]
- 2.Benirschke K, Burton GJ, Baergen RN. Pathology of the Human Placenta. Springer; New York: 2012. [Google Scholar]
- 3.Ishihara N, et al. Increased apoptosis in the syncytiotrophoblast in human term placentas complicated by either preeclampsia or intrauterine growth retardation. Am J Obstet Gynecol. 2002;186(1):158–166. doi: 10.1067/mob.2002.119176. [DOI] [PubMed] [Google Scholar]
- 4.Gauster M, Moser G, Orendi K, Huppertz B. Factors involved in regulating trophoblast fusion: Potential role in the development of preeclampsia. Placenta. 2009;30(Suppl A):S49–54. doi: 10.1016/j.placenta.2008.10.011. [DOI] [PubMed] [Google Scholar]
- 5.Fitzgerald B, et al. Villous trophoblast abnormalities in extremely preterm deliveries with elevated second trimester maternal serum hCG or inhibin-A. Placenta. 2011;32(4):339–345. doi: 10.1016/j.placenta.2011.01.018. [DOI] [PubMed] [Google Scholar]
- 6.Tannetta DS, Dragovic RA, Gardiner C, Redman CW, Sargent IL. Characterisation of syncytiotrophoblast vesicles in normal pregnancy and pre-eclampsia: Expression of Flt-1 and endoglin. PLoS One. 2013;8(2):e56754. doi: 10.1371/journal.pone.0056754. [DOI] [PMC free article] [PubMed] [Google Scholar]
- 7.Knight M, Redman CW, Linton EA, Sargent IL. Shedding of syncytiotrophoblast microvilli into the maternal circulation in pre-eclamptic pregnancies. Br J Obstet Gynaecol. 1998;105(6):632–640. doi: 10.1111/j.1471-0528.1998.tb10178.x. [DOI] [PubMed] [Google Scholar]
- 8.Huppertz B, Gauster M. Trophoblast fusion. Adv Exp Med Biol. 2011;713:81–95. doi: 10.1007/978-94-007-0763-4_6. [DOI] [PubMed] [Google Scholar]
- 9.Handwerger S. New insights into the regulation of human cytotrophoblast cell differentiation. Mol Cell Endocrinol. 2010;323(1):94–104. doi: 10.1016/j.mce.2009.12.015. [DOI] [PMC free article] [PubMed] [Google Scholar]
- 10. Loregger T, Pollheimer J, & Knofler M (2003) Regulatory transcription factors controlling function and differentiation of human trophoblast–a review. Placenta 24(Suppl A):S104–110. [DOI] [PubMed]
- 11.Blaise S, de Parseval N, Bénit L, Heidmann T. Genomewide screening for fusogenic human endogenous retrovirus envelopes identifies syncytin 2, a gene conserved on primate evolution. Proc Natl Acad Sci USA. 2003;100(22):13013–13018. doi: 10.1073/pnas.2132646100. [DOI] [PMC free article] [PubMed] [Google Scholar]
- 12.Mi S, et al. Syncytin is a captive retroviral envelope protein involved in human placental morphogenesis. Nature. 2000;403(6771):785–789. doi: 10.1038/35001608. [DOI] [PubMed] [Google Scholar]
- 13.Liang CY, et al. GCM1 regulation of the expression of syncytin 2 and its cognate receptor MFSD2A in human placenta. Biol Reprod. 2010;83(3):387–395. doi: 10.1095/biolreprod.110.083915. [DOI] [PubMed] [Google Scholar]
- 14.Yu C, et al. GCMa regulates the syncytin-mediated trophoblastic fusion. J Biol Chem. 2002;277(51):50062–50068. doi: 10.1074/jbc.M209316200. [DOI] [PubMed] [Google Scholar]
- 15.Johnson AD, Fitzsimmons D, Hagman J, Chamberlin HM. EGL-38 Pax regulates the ovo-related gene lin-48 during Caenorhabditis elegans organ development. Development. 2001;128(15):2857–2865. doi: 10.1242/dev.128.15.2857. [DOI] [PubMed] [Google Scholar]
- 16.Payre F, Vincent A, Carreno S. ovo/svb integrates Wingless and DER pathways to control epidermis differentiation. Nature. 1999;400(6741):271–275. doi: 10.1038/22330. [DOI] [PubMed] [Google Scholar]
- 17.Dai X, et al. The ovo gene required for cuticle formation and oogenesis in flies is involved in hair formation and spermatogenesis in mice. Genes Dev. 1998;12(21):3452–3463. doi: 10.1101/gad.12.21.3452. [DOI] [PMC free article] [PubMed] [Google Scholar]
- 18.Li B, et al. Ovol1 regulates meiotic pachytene progression during spermatogenesis by repressing Id2 expression. Development. 2005;132(6):1463–1473. doi: 10.1242/dev.01658. [DOI] [PMC free article] [PubMed] [Google Scholar]
- 19.Nair M, et al. Ovol1 regulates the growth arrest of embryonic epidermal progenitor cells and represses c-myc transcription. J Cell Biol. 2006;173(2):253–264. doi: 10.1083/jcb.200508196. [DOI] [PMC free article] [PubMed] [Google Scholar]
- 20.Teng A, Nair M, Wells J, Segre JA, Dai X. Strain-dependent perinatal lethality of Ovol1-deficient mice and identification of Ovol2 as a downstream target of Ovol1 in skin epidermis. Biochim Biophys Acta. 2007;1772(1):89–95. doi: 10.1016/j.bbadis.2006.08.012. [DOI] [PMC free article] [PubMed] [Google Scholar]
- 21.Chidambaram A, et al. Characterization of a human homolog (OVOL1) of the Drosophila ovo gene, which maps to chromosome 11q13. Mamm Genome. 1997;8(12):950–951. doi: 10.1007/s003359900620. [DOI] [PubMed] [Google Scholar]
- 22.Wice B, Menton D, Geuze H, Schwartz AL. Modulators of cyclic AMP metabolism induce syncytiotrophoblast formation in vitro. Exp Cell Res. 1990;186(2):306–316. doi: 10.1016/0014-4827(90)90310-7. [DOI] [PubMed] [Google Scholar]
- 23.Xu RH, et al. BMP4 initiates human embryonic stem cell differentiation to trophoblast. Nat Biotechnol. 2002;20(12):1261–1264. doi: 10.1038/nbt761. [DOI] [PubMed] [Google Scholar]
- 24.Amita M, et al. Complete and unidirectional conversion of human embryonic stem cells to trophoblast by BMP4. Proc Natl Acad Sci USA. 2013;110(13):E1212–E1221. doi: 10.1073/pnas.1303094110. [DOI] [PMC free article] [PubMed] [Google Scholar]
- 25.Ezashi T, Telugu BP, Roberts RM. Model systems for studying trophoblast differentiation from human pluripotent stem cells. Cell Tissue Res. 2012;349(3):809–824. doi: 10.1007/s00441-012-1371-2. [DOI] [PMC free article] [PubMed] [Google Scholar]
- 26.Li Y, et al. BMP4-directed trophoblast differentiation of human embryonic stem cells is mediated through a ΔNp63+ cytotrophoblast stem cell state. Development. 2013;140(19):3965–3976. doi: 10.1242/dev.092155. [DOI] [PMC free article] [PubMed] [Google Scholar]
- 27.Nair M, Bilanchone V, Ortt K, Sinha S, Dai X. Ovol1 represses its own transcription by competing with transcription activator c-Myb and by recruiting histone deacetylase activity. Nucleic Acids Res. 2007;35(5):1687–1697. doi: 10.1093/nar/gkl1141. [DOI] [PMC free article] [PubMed] [Google Scholar]
- 28.Tanaka M, Gertsenstein M, Rossant J, Nagy A. Mash2 acts cell autonomously in mouse spongiotrophoblast development. Dev Biol. 1997;190(1):55–65. doi: 10.1006/dbio.1997.8685. [DOI] [PubMed] [Google Scholar]
- 29.Vargas A, et al. Syncytin-2 plays an important role in the fusion of human trophoblast cells. J Mol Biol. 2009;392(2):301–318. doi: 10.1016/j.jmb.2009.07.025. [DOI] [PubMed] [Google Scholar]
- 30.Orendi K, Gauster M, Moser G, Meiri H, Huppertz B. The choriocarcinoma cell line BeWo: Syncytial fusion and expression of syncytium-specific proteins. Reproduction. 2010;140(5):759–766. doi: 10.1530/REP-10-0221. [DOI] [PubMed] [Google Scholar]
- 31.Staab S, Steinmann-Zwicky M. Female germ cells of Drosophila require zygotic ovo and otu product for survival in larvae and pupae respectively. Mech Dev. 1996;54(2):205–210. doi: 10.1016/0925-4773(95)00477-7. [DOI] [PubMed] [Google Scholar]
- 32.Delon I, Chanut-Delalande H, Payre F. The Ovo/Shavenbaby transcription factor specifies actin remodelling during epidermal differentiation in Drosophila. Mech Dev. 2003;120(7):747–758. doi: 10.1016/s0925-4773(03)00081-9. [DOI] [PubMed] [Google Scholar]
- 33.Albrecht ED, Pepe GJ. Placental steroid hormone biosynthesis in primate pregnancy. Endocr Rev. 1990;11(1):124–150. doi: 10.1210/edrv-11-1-124. [DOI] [PubMed] [Google Scholar]
- 34.Esnault C, Cornelis G, Heidmann O, Heidmann T. Differential evolutionary fate of an ancestral primate endogenous retrovirus envelope gene, the EnvV syncytin, captured for a function in placentation. PLoS Genet. 2013;9(3):e1003400. doi: 10.1371/journal.pgen.1003400. [DOI] [PMC free article] [PubMed] [Google Scholar]
- 35.Watanabe K, et al. Mammary morphogenesis and regeneration require the inhibition of EMT at terminal end buds by Ovol2 transcriptional repressor. Dev Cell. 2014;29(1):59–74. doi: 10.1016/j.devcel.2014.03.006. [DOI] [PMC free article] [PubMed] [Google Scholar]
- 36.Diebold J, Arnholdt H, Lai MD, Löhrs U. C-myc expression in early human placenta--a critical evaluation of its localization. Virchows Arch B Cell Pathol Incl Mol Pathol. 1991;61(1):65–73. doi: 10.1007/BF02890406. [DOI] [PubMed] [Google Scholar]
- 37.Xue WC, et al. Id helix-loop-helix proteins are differentially expressed in gestational trophoblastic disease. Histopathology. 2005;47(3):303–309. doi: 10.1111/j.1365-2559.2005.02190.x. [DOI] [PubMed] [Google Scholar]
- 38.Lee Y, et al. A unifying concept of trophoblastic differentiation and malignancy defined by biomarker expression. Hum Pathol. 2007;38(7):1003–1013. doi: 10.1016/j.humpath.2006.12.012. [DOI] [PubMed] [Google Scholar]
- 39.Lasorella A, Uo T, Iavarone A. Id proteins at the cross-road of development and cancer. Oncogene. 2001;20(58):8326–8333. doi: 10.1038/sj.onc.1205093. [DOI] [PubMed] [Google Scholar]
- 40.Waikel RL, Kawachi Y, Waikel PA, Wang XJ, Roop DR. Deregulated expression of c-Myc depletes epidermal stem cells. Nat Genet. 2001;28(2):165–168. doi: 10.1038/88889. [DOI] [PubMed] [Google Scholar]
- 41.Romano RA, et al. ΔNp63 knockout mice reveal its indispensable role as a master regulator of epithelial development and differentiation. Development. 2012;139(4):772–782. doi: 10.1242/dev.071191. [DOI] [PMC free article] [PubMed] [Google Scholar]
- 42.Li Y, Moretto-Zita M, Leon-Garcia S, Parast MM. p63 inhibits extravillous trophoblast migration and maintains cells in a cytotrophoblast stem cell-like state. Am J Pathol. 2014;184(12):3332–3343. doi: 10.1016/j.ajpath.2014.08.006. [DOI] [PMC free article] [PubMed] [Google Scholar]
- 43.Jiang B, Kamat A, Mendelson CR. Hypoxia prevents induction of aromatase expression in human trophoblast cells in culture: Potential inhibitory role of the hypoxia-inducible transcription factor Mash-2 (mammalian achaete-scute homologous protein-2) Mol Endocrinol. 2000;14(10):1661–1673. doi: 10.1210/mend.14.10.0539. [DOI] [PubMed] [Google Scholar]
- 44.Jiang B, Mendelson CR. USF1 and USF2 mediate inhibition of human trophoblast differentiation and CYP19 gene expression by Mash-2 and hypoxia. Mol Cell Biol. 2003;23(17):6117–6128. doi: 10.1128/MCB.23.17.6117-6128.2003. [DOI] [PMC free article] [PubMed] [Google Scholar]
- 45.Kumar P, Luo Y, Tudela C, Alexander JM, Mendelson CR. The c-Myc-regulated microRNA-17∼92 (miR-17∼92) and miR-106a∼363 clusters target hCYP19A1 and hGCM1 to inhibit human trophoblast differentiation. Mol Cell Biol. 2013;33(9):1782–1796. doi: 10.1128/MCB.01228-12. [DOI] [PMC free article] [PubMed] [Google Scholar]
- 46.Lee B, et al. Transcriptional mechanisms link epithelial plasticity to adhesion and differentiation of epidermal progenitor cells. Dev Cell. 2014;29(1):47–58. doi: 10.1016/j.devcel.2014.03.005. [DOI] [PMC free article] [PubMed] [Google Scholar]
- 47.Baczyk D, et al. Glial cell missing-1 transcription factor is required for the differentiation of the human trophoblast. Cell Death Differ. 2009;16(5):719–727. doi: 10.1038/cdd.2009.1. [DOI] [PubMed] [Google Scholar]
- 48.Anson-Cartwright L, et al. The glial cells missing-1 protein is essential for branching morphogenesis in the chorioallantoic placenta. Nat Genet. 2000;25(3):311–314. doi: 10.1038/77076. [DOI] [PubMed] [Google Scholar]
- 49.Baczyk D, et al. Complex patterns of GCM1 mRNA and protein in villous and extravillous trophoblast cells of the human placenta. Placenta. 2004;25(6):553–559. doi: 10.1016/j.placenta.2003.12.004. [DOI] [PubMed] [Google Scholar]
- 50.Unezaki S, Horai R, Sudo K, Iwakura Y, Ito S. Ovol2/Movo, a homologue of Drosophila ovo, is required for angiogenesis, heart formation and placental development in mice. Genes Cells. 2007;12(6):773–785. doi: 10.1111/j.1365-2443.2007.01084.x. [DOI] [PubMed] [Google Scholar]
- 51.Kumar A, et al. Molecular phylogeny of OVOL genes illustrates a conserved C2H2 zinc finger domain coupled by hypervariable unstructured regions. PLoS One. 2012;7(6):e39399. doi: 10.1371/journal.pone.0039399. [DOI] [PMC free article] [PubMed] [Google Scholar]
- 52.Roca H, et al. Transcription factors OVOL1 and OVOL2 induce the mesenchymal to epithelial transition in human cancer. PLoS One. 2013;8(10):e76773. doi: 10.1371/journal.pone.0076773. [DOI] [PMC free article] [PubMed] [Google Scholar]
- 53.Kliman HJ, Nestler JE, Sermasi E, Sanger JM, Strauss JF., 3rd Purification, characterization, and in vitro differentiation of cytotrophoblasts from human term placentae. Endocrinology. 1986;118(4):1567–1582. doi: 10.1210/endo-118-4-1567. [DOI] [PubMed] [Google Scholar]
- 54.Schulz LC, et al. Human embryonic stem cells as models for trophoblast differentiation. Placenta. 2008;29(Suppl A):S10–16. doi: 10.1016/j.placenta.2007.10.009. [DOI] [PMC free article] [PubMed] [Google Scholar]
- 55.Boulting GL, et al. A functionally characterized test set of human induced pluripotent stem cells. Nat Biotechnol. 2011;29(3):279–286. doi: 10.1038/nbt.1783. [DOI] [PMC free article] [PubMed] [Google Scholar]
- 56.Tanaka S, Kunath T, Hadjantonakis AK, Nagy A, Rossant J. Promotion of trophoblast stem cell proliferation by FGF4. Science. 1998;282(5396):2072–2075. doi: 10.1126/science.282.5396.2072. [DOI] [PubMed] [Google Scholar]
- 57.Asanoma K, et al. FGF4-dependent stem cells derived from rat blastocysts differentiate along the trophoblast lineage. Dev Biol. 2011;351(1):110–119. doi: 10.1016/j.ydbio.2010.12.038. [DOI] [PMC free article] [PubMed] [Google Scholar]
- 58.Huang W, Sherman BT, Lempicki RA. Systematic and integrative analysis of large gene lists using DAVID bioinformatics resources. Nat Protoc. 2009;4(1):44–57. doi: 10.1038/nprot.2008.211. [DOI] [PubMed] [Google Scholar]
- 59.Renaud SJ, Kubota K, Rumi MA, Soares MJ. The FOS transcription factor family differentially controls trophoblast migration and invasion. J Biol Chem. 2014;289(8):5025–5039. doi: 10.1074/jbc.M113.523746. [DOI] [PMC free article] [PubMed] [Google Scholar]
- 60.Lee DS, Rumi MA, Konno T, Soares MJ. In vivo genetic manipulation of the rat trophoblast cell lineage using lentiviral vector delivery. Genesis. 2009;47(7):433–439. doi: 10.1002/dvg.20518. [DOI] [PMC free article] [PubMed] [Google Scholar]
- 61.Oliver B, Perrimon N, Mahowald AP. The ovo locus is required for sex-specific germ line maintenance in Drosophila. Genes Dev. 1987;1(9):913–923. doi: 10.1101/gad.1.9.913. [DOI] [PubMed] [Google Scholar]


