

Abstract
The duration of hemodialysis (HD) in methanol poisoning (MP) is dependent on the methanol concentration, the operational parameters used during HD, and the presence and severity of metabolic acidosis. However, methanol assays are not easily available, potentially leading to undue extension or premature termination of treatment. Here we provide a prediction model for the duration of high-efficiency HD in MP. In a retrospective cohort study, we identified 71 episodes of MP in 55 individuals who were treated with alcohol dehydrogenase inhibition and HD. Four patients had residual visual abnormality at discharge and only one patient died. In 46 unique episodes of MP with high-efficiency HD the mean methanol elimination half-life (T1/2) during HD was 108 min in women, significantly different from the 129 min in men. In a training set of 28 patients with MP, using the 90th percentile of gender-specific elimination T1/2 (147 min in men and 141 min in women) and a target methanol concentration of 4 mmol/l allowed all cases to reach a safe methanol of under 6 mmol/l. The prediction model was confirmed in a validation set of 18 patients with MP. High-efficiency HD time in hours can be estimated using 3.390 × (Ln (MCi/4)) for women and 3.534 × (Ln (MCi/4)) for men, where MCi is the initial methanol concentration in mmol/l, provided that metabolic acidosis is corrected.
Keywords: hemodialysis, kinetic modeling, methanol poisoning
Methanol poisoning (MP), if untreated, may result in blindness, coma, and death, and today it still remains a xenobiotic of concern in outbreaks.1, 2, 3, 4, 5 Hemodialysis (HD) can efficiently remove methanol and its toxic metabolite formic acid while correcting metabolic acidosis and improving patient outcome.4, 5, 6, 7 Current guidelines suggest instituting HD when the methanol concentration is >15.6 mmol/l (50 mg/dl) until concentrations are inferior to 6.25 mmol/l (20 mg/dl) and acid–base disturbance has been corrected.8, 9 However, methanol concentrations may not be readily available in an appropriate time frame, which may lead to either undue prolongation or premature termination of HD. Accordingly, Hirsch et al.10 proposed a formula to predict dialysis duration in toxic alcohol poisoning. Their proposal is based on a natural logarithmic formula requiring the knowledge of total body water using Watson's formula (based on age, gender, height, and weight),11 and the knowledge of dialyzer's urea clearance at the prescribed blood flow and dialysate flow. The formula has been generated using two cases of MP and subsequently validated in three other cases.12 However, in the era of high-efficiency dialysis, we hypothesized that estimation of dialysis duration based on the methanol's elimination half-life (T1/2) would be simpler and more intuitive in predicting HD duration.
The aims of the present study were (1) to describe the clinical presentation, outcomes, and methanol toxicokinetics in a large cohort of methanol poisoned patients, (2) to use a training set of cases of MP to determine methanol elimination T1/2 during HD and to propose a simplified model to predict HD time, and (3) to validate the proposed model using a validation cohort.
RESULTS
Characteristics at presentation and clinical outcomes
The study flow chart is shown in Figure 1. Between December 1997 and June 2013, among the 73 eligible MP episodes, 71 episodes occurred in 55 patients who required HD (Table 1). Baseline characteristics of subjects are presented in Table 1. Most patients were middle-aged healthy men with a history of psychiatric disorder. MP was intentional in 66 episodes (93%). Characteristics of poisoning episodes are summarized in Table 1. Nearly half of the cohort also co-ingested other substances.
Figure 1.

Study flow chart. The chart shows the number of eligible cases of methanol poisoning, the number of cases available for descriptive analysis, kinetic analysis, and model prediction in training set and validation set.
Table 1. Clinical characteristics of patients and episodes of methanol poisoning.
| Parameters | Value |
|---|---|
| Subjects characteristics (n) | 55 |
| Male gender (n, %) | 38 (69) |
| Age (years) | 46 (36,55) |
| Psychiatric disease (n, %) | 48 (87) |
| Intoxication episode (n) | 71 |
| Creatinine on admission (μmol/l) | 75 (68,88) |
| Intentional ingestion (n, %) | 66 (90) |
| Delay between ingestion and ER consultation (min) | 230 (90,510) |
| Delay 24–36 h | 4 |
| Delay 36–96 h | 2 |
| Delay >96 h | 1 |
| Delay between ER and HD (min) | 540 (390,705) |
| Co-ingestion (n, %) | 31 (44) |
| Ethanol | 16 |
| Isopropyl | 3 |
| Salicylate | 2 |
| Acetaminophen | 2 |
| Cocaine | 2 |
| Cannabis | 2 |
| Others | 7 |
| ⩾2 co-ingestants | 8 |
| Clinical severity | |
| Glasgow <8 (n, %) | 22 (31) |
| Intubation (n, %) | 21 (30) |
| Requirement for inotropes/vasopressors (n, %) | 9 (13) |
| Visual abnormality at presentation (n, %) | 9 (13) |
| Laboratory | |
| Arterial pH | 7.31 (7.23, 7.38) |
| Anion gap (mmol/l) | 16 (13,25) |
| Osmol gap (mOsm/kg) | 74 (37,134) |
| Initial methanol concentrationa (mmol/l) | 61.5 (25.1, 110.7) |
| Peak methanol concentrationa (mmol/l) | 64 (26, 111.4) |
| Alcohol dehydrogenase inhibition | |
| Ethanol (n, %) | 53 (74) |
| Fomepizole (n, %) | 9 (13) |
| Both (n, %) | 9 (13) |
Abbreviations: ER, emergency room; HD, hemodialysis.Values are medians (25th, 75th percentiles).
To convert to mg/dl multiply by 3.2.
In most episodes, there were a mild metabolic acidosis, a slightly elevated anion gap, and an increased osmol gap. When compared with other patients, those who presented with a decreased level of consciousness were significantly more acidotic and had a higher osmol gap (Table 2). Among the nine patients who had visual abnormalities at presentation, four had residual visual symptoms at discharge. Compared with patients without any visual symptoms, those with persistent visual abnormalities had a significantly lower median initial pH (7.14 vs. 7.29 P=0.01), without a significantly higher anion gap (27 vs. 19 mmol/l, P=0.08) or an osmol gap (95 vs. 74 mOsm/kg, P=0.54). Only one patient with extreme acidosis (pH=6.85), high anion gap (40 mmol/l), high osmol gap (184 mOsm/kg), and a methanol concentration of 115 mmol/l was comatose on admission and developed cerebral edema resulting in neurologic death. Six patients experienced complications not directly related to MP such as pneumonia (n=4), pyelonephritis (n=1), and myocardial infarction (n=1). MP resulted in a median hospital stay of 2 days (1, 3) in our center before discharge or transfer to the referring center.
Table 2. Determinants of decreased level of consciousness.
|
Level of consciousness |
|||
|---|---|---|---|
| Parameters | Glasgow ⩾8 (n=50) | Glasgow <8 (n=21) | P-value |
| Arterial pH | 7.32 (7.26, 7.38) | 7.26 (7.13, 7.33) | 0.002 |
| Anion gap (mmol/l) | 17 (13, 24) | 16 (13, 27) | 0.30 |
| Osmol gap (mOsm/kg) | 52 (33, 108) | 131 (79, 164) | <0.001 |
| Time to presentation (min) | 233 (91, 642) | 253 (105, 510) | 0.72 |
Values are medians (25th, 75th percentiles).
Determinants of methanol elimination T1/2 during HD
Figure 2 shows methanol elimination T1/2 during HD according to gender. In univariate linear regression analysis, T1/2 was positively influenced by the male gender (β=21 min, 95% confidence interval (CI): 9–34 min, R2=0.21, P=0.001) and increasing weight (β=0.55, R2=0.13, P=0.015). In a stepwise multiple regression, gender remained the only significant determinant of methanol elimination T1/2 during HD. Neither the type of alcohol dehydrogenase (ADH) inhibition (ethanol or fomepizole), the initial methanol concentration, nor the HD-related parameters were found to be significantly associated with the changes in methanol elimination T1/2 in this cohort.
Figure 2.

Gender-specific methanol elimination half-life. The figure shows the methanol elimination T1/2 by high-efficiency hemodialysis with a blood flow of >350 ml/min and a large surface area of dialysis filter of >2.0 m2. Bars represent 95% confidence intervals.
Training set
The characteristics of training set, which consisted of 28 episodes of MP in 28 subjects (nine women), are shown in Table 3. Various half-lives were used to model HD duration to a calculated safe level of methanol <6 mmol/l: the use of gender-specific 90th percentiles and targeting a methanol level of 4 mmol/l by the end of HD session proved to be the most robust method in achieving a safe methanol level for all individuals using the bootstrap method (Table 4). Table 5 shows the delivered HD time, the individual modeling of HD time to a methanol of 6 mmol/l, and the 90th percentile modeling of HD time to 4 mmol/l (Figure 3). In the training set, the delivered HD time was longer compared with the individual modeling HD time by 172 min (95% CI: 107–237) but not statistically longer compared with the 90th percentile model of HD time by 7 min (95% CI: −52–66).
Table 3. Clinical characteristics and episode of methanol poisoning in training and validation set.
| Parameters | Training set (n=28) | Validation set (n=18) |
|---|---|---|
| Age (years) | 47 (40, 52) | 49 (41, 56) |
| Creatinine on admission (μmol/l) | 77 (72, 87) | 71 (64, 87) |
| Psychiatric disease | 24 (86) | 15 (83) |
| Male gender (n, %) | 19 (68) | 11 (61) |
| Weight (kg) | 69 (67, 80) | 70 (67, 80) |
| Multiple substances | 15 (54) | 9 (50) |
| Intentional ingestion | 26 (93) | 17 (94) |
| Delay between ER and HD (min) | 528 (330, 720) | 540 (420, 622) |
| Clinical severity | ||
| Glasgow <8 (n, %) | 12 (43) | 5 (28) |
| Intubation (n, %) | 11 (39) | 5 (28) |
| Requirement for inotropes/vasopressor (n, %) | 5 (18) | 1 (6) |
| Visual abnormality at presentation (n, %) | 3 (18) | 2 (11) |
| Laboratory | ||
| Arterial pH | 7.30 (7.23, 7.36) | 7.30 (7.21, 7.39) |
| Anion gap (mmol/l) | 17 (13, 26) | 16 (13, 24) |
| Osmol gap | 126 (57, 163) | 68 (38, 108) |
| Initial methanol concentrationa (mmol/l) | 97 (36, 124) | 44 (21, 74) |
| Peak methanol concentrationa (mmol/l) | 97 (47, 139) | 44 (26, 74) |
| Final methanol concentrationa (mmol/l) | 3.4 (2.6–4.2) | 3.5 (2.4, 4.2) |
| Alcohol dehydrogenase inhibition | ||
| Ethanol (n, %) | 23 (82) | 11 (61) |
| Fomepizole (n, %) | 2 (7) | 4 (22) |
| Both (n, %) | 3 (11) | 3 (17) |
| T1/2 overall (min) | 126 (108, 138) | 133 (119, 139) |
| Range (min) | 77–155 | 60–147 |
| T1/2 in women (min) | 100 (98, 121) | 119 (75, 135) |
| 90th percentile (95% CI by bootstrap) | 141 (121–141) | 142 (123–142) |
| T1/2 in men (min) | 132 (115, 141) | 137 (129, 139) |
| 90th percentile (95% CI by bootstrap) | 147 (138–155) | 145 (138–147) |
Abbreviations: CI, confidence interval; ER, emergency room; HD, hemodialysis. Values are median (25th, 75th percentile) or mean (95% confidence interval).
To convert to mg/dl multiply by 3.2.
Table 4. Impact of the choice of target methanol concentration on the calculated residual methanol concentration using 90th percentile of methanol elimination half-life.
| Parameters | Training set (n=28) | Validation set (n=18) |
|---|---|---|
| Target (methanol) of 6 mmol/l | ||
| Calculated residual (methanol) (mmol/l) | 4.6 (2.4, 5.3) | 5.0 (4.3, 5.5) |
| Calculated residual (methanol) >6 mmol/l (n, %) | 1 (4) | 2 (11) |
| 95% CI by bootstrap (n)a | 0–3 | 0–7 |
| Target (methanol) of 5 mmol/l | ||
| Calculated residual (methanol) (mmol/l) | 3.8 (1.9, 4.3) | 4.0 (3.5, 4.5) |
| Calculated residual (methanol) >6 mmol/l (n, %) | 1 (4) | 0 (0) |
| 95% CI by bootstrap (n)a | 0–1 | 0–3 |
| Target (methanol) of 4 mmol/l | ||
| Calculated residual (methanol) (mmol/l) | 3.0 (1.4,3.4) | 3.1 (2.7, 3.6) |
| Calculated residual (methanol) >6 mmol/l (n, %) | 0 (0) | 0 (0) |
| 95% CI by bootstrap (n)a | 0–0 | 0–0 |
Abbreviation: CI, confidence interval. Values are median (25th, 75th percentile).
95% CI of the number of subjects with calculated residual methanol concentration (methanol) >to 6 mmol/l using the bootstrap method.
Table 5. Delivered, individual modeling and 90th percentile modeling of HD time.
| Parameters | Training set (n=28) | Validation set (n=18) |
|---|---|---|
| Delivered HD time (min) | 612 (519–704) | 509 (417–601) |
| 95% CI by bootstrap (min) | 527–693 | 431–588 |
| Individual modeling HD timea (min) | 440 (369–510) | 318 (237–398) |
| 95% CI by bootstrap (min) | 376–506 | 245–388 |
| Delivered HD time—individual modeling HD time (min) | 172 (107–237) | 192 (128–255) |
| 95% CI by bootstrap (min) | 122–225 | 142–251 |
| 90th percentile modeling HD timeb (min) | 605 (536–674) | 453 (369–537) |
| 95% CI by bootstrap (min) | 522–680 | 370–531 |
| Delivered HD time—90th percentile modeling HD time (min) | 7 (−52–66) | 56 (5–108) |
| 95% CI by bootstrap (min) | −42–67 | 11–109 |
Abbreviations: CI, confidence interval; HD, hemodialysis. Values are mean (95% CI).
Individual modeling of HD time is defined as time to a calculated residual methanol concentration of 6 mmol/l using each case's baseline methanol concentration and elimination half-life.
90th percentile modeling of HD time is defined as the time to achieve a methanol concentration of 4 mmol/l using each case's baseline methanol concentration and the 90th percentile of gender-specific methanol elimination half-life of the training set.
Figure 3.

Calculated methanol concentration by the end of the 90th percentile modeling of HD to a target methanol of 4 mmol/l. Using the 90th percentile of the gender-specific elimination T½ of methanol during HD and targeting a methanol concentration of 4 mmol/l (target concentration), all cases of methanol poisoning were well below 6 mmol/l (safe concentration) during high-efficiency HD both in the training set and in the validation set of methanol poisoning episodes.
Validation of the proposed model for prediction of HD duration
The validation set consisted of 18 episodes of MP in 18 patients (seven women), which were independent from the training set. The validation set was comparable to the training set in terms of comorbidities, clinical severity of intoxication, biochemical abnormalities, ADH inhibition, and methanol elimination T1/2 during HD (Table 3). The 90th percentile modeling of HD time using a target methanol concentration of 4 mmol/l allowed to reach a calculated safe methanol concentration of <6 mmol/l in all cases (Figure 3). Table 5 shows the delivered HD time, the individual modeling of HD time to methanol concentration of <6 mmol/l, and the 90th percentile modeling of HD time. The delivered HD time was longer compared with the individual modeling HD time by 192 min (95% CI: 128–255) and longer compared with the 90th percentile model of HD time by 56 min (95% CI: 5–108). Finally, Figure 4 shows that, based on the 90th percentile modeling to a methanol of 4 mmol/l, all patients in both training and validation set of MP would have received the minimum HD duration based on the individual modeling to a methanol concentration of 6 mmol/l.
Figure 4.

Individual vs. 90th percentile modeling of HD time. The figure shows the calculated HD time to a methanol concentration of 6 mmol/l based on each patient's methanol elimination half-life and initial methanol concentration on the vertical axis. The horizontal axis shows the 90th percentile modeling of HD time to a methanol concentration of 4 mmol/l. This figure shows that the model ensures that all patients receive at least the required HD duration as defined by the individual modeling of HD time to a calculated methanol concentration of 6 mmol/l.
Figure 5 illustrates a gender-specific nomogram to predict HD time, using high-efficiency HD, based on the 90th percentile of elimination T1/2 and targeting a methanol concentration of 4 mmol/l. To predict dialysis time (hours) based on initial methanol concentration, we propose using the following formulas: 3.390 × (Ln(MCi/4)) for women and 3.534 × (Ln(MCi/4)) for men, where MCi is the initial methanol concentration (mmol/l).
Figure 5.

Gender-specific nomogram for prediction of high-efficiency HD time. The figure shows the gender-specific (women (a), men (b)) nomogram for prediction of high-efficiency HD time using dialysis blood flow of >350 ml/min, membrane surface area of >2.0 m2, and a dialysate flow of 750 ml/min. To ensure that all subjects are adequately treated to a methanol concentration of at least 6 mmol/l, the target methanol concentration using the nomogram should be 4 mmol/l. HD time in hours can be estimated using the 3.390 × (Ln(MCi/4)) for women and 3.534 × (Ln (MCi/4)) for men, where MCi is the initial methanol concentration (mmol/l) and 4 is the target methanol concentration in mmol/l. To convert the methanol concentration from mmol/l to mg/dl, multiply by 3.2.
As part of the sensitivity analysis, we conducted a leave-one-out cross-validation, which confirms that the 90th percentile of T1/2 and a target methanol concentration of 4 mmol/l achieved a methanol concentration of <6 mmol/l in all cases, while resulting in the lowest HD duration time (Supplementary Table S4).
DISCUSSION
This study proposes a simple calculation derived from a kinetic model using the 90th percentile methanol elimination T1/2 (147 min in men and 141 min in women) and targeting a methanol concentration of 4 mmol/l to predict the optimal duration of high-efficiency HD. This approach proved to be valid in our study cohort and achieved a safe methanol concentration in all cases. This study also suggests that our formula may obviate the need for costly monitoring of methanol concentrations during HD.
Methanol is a small molecule (32 Da), with a small volume of distribution (0.6–0.7 l/kg) and no protein binding. The elimination of methanol without an antidote is of zero order with an elimination rate of 85 mg/l/h at low concentration.13 When fomepizole or ethanol is used, the apparent T1/2 is significantly prolonged to ~54 and 43 h, respectively, with the total body elimination coming mostly from the lungs and the kidneys (<10 ml/min).14, 15 The systematic review and the clinical guidelines published by the EXTRIP workgroup reported 114 patients, where the mean T1/2 during HD was 3.4 h (range: 0.6–13.1).9 Recently, in 11 patients, Zacharof et al.16 showed that the mean methanol elimination T1/2 during HD was 3.7±1.4 h. This is ~100 min longer compared with the elimination T1/2 reported in the present study. This difference is likely the result of lower blood flow, (180–250 ml/min vs. >350 ml/min), lower membrane surface area (1.5–1.6 m2 vs. >2.0 m2), and lower dialysate flow (500 ml/min vs. 750 ml/min) in their study. Whereas Hirsch's approach is mechanistically sophisticated, it is slightly complex and has only been validated in three cases of MP.10, 12 Unfortunately, we could not validate Hirsch's approach in our cohort as the information on height was unavailable in clinical records, and therefore we could not estimate total body water using Watson's equation.
To our knowledge, this is the first study to show that men had a longer methanol elimination T1/2 than women. This difference is likely the result of a lower methanol volume of distribution in women. It is unlikely that the sex differences in clearance are explained by differences in endogenous elimination during ADH inhibition, given its negligible contribution to total methanol clearance during HD.
In the present study, we did not observe any significant associations between HD parameters and the methanol elimination T1/2. This is in contrast to what was previously reported and theoretically expected.16, 17 This is potentially explained by a lack of variability in the delivered blood flow in all subjects (>350 ml/min), a standard and a constant dialysate flow of 750 ml/min, and minute differences in the surface area of dialysis membrane (all above 2.0 m2). Had these differences in HD parameters been greater within our cohort, it would have been possible to see the relationship between HD parameters and T1/2.17 In the 71 episodes of MPs in our study, only 4 episodes (6%) were excluded because of low and variable blood flow during HD. Therefore, high-efficiency HD was possible for 94% of the episodes, supporting that our findings can have an impact on the management of the majority of MP, when HD is indicated.5, 9
In Canada, most cases of MP result from an acute intentional ingestion. The demographic characteristics, prognostic factors, and outcomes of patients treated for MP in large outbreaks are mainly derived from unintentional exposure. In these conditions, the mortality rate has been reported to be as high as 34%.18, 19, 20, 21 However, there is little data available on the clinical characteristics and the outcome of patients with MP in the context of intentional MP. Generally, our cases consulted earlier and they were less acidotic at presentation as compared with what is generally reported in series of unintentional MP.18, 19, 20, 21, 22, 23, 24, 25 In our cohort, only one patient died and four patients had persistent visual abnormalities. The better prognosis of our cohort could also be explained by an unhindered access to ADH inhibitors and easier access to HD centers, which may be overwhelmed in epidemics.18, 19, 20, 21, 22, 23, 24, 25
In the event of a late presentation, most of the methanol may have already been metabolized to formic acid and the interpretation of the osmolal gap and methanol concentration alone may therefore underestimate the severity of the intoxication. In our study, there was no measurement of formic acid. Formic acid is a small molecule (46 Da) with small volume of distribution (0.5 l/kg) and no protein binding. Contrary to methanol, which has a long elimination T1/2 under ADH inhibition, formic acid has a much shorter elimination T1/2. Hantson et al.26 examined the elimination T1/2 of formic acid before, during, and after HD and showed elimination T1/2 of 6.0±3.3, 1.8±0.8, and 3.9±2.0 h, respectively. They also reported that formate clearance by HD was 176±43 ml/min. However, none of the HD parameters of these subjects were reported.26 In the study presented by Zakharov et al.,16 where a detailed description of HD parameters was available, the T1/2 of formate was 1.6±0.4 h, nearly half of the reported methanol elimination T1/2 (3.7±1.4 h).16
Strengths and limitations
To our knowledge, this is the largest reported cohort of intentional MP, with detailed clinical characterization and kinetic analysis. This study's proposed approach to predict HD duration has several strengths and advantages. First, it relies on the determination of methanol elimination T1/2, which is intuitive to clinicians. Second, the prediction model has been created using a relatively large training and validation sets of data. Its reliability has been tested using bootstrap and leave-one-out cross-validation, further strengthening the consistency and safety of the model. Third, because of delays in obtaining methanol concentrations during HD, our data suggest that the delivered HD time is ~3 h longer than what is required to reach a safe level of 6 mmol/l. Even in our center where methanol concentrations are relatively easy to obtain, the proposed approach, even though conservative, still allowed to reduce the HD duration as compared with the conventional method of methanol monitoring in our validation set. The study therefore provides valuable information for safe management of patients and responsible allocation of scarce resources. Finally, our prediction model may be particularly useful when methanol monitoring cannot be performed in a timely manner.
The study also has the inherent limitations of a retrospective study. Although data were available for the majority of the patients, the long-term outcome of patients could not be assessed. The proposed model is only applicable for HD (not continuous forms of renal replacement therapy) when a constant blood flow of >350 ml/min and high-efficiency large (>2 m2) dialyzers are used. As we selected the 90th percentile of methanol elimination T1/2, there was a small likelihood of under-dialysis, but this was compensated by targeting a lower methanol concentration of 4 mmol/l in our model. It should be noted that, in this cohort, early consultation after consumption of methanol resulted in a small percentage of overtly acidotic patients. As formic acid measurements are not accessible in most hospitals, it is also recommended to monitor the acid–base status during HD. Finally, as all patients were adults, our findings cannot be generalized to the pediatric population.
CONCLUSION
In the context of high-efficiency HD, our proposed prediction model, which is based on the 90th percentile of the methanol elimination T1/2 and a target methanol concentration of 4 mmol/l, resulted in a safe methanol concentration of below 6 mmol/l in all subjects.
MATERIALS AND METHODS
Study design
This is a retrospective single-center study conducted at CHU de Québec-Hôtel Dieu de Québec Hospital (Quebec City, Canada). All adult cases of MP who were referred for HD from December 1997 to June 2013, and had baseline methanol levels of >10 mmol/l, were eligible. To determine the outcome of our cohort, all eligible cases of MP treated by HD were included in the analysis. Demographic characteristics and medical history were extracted from medical files. Initial biochemical and acid–base status as well as initial clinical status and evolution were also recorded. Clinical parameters of interest at initial presentation were (a) decreased level of consciousness defined as a Glasgow score <8, (b) severe hypotension defined as the need for inotropic/vasopressor support, (c) need for intubation, and (d) patient-reported visual abnormality. Clinical outcomes following dialysis such as death, infection, reported sight loss by the patient, the presence of neurological deficit, and the duration of intensive care unit stay were recorded.
Treatment protocol
Indications for HD were as follows: significant metabolic acidosis (pH <7.25–7.30), visual abnormalities, deteriorating vital signs despite intensive supportive care, electrolyte imbalance unresponsive to conventional therapy, or a serum methanol concentration >15.6 mmol/l (50 mg/dl) as recommended.8, 9 Prescribed dialysis parameters were blood flow of 350–400 ml/min, dialysate flow of 750 ml/min, the use of high-efficiency filters with mass transfer-area coefficient (KoA) >600, and membrane surface areas of 2.0–2.2 m2 using the following filters: Polyflux 21 l (n=25), DICEA210 (n=20), Optiflux F20 (n=14), Nephral 500 (n=5), Exeltra 210 (n=3), Xenium H21 (n=2), and Evodial 2.2 (n=2). Treatment was performed using a dual lumen catheter inserted in the internal jugular or femoral veins. Ethanol- (~20 mmol/l) and phosphate-enriched (1 mmol/l) dialysate with a bicarbonate concentration of 30–38 mmol/l was used for all patients (except when fomepizole was used during HD). All patients received heparin 1000–1500 IU as bolus and 500–1000 IU/h during HD session. During HD, the interval of serial measurements of methanol concentrations was prescribed according to the treating physician. HD was discontinued when a safe concentration of methanol (<6 mmol/l) was achieved and acid–base balance was restored. Methanol concentration was determined using a kinetic enzymatic method based on Alcohol Oxidase.
Alcohol dehydrogenase inhibition was performed with either ethanol, fomepizole, or a combination of both. The initial dose and perfusion rate of ethanol were administered according to the recommended protocol.8 Target serum ethanol levels ranged from 20 to 30 mmol/l, and the perfusion was adjusted to maintain this target before and throughout the dialysis session. When fomepizole was used before HD, it was given at a dose of 15 mg/kg with repeated administration of 10 mg/kg every 12 h up to the initiation of dialysis and then after every 4 hours during HD, as recommended.8 In case of fomepizole treatment, an ethanol-free dialysate was used during HD. Every patient was also treated with folinic acid (50 mg every 6 h).
Kinetic modeling and methanol elimination T1/2
To ensure a reliable determination of T1/2, we excluded MP episodes where less than three measurements of methanol concentration were performed during HD (n= 11). Further, to ensure that only high-efficiency HD was studied, we excluded cases with suboptimal blood flow (<350 ml/min, n=4). All HD sessions were performed with high-efficiency filters with a surface area >2.0 m2 and a dialysate flow of 750 ml/min. A total of 56 episodes of MP were available for kinetic modeling, but 10 were excluded for repeated episodes of MP (Figure 1). Methanol elimination T1/2 for each individual episodes of MP was calculated using serum methanol concentrations during HD and plotted through a one-phase decay exponential regression analysis. The median R2 for each T1/2 determination was 0.99 (ranging from 0.94 to 1.00), therefore establishing the robustness of the kinetic modeling for each episode of MP.
Modeling of HD duration in a training set
To avoid selection bias and ensure the independence of observation, the first MP episode, stratified for gender and excluding repeated MP of 28 patients (19 male), was used to construct a new model to predict the optimal HD duration to achieve a calculated safe methanol concentration of <6 mmol/l.
Individual modeling of HD time to a safe methanol concentration of 6 mmol/l was obtained using each individual's elimination T1/2 by the following formula:
 |
where k is the corresponding constant rate to the individual's T1/2 (i.e., Ln(2)/T1/2), MCi is the initial methanol concentration (mmol/l), and 6 is the safe level of methanol in mmol/l.
Specified percentile modeling of HD time was performed using median, 75th and 90th percentiles of gender-specific T1/2 and by sequentially targeting a final methanol concentration of 6, 5, 4, 3, and 2 mmol/l, using the following formula:
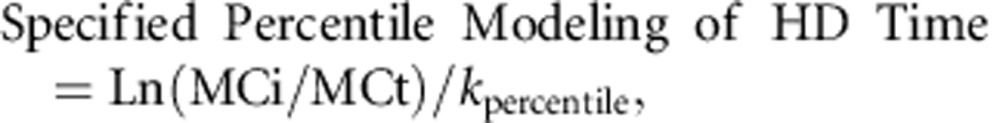 |
where kpercentile is the corresponding constant rate to the specified percentile T1/2 (i.e., Ln(2)/T1/2 percentile), MCi is the initial methanol concentration (mmol/l), and MCt is the target methanol concentration (mmol/l). The Supplementary Tables S1–S3 allow to see that the 90th percentile T1/2 and a target methanol concentration of 4 mmol/l predicted a safe methanol level of <6 mmol/l for all patients (number of patients with methanol >6 mmol/l is 0 (95% CI:0–0) using the bootstrapping method).
On the basis of these results, we proposed the gender-specific 90th percentile modeling HD time to achieve a target methanol of 4 mmol/l by the following formula:
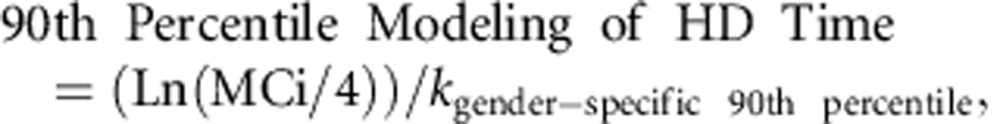 |
where MCi is the initial methanol concentration and k gender-specific 90th percentile corresponds to the Ln(2)/gender-specific 90th percentile T1/2 of 141 and 147 min, respectively, for women and men.
Validation set
To validate our prediction model in an independent set of subjects, we examined the impact of the 90th percentile modeling of HD time on its capacity to achieve a safe level of methanol concentration in the remaining cases of MP.
Statistical analysis
Data are presented as median (25th, 75th percentile) or mean (95% CIs) for continuous variable and number (percentage) for categorical variable. Student's t-test was used to compare quantitative variables between the two groups. As a subject could have had more than one episode of MP requiring HD, we only included the data of the first intoxication episode for each subject (n=46) for the following analyses. A one-phase decay robust exponential regression analysis with a robust fitting method and a plateau constrain to a value of >0 was used to determine T1/2 for each patient (Prism 6.0). To study the determinants of methanol T1/2 during HD, we used a multiple linear regression analysis. We used age, gender, weight, initial methanol concentration, delivered dialysis blood flow, type of filter, and type of ADH inhibition as potential explanatory variables for the variability that was detected in the methanol elimination T1/2. A thousand bootstrap samples, stratified by gender, were generated from the training and validation data sets. Gender-specific T1/2 50th, 75th, and 90th percentiles, the mean of individual modeling of HD time, specified percentile modeling of HD time sequentially targeting the final methanol level of 6, 5, 4, 3, 2 mmol/l, residual methanol concentration, and the proportion of patients with residual methanol concentration >6 mmol/l were calculated in each of the bootstrap sample. The 95% bootstrap confidence intervals were obtained using the 2.5th and 97.5th percentiles of each variable. As part of the sensitivity analysis, we performed leave-one-out cross-validation. Statistical analyses were performed with SAS, version 9.3 (SAS Institute, Cary, NC, USA). A P-value <0.05 was considered significant.
Acknowledgments
SADeS holds a Kidney Research Scientist Core Education and National Training Program (KRESCENT) scholarship supported by Canadian Institute of Health Research, Kidney Foundation of Canada, Canadian Society of Nephrology and from Fonds de Recherche du Québec—Santé (FRQ-S). MA holds a scholarship from FRQ-S, and a research chair in nephrology from Université Laval. The results of this study were presented in part at the ASN 2014 meeting and the ERA-EDTA 52nd congress.
All the authors declared no competing interests.
Footnotes
Table S1. The 90th percentile T½ modeling for various targets of residual methanol concentration.
Table S2. The 75th percentile T½ modeling for various targets of residual methanol concentration.
Table S3. The 50th percentile T½ modeling for various targets of residual methanol concentration.
Table S4. Leave-one-out cross-validation using various half-life percentiles and target methanol concentrations.
Supplementary material is linked to the online version of the paper at http://www.nature.com/ki
Supplementary Material
References
- 1Becker CE. Methanol poisoning. J Emerg Med 1983; 1: 51–58. [DOI] [PubMed] [Google Scholar]
- 2Methanol poisoning. Lancet 1978; 2: 510–511. [PubMed] [Google Scholar]
- 3Bennett IL Jr, Nation TC, Olley JF. Pancreatitis in methyl alcohol poisoning. J Lab Clin Med 1952; 40: 405–400. [PubMed] [Google Scholar]
- 4Gonda A, Gault H, Churchill D et al. Hemodialysis for methanol intoxication. Am J Med 1978; 64: 749–758. [DOI] [PubMed] [Google Scholar]
- 5Ghannoum M, Hoffman RS, Mowry JB et al. Trends in toxic alcohol exposures in the United States from 2000 to 2013: a focus on the use of antidotes and extracorporeal treatments. Semin Dial 2014; 27: 395–401. [DOI] [PubMed] [Google Scholar]
- 6Pappas SC, Silverman M. Treatment of methanol poisoning with ethanol and hemodialysis. Can Med Assoc J 1982; 126: 1391–1394. [PMC free article] [PubMed] [Google Scholar]
- 7McCoy HG, Cipolle RJ, Ehlers SM et al. Severe methanol poisoning. Application of a pharmacokinetic model for ethanol therapy and hemodialysis. Am J Med 1979; 67: 804–807. [DOI] [PubMed] [Google Scholar]
- 8Barceloux DG, Bond GR, Krenzelok EP et al. American Academy of Clinical Toxicology practice guidelines on the treatment of methanol poisoning. J Toxicol Clin Toxicol 2002; 40: 415–446. [DOI] [PubMed] [Google Scholar]
- 9Roberts DM, Yates C, Megarbane B et al. recommendations for the role of extracorporeal treatments in the management of acute methanol poisoning: a systematic review and consensus statement. Crit Care Med 2014; 43: 461–472. [DOI] [PubMed] [Google Scholar]
- 10Hirsch DJ, Jindal KK, Wong P et al. A simple method to estimate the required dialysis time for cases of alcohol poisoning. Kidney Int 2001; 60: 2021–2024. [DOI] [PubMed] [Google Scholar]
- 11Watson PE, Watson ID, Batt RD. Total body water volumes for adult males and females estimated from simple anthropometric measurements. Am J Clin Nutr 1980; 33: 27–39. [DOI] [PubMed] [Google Scholar]
- 12Youssef GM, Hirsch DJ. Validation of a method to predict required dialysis time for cases of methanol and ethylene glycol poisoning. Am J Kidney Dis 2005; 46: 509–511. [DOI] [PubMed] [Google Scholar]
- 13Jacobsen D, McMartin KE. Methanol and ethylene glycol poisonings. Mechanism of toxicity, clinical course, diagnosis and treatment. Med Toxicol 1986; 1: 309–334. [DOI] [PubMed] [Google Scholar]
- 14Jacobsen D, Webb R, Collins TD et al. Methanol and formate kinetics in late diagnosed methanol intoxication. Med Toxicol Adverse Drug Exp 1988; 3: 418–423. [DOI] [PubMed] [Google Scholar]
- 15Brent J, McMartin K, Phillips S et al. Fomepizole for the treatment of methanol poisoning. N Engl J Med 2001; 344: 424–429. [DOI] [PubMed] [Google Scholar]
- 16Zakharov S, Pelclova D, Navratil T et al. Intermittent hemodialysis is superior to continuous veno-venous hemodialysis/hemodiafiltration to eliminate methanol and formate during treatment for methanol poisoning. Kidney Int 2014; 86: 199–207. [DOI] [PMC free article] [PubMed] [Google Scholar]
- 17Bouchard J, Roberts DM, Roy L et al. Principles and operational parameters to optimize poison removal with extracorporeal treatments. Semin Dial 2014; 27: 371–380. [DOI] [PubMed] [Google Scholar]
- 18Shah S, Pandey V, Thakore N et al. Study of 63 cases of methyl alcohol poisoning (hooch tragedy in Ahmedabad). J Assoc Physicians India 2012; 60: 34–36. [PubMed] [Google Scholar]
- 19Shadnia S, Rahimi M, Soltaninejad K et al. Role of clinical and paraclinical manifestations of methanol poisoning in outcome prediction. J Res Med Sci 2013; 18: 865–869. [PMC free article] [PubMed] [Google Scholar]
- 20Massoumi G, Saberi K, Eizadi-Mood N et al. Methanol poisoning in Iran, from 2000 to 2009. Drug Chem Toxicol 2012; 35: 330–333. [DOI] [PubMed] [Google Scholar]
- 21Brahmi N, Blel Y, Abidi N et al. Methanol poisoning in Tunisia: report of 16 cases. Clin Toxicol (Phila) 2007; 45: 717–720. [DOI] [PubMed] [Google Scholar]
- 22Coulter CV, Farquhar SE, McSherry CM et al. Methanol and ethylene glycol acute poisonings—predictors of mortality. Clin Toxicol (Phila) 2011; 49: 900–906. [DOI] [PubMed] [Google Scholar]
- 23Sanaei-Zadeh H. Response to ‘Methanol and ethylene glycol acute poisonings—predictors of mortality'. Clin Toxicol (Phila) 2012; 50: 225; author reply 226. [DOI] [PubMed] [Google Scholar]
- 24Lee CY, Chang EK, Lin JL et al. Risk factors for mortality in Asian Taiwanese patients with methanol poisoning. Ther Clin Risk Manag 2014; 10: 61–67. [DOI] [PMC free article] [PubMed] [Google Scholar]
- 25Hassanian-Moghaddam H, Nikfarjam A, Mirafzal A et al. Methanol mass poisoning in Iran: role of case finding in outbreak management. J Public Health 2014; 37: 354–359. [DOI] [PubMed] [Google Scholar]
- 26Hantson P, Haufroid V, Wallemacq P. Formate kinetics in methanol poisoning. Human Exp Toxicol 2005; 24: 55–59. [DOI] [PubMed] [Google Scholar]
Associated Data
This section collects any data citations, data availability statements, or supplementary materials included in this article.