Abstract
Online hemodiafiltration (OL-HDF), the most efficient renal replacement therapy, enables enhanced removal of small and large uremic toxins by combining diffusive and convective solute transport. Randomized controlled trials on prevalent chronic kidney disease (CKD) patients showed improved patient survival with high-volume OL-HDF, underlining the effect of convection volume (CV). This retrospective international study was conducted in a large cohort of incident CKD patients to determine the CV threshold and range associated with survival advantage. Data were extracted from a cohort of adult CKD patients treated by post-dilution OL-HDF over a 101-month period. In total, 2293 patients with a minimum of 2 years of follow-up were analyzed using advanced statistical tools, including cubic spline analyses for determination of the CV range over which a survival increase was observed. The relative survival rate of OL-HDF patients, adjusted for age, gender, comorbidities, vascular access, albumin, C-reactive protein, and dialysis dose, was found to increase at about 55 l/week of CV and to stay increased up to about 75 l/week. Similar analysis of pre-dialysis β2-microglobin (marker of middle-molecule uremic toxins) concentrations found a nearly linear decrease in marker concentration as CV increased from 40 to 75 l/week. Analysis of log C-reactive protein levels showed a decrease over the same CV range. Thus, a convection dose target based on convection volume should be considered and needs to be confirmed by prospective trials as a new determinant of dialysis adequacy.
Keywords: convection volume, hemodiafiltration, hemodialysis, high volume, survival
Online hemodiafiltration (OL-HDF) is recognized as the most efficient renal replacement treatment modality for end-stage chronic kidney disease (CKD) patients.1 By combining diffusive and convective solute removal principles, uremic blood is cleansed of both small and large uremic toxins that accumulate during CKD.2 The scientific validity, safety, and clinical benefits of OL-HDF over conventional hemodialysis (HD) have been supported by several clinical investigations. However, the findings of recent randomized controlled trials (RCTs) have renewed interest in improved patient survival attributed to high-volume OL-HDF and given rise to the concept of a convection volume-dependent improvement of survival rates in prevalent end-stage kidney disease (ESKD) patients.3
The hypothesis is supported by four recent studies indicating that the observed reduction in mortality associated with OL-HDF correlates with the convection volumes achieved during therapy. The Dialysis Outcomes and Practice Patterns Study (DOPPS), an observational study involving 2165 patients, was the first to identify the role of convection volume in patient outcome.4 This study showed that 15-25 l of substitution volume per session (not including weight loss for extracellular fluid control) resulted in a 35% reduction in mortality with high-efficiency OL-HDF relative to low-flux HD (LF-HD).4 Although the CONTRAST Study, an RCT involving 714 patients, was not able to prove the superiority of OL-HDF over conventional LF-HD in its primary end point of mortality, post hoc analysis identified that larger volumes of convection fluid were associated with a significant reduction in all-cause and cardiovascular mortality.5 The Turkish HDF Study, another RCT involving 782 patients, analyzed survival rates for OL-HDF versus high-flux HD (HF-HD);6 again, no significant differences in primary end points were observed, but post hoc analysis indicated significantly reduced mortality in the subgroup of patients receiving the largest substitution volumes (>17.4 l/session). Finally, the ESHOL Study, a prospective RCT comparing post-dilution OL-HDF with HF-HD involving 906 prevalent patients, reported a 30% reduction in all-cause mortality, 33% in cardiovascular mortality, and 61% risk reduction in mortality from stroke. Interestingly, in this study a mean delivered convection volume of 23.7 l/session was required to achieve the reduction in mortality.7 Significantly, this study implemented best clinical practices and coached participating centers before launching the study to ensure delivery of target substitution volumes to patients. It is noteworthy that all four studies involved prevalent dialysis patients with different dialysis vintages and this may have affected the outcomes.
In routine clinical practice, a number of approaches can be undertaken to enhance the convection volume achieved during each OL-HDF session. The determinants of convection volume can be categorized in terms of patient-, prescription-, and technology-related factors.8 However, from a clinical perspective, the fundamental issue is to ascertain the optimal total ultrafiltration volume or convection volume that needs to be delivered to derive the maximal survival benefit for patients on OL-HDF. Once this target threshold convection volume has been determined, other patient-specific strategies that take uremic toxicity and the comorbid conditions of CKD patients into account could be developed to improve outcome. Considering this background and the clinical need to optimize renal replacement therapy prescription, we examined a large incident dialysis population with the objective to ascertain the threshold of convection volume that needs to be achieved to maximize relative survival. Convection volume was defined according to the EUDIAL recommendations as the total ultrafiltration volume obtained over the entire HDF session, i.e., the sum of the substitution volume and the intradialytic weight loss achieved to correct extracellular fluid overload.9 An incident dialysis population was selected for two reasons, first to reduce exposure time to chronic uremic complications and dialysis side effects, and second, to exploit the potential capacity of HDF to reduce early dialysis mortality.
RESULTS
Demographic, clinical, and biochemical characteristics of the study population are shown in Table 1. At baseline, mean age was 67±15 years and 63% were male. Regarding comorbidities, 30% had diabetes, 16% congestive heart failure, 13% peripheral vascular disease, and 13% ischemic cerebrovascular disease.
Table 1. Baseline patient characteristics.
| Variable | OL-HDF |
|---|---|
| Age (years; mean, s.d.) | 66.7±14.7 |
| Gender (male; %) | 63 |
| Height (cm; mean, s.d.) | 163.8±9.5 |
| Pre-dialysis weight (kg; mean, s.d.) | 72.6±15.7 |
| Pre-dialysis systolic blood pressure (mmHg; mean, s.d.) | 142.2±24.4 |
| Pre-dialysis diastolic blood pressure (mmHg; mean, s.d.) | 69.8±13.7 |
| Pre-dialysis heart rate (beats/min) | 73.8±11.2 |
| Renal disease | |
| Diabetes (%) | 30 |
| Hypertension (%) | 18 |
| Glomerulonephritis (%) | 9 |
| Urinary obstruction (%) | 1 |
| Polycystic (%) | 6 |
| Coronary artery disease (%) | 7 |
| Comorbidities | |
| Congestive heart failure (%) | 16 |
| Peripheral vascular disease (%) | 13 |
| Cerebrovascular disease (%) | 13 |
| Chronic pulmonary disease (%) | 9 |
| Tumor without metastasis (%) | 9 |
| Charlson Comorbidity Index (mean, s.d.) | 4.98±2.07 |
| Vascular access | |
| Fistula (N; %) | 2418 (66) |
| Catheters (N; %) | 952 (26) |
| Grafts (N; %) | 293 (8) |
| Laboratory values | |
| Hemoglobin (g/dl; mean, s.d.) | 10.15±1.29 |
| Albumin (g/dl; mean, s.d.) | 3.72±0.47 |
| Ferritin (ng/ml; median, IQR) | 205.05 (256.24) |
| Creatinine (mg/dl; mean, s.d.) | 6.3±2.04 |
| PTH (ng/l; median, IQR) | 261.5 (312.25) |
| Calcium (mg/dl; mean, s.d.) | 8.67±0.62 |
| Sodium (mmol/l; mean, s.d.) | 137.8±3.2 |
| Phosphate (mg/dl; mean, s.d.) | 4.55±1.12 |
| Potassium (mmol/l; mean, s.d.) | 4.87±0.66 |
| CRP (mg/l; median, IQR) | 7.19 (18.26) |
Abbreviations: CRP, C-reactive protein; IQR, interquartile range; OL-HDF, online hemodiafiltration; PTH, parathormone.
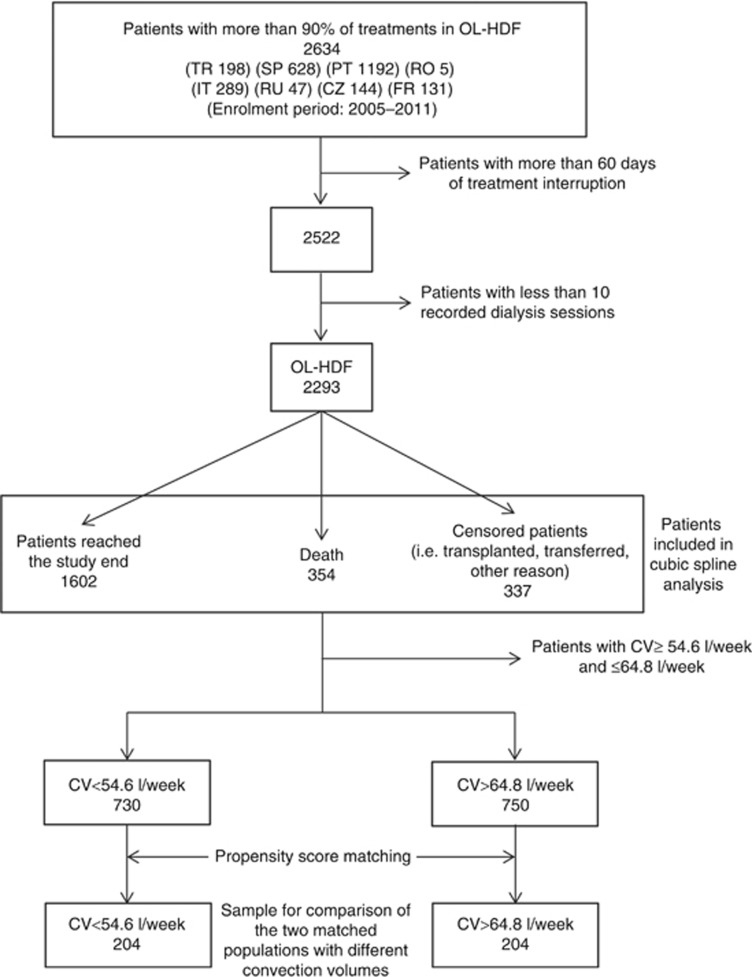
In total, 2293 patients meeting the predefined criteria completed the two-year follow-up period and thus comprised the study cohort. During the 2 years of follow-up, 354 deaths occurred, 337 patients were censored (29.4% transplanted, 43.6% transferred to another center and 27% lost to follow-up), and 1602 patients were alive 2 years after the enrolment period (January 2005 to May 2011, Figure 1).
Figure 1.
Flow chart of the study cohort.
In this patient cohort, propensity score matching (PSM) was applied to obtain two matched populations with different convection volumes (< 54.6 l/week and > 64.8 l/week). Table 2 shows patient characteristics of the matched patient groups after the application of PSM. A total of 408 matched patients remained with 31 deaths (32 censored) occurring in the first group (i.e., that with the low convection volume tertile; convection volume < 54.6 l/week) and 10 (17 censored) occurring in the second group (i.e., that with the high convection volume tertile; convection volume > 64.8 l/week). Therefore, the second group was associated with a significantly higher survival, the survival ratio (95% confidence interval (CI)) being 3.42 (1.68–6.98) (P<0.001).
Table 2. Patient characteristics for the matched populations.
| Variable | Lowest convection volume tertiles (<54.6 l/week) | Highest convection volume tertiles (>64.8 l/week) | P-value |
|---|---|---|---|
| Number of patients | 204 | 204 | |
| Age (years; mean±s.d.) | 63.3±14.6 | 64.6±14.5 | 0.36 |
| Gender (male; %) | 71 | 67 | 0.52 |
| Charlson Comorbidity Index | 4.5 | 4.7 | 0.33 |
| Vascular access | |||
| Fistula (%) | 78 | 84 | 0.15 |
| Catheter (%) | 10 | 8 | 0.42 |
| Graft (%) | 12 | 8 | 0.27 |
| CRP (mg/l; median, IQR) | 5.9 (14.8) | 7.3 (15.6) | 0.31 |
| Albumin (g/dl; mean±s.d.) | 3.7±0.5 | 3.7±0.5 | 0.34 |
| Kt/V (mean±s.d.) | 1.5±0.2 | 1.5±0.2 | 0.15 |
Abbreviations: CRP, C-reactive protein; IQR, interquartile range.
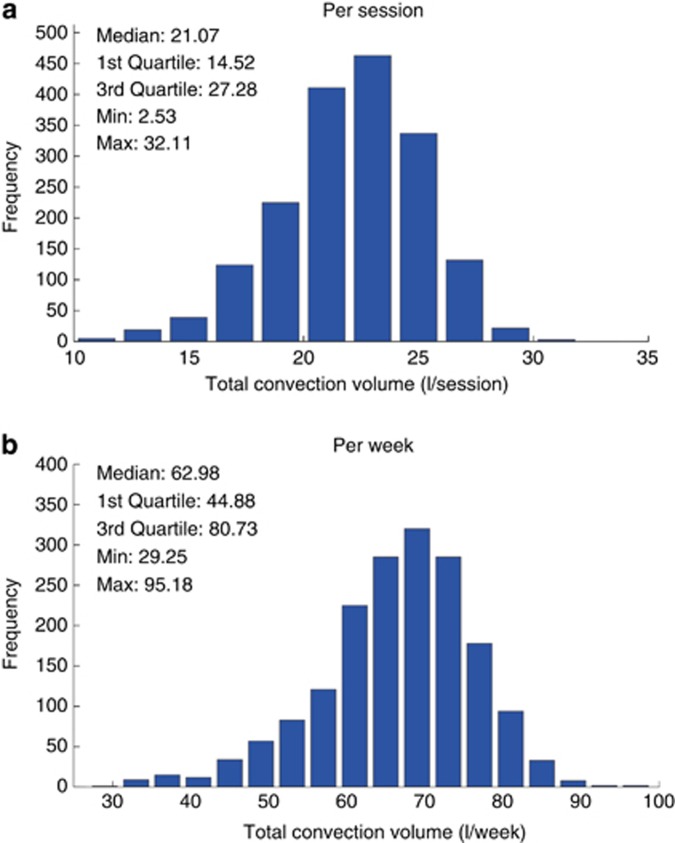
The main HDF treatment delivery characteristics are presented in Table 3. Histograms of the achieved convection volumes (i.e., the sum of the substitution volumes plus weight losses during treatment) are presented in Figure 2; the median convection volume was 21.07 l/session and 62.98 l/week.
Table 3. HDF treatment delivery characteristics.
| Parameter | Value |
|---|---|
| Treatment time per session (min; mean±s.d.) | 241.5±14.0 |
| Patients on thrice weekly treatments (%) | 96 |
| High-flux dialyzer (%) | 100 |
| Dialyzer surface (m2; mean±s.d.) | 1.54±0.20 |
| Effective blood flow (ml/min; mean±s.d.) | 404.9±69.4 |
| Effective dialysate flow (ml/min; mean±s.d.) | 506.1±53.6 |
| Post-dilution HDF (%) | 100% |
| Substitution flow (ml/min; mean±s.d.) | 91.4±13.6 |
| Substitution flow normalized to BSA (ml/min/m2, mean±s.d.) | 52.2±11.4 |
| Weight loss per session (kg; mean±s.d.) | 1.54±0.76 |
| Weight loss as percentage of dry body weight (kg; mean±s.d.) | 2.7±0.96 |
| Kt/V (mean±s.d.) | 1.53±0.23 |
Abbreviations: BSA, body surface area; HDF, hemodiafiltration.
Figure 2.
Distribution histogram of total convection volume (a) per session and (b) per week.
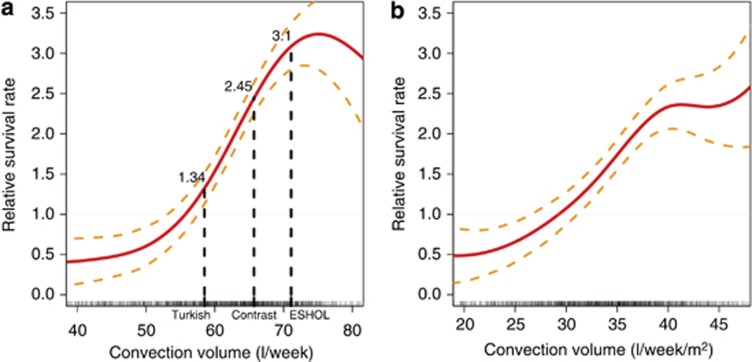
The association between weekly convection volume, considered as a continuous variable, and unadjusted relative survival rate at 2 years was analyzed and represented as cubic spline curves in Figure 3. Results are presented both in l/week and in l/week/m2 body surface area (BSA). As shown, the relative survival rate starts to increase at around 55 l/week (30 l/week/m2) and to plateau at 70–75 l/week (40–45 l/week/m2). For comparison, the relative survival rates according to the mean convection volumes achieved in the three main RCTs were indicated in the graph; the convection volumes reported in these studies are in alignment with the results of our cubic spline model analysis.
Figure 3.
Cubic spline analysis of relative survival rate (with 95% confidence interval) versus convection volume in (a) l/week and (b) l/week/m2 body surface area. The results of the three main randomized controlled trials are indicated in the graph.
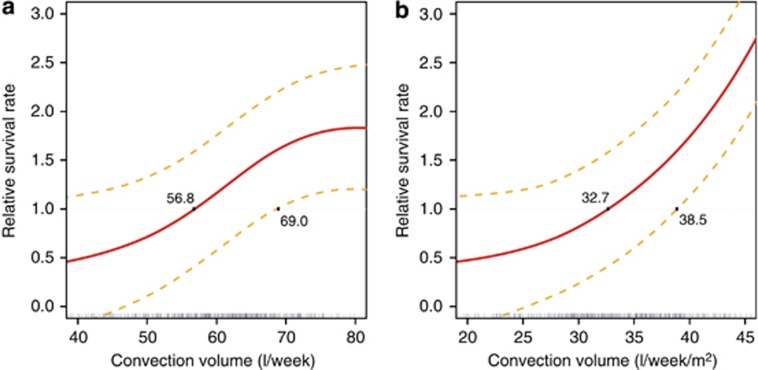
Weekly convection volume was then analyzed by cubic spline after adjustment for main confounding factors (age, gender, Charlson Comorbidity Index, vascular access, albumin, log C-reactive protein (CRP), and Kt/V) and presented in Figure 4. Above a weekly substitution volume of 70.1 L, the relative survival rate increased significantly (relative survival rate 1.64; 95% CI: 1–2.22). Interestingly, the adjusted model confirmed that relative survival rate begins to increase at 56.8 l/week (33 l/week/m2) and flattens off at ~75 l/week (45 l/week/m2) with a larger confidence interval.
Figure 4.
Cubic spline analysis of relative survival rate (with 95% confidence interval) versus convection volume adjusted for age, gender, Charlson Comorbidity Index, vascular access, albumin, log C-reactive protein, and Kt/V. (a) l/week. (b) l/week/m2 body surface area.
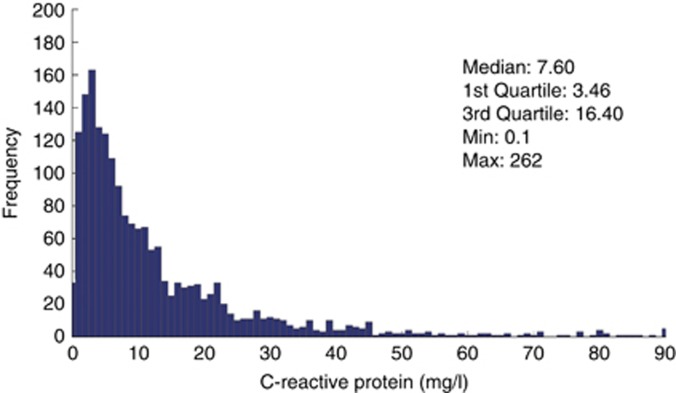
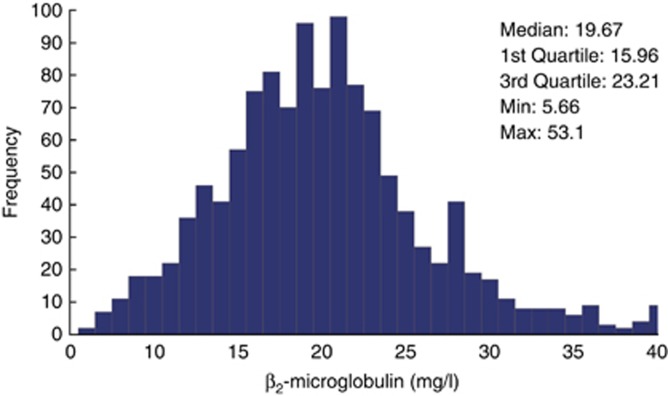
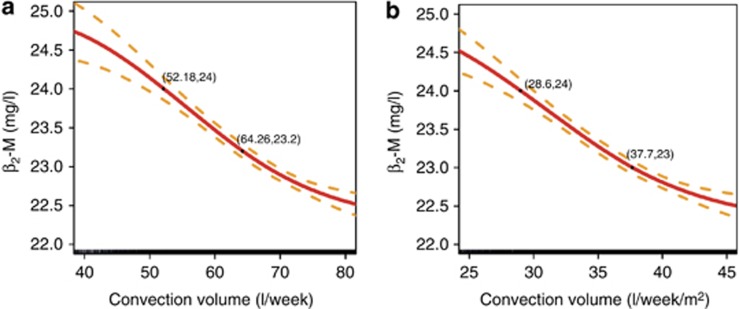
In addition to this analysis, two biomarkers were investigated, the C-reactive protein (CRP) concentrations as an indicator of inflammation and the pre-dialysis β2-microglobulin (ß2-M) concentrations as a marker of middle-molecule uremic toxins. Median pre-dialysis CRP and ß2-M values were 7.60 mg/l and 19.67 mg/l, respectively (Figures 5 and 6). Again, a cubic spline analysis was performed to evaluate pre-dialysis ß2-M concentrations as a function of total weekly convection volume. As shown in Figure 7, ß2-M concentrations decreased from 24.7 to 22.7 mg/l in an almost linear manner as weekly convection volume increased up to 75 l/week. On the basis of slope of this relationship, one can estimate that the ß2-M concentration is reduced by 0.6 mg/l per each 10 l of additional weekly convection volume. Note that 91% of patients had no diuresis and no significant residual kidney function after 6 months on dialysis, i.e., only anuric patients were considered for this analysis.
Figure 5.
Distribution histogram of pre-dialysis C-reactive protein values.
Figure 6.
Distribution histogram of pre-dialysis ß2-M concentrations.
Figure 7.
Cubic spline analysis of pre-dialysis ß2-M concentration (with 95% confidence interval) versus convection volume. (a) l/week. (b) l/week/m2 body surface area.
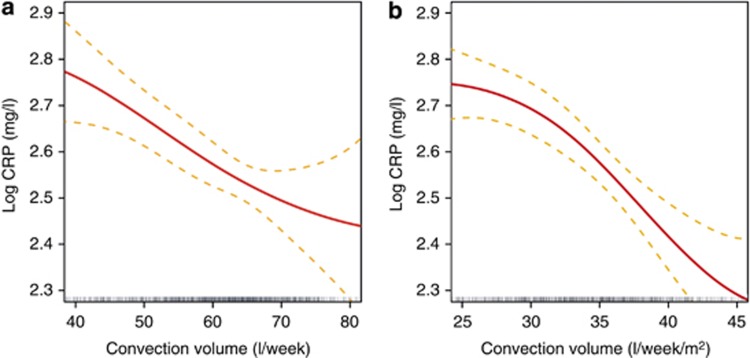
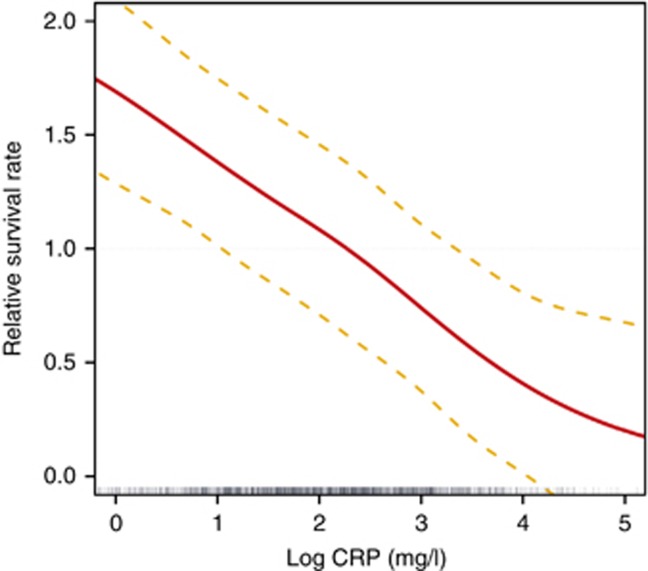
A similar cubic spline analysis was performed to evaluate CRP concentrations as function of convection volume (l/week) and to further analyze its association with relative survival rate. As shown in Figure 8, log CRP concentration decreased in a linear manner with an increase in convection volume up to ~75 l/week. Interestingly, as presented in Figure 9, relative survival rate improves with a linear decrease in log CRP levels adjusted for age, gender, Charlson Comorbidity Index, vascular access, albumin, and Kt/V.
Figure 8.
Cubic spline analysis of log C-reactive protein concentrations (with 95% confidence interval) versus convection volume adjusted for age, gender, Charlson Comorbidity Index, vascular access, albumin, and Kt/V. (a) l/week. (b) l/week/m2 body surface area.
Figure 9.
Cubic spline analysis of relative survival rate (with 95% confidence interval) versus log C-reactive protein values adjusted for age, gender, Charlson Comorbidity Index, vascular access, albumin, and Kt/V.
DISCUSSION
The cubic spline modeling approach was applied, for the first time, to analyze the convection volume delivered during OL-HDF therapy in association with increased patient survival. It enables determination of the minimum threshold convection dose delivered above which a patient survival benefit is observed. In the overall study population, the optimal convection dose was between 30 and 45 l/week/m2 BSA (55 to 75 l/week). After adjusting for age, gender, Charlson Comorbidity Index, vascular access, albumin, CRP, and Kt/V, the optimal convection dose associated with a significant improvement of patient outcomes remained almost identical, being between 32.7 and 45 l/week/m2 BSA (56.8 and 75 l/week). The relative survival gain is minimal above a convection dose of over 45 l/week/m2 (75 l/week), meaning that no additional outcome benefit could be expected at such very high convection volumes. This finding must nevertheless be considered with a degree of caution, as the number of patients achieving such very high ultrafiltration volume is quite limited and the analysis is not powered enough to explore this high convection volume region. In addition, it is important to note that this convection volume finding approach has only been evaluated in post-dilution OL-HDF mode, meaning that an appropriate dilution factor should be applied for all other substitution modalities (pre-dilution, mixed-dilution, and/or mid-dilution).9
Convection volume is essentially dependent on blood flow, type of vascular access, and treatment time.10 These factors have recently been recognized as being mainly dependent on local clinical practice patterns rather than on patient characteristics.11 Addressing this potential bias, we matched the populations with high and low convection volumes according to the patient characteristics, vascular access, treatment time, and blood flow. However, we cannot exclude that different European regions can be differently represented in terms of convection volume delivered.
A possible question arising from this new method of analysis is the capacity of the cubic spline model to detect the level of convection volume adequacy and how it compares with the standard Kt/V indicator. To elucidate this concern we proceeded in two ways. First, we conducted the same cubic spline analysis evaluating relative survival on different levels of Kt/V (data not shown); the pattern of the relationship with Kt/V was similar to that observed with convection volume and identified a minimum Kt/V threshold value of 1.4, confirming findings from previous cohort studies.12 Second, we adjusted the cubic spline analysis of relative survival rate for the main confounding factors (age, gender, Charlson Comorbidity Index, vascular access, albumin, and log CRP) and included the Kt/V (Figure 4). These two complementary analyses confirmed the high predictive value of our findings and support the concept that targeting an optimal convection volume is necessary for improving patient outcomes. In any case, achieving high convection volumes in HDF is associated with a 15 to 20% increase of Kt/V, confirming findings of previous RCT studies.5, 6, 7
It is noteworthy that the threshold volume of ~ 55 l/week determined by our analysis for convection volume adequacy is consistent with the results of three RCTs5, 6, 7 as well as another recent epidemiological study.13 Even the observational DOPPS publication actually referred to an almost equivalent substitution fluid dose (i.e., 15–24.9 l/session).4 Although the small sample size in the DOPPS study did not permit higher precision, it is interesting that the minimal threshold of convection dose was already described in the original paper in 2006.
The importance of the volume of substitution fluid as a measure of the convection dose was first indicated by Lornoy et al.,14 who demonstrated its linear relationship with the ß2-M reduction rate. Then, similar to Kt/V for small molecules, a denominator was sought to adjust the dose for body size or body surface area as a surrogate for patient metabolic characteristics. Several anthropometric parameters have been proposed,9 but Maduell et al.7 was unable to find a better fit than the simple substitution fluid volume or total convection volume. In our analysis, the adjusted BSA normalized results were very similar to the unadjusted BSA normalized results, but that could be due to the relative anthropometric homogeneity of the European population. Extrapolation to different ethnicities needs to be tested. In agreement with the association between ß2-M levels and survival as found by Cheung et al.,15 Figure 6 shows that pre-dialysis ß2-M concentrations would be easily maintained below 27.5 mg/l in patients on HDF, this being the threshold value for increased mortality risk in the HEMO study. In 1996, Locatelli et al.16 showed a difference in ß2-M in the range of 10 mg/l between LF-HD and HF-HD. Further differences between HF-HD and HDF were not found, but in those years the treatment was still delivered with bags and the substitution volume was significantly lower than today. According to our results (Figure 7), a further decrease in pre-dialysis ß2-M levels may be achieved by increasing the convection volume up to 45 l/week/m2 (75 l/week). On the basis of the convection-volume dependency relationship reported here, ß2-M concentrations would be reduced by 0.6 mg/l for every 10 l of additional convection volume per week. It is also shown that achieving mid-week pre-dialysis ß2-M concentrations lower than 25 mg/l is routinely feasible with high-volume OL-HDF.14, 17 It is thus tempting to speculate that maintaining ß2-M concentrations below 27.5 mg/l over a period of time may have contributed to the protective effects of OL-HDF, as suggested by the post hoc analysis of the HEMO Study.15 A recent study18 in non-dialysis CKD patient cohorts clearly identified that higher circulating ß2-M concentrations are associated with an increased risk of all-cause mortality, and also with an increased occurrence of severe or fatal cardiovascular events. In that study it is impressive that the threshold value of ß2-M concentration that was associated with a lower mortality risk was as low as 8.4 mg/l, meaning that reducing ß2-M concentration targets to as low as possible is likely to provide additional cardiovascular protective effects in dialysis patients. A recent randomized cross-over study19 exploring uremic toxin removal in conventional (4 h) and extended (8 h) HF-HD and HDF showed that pre-dialysis ß2-M levels concentrations could be stabilized around 20 mg/l by achieving a 85.5% reduction in ß2-M levels per HDF session.20
In addition, it is also interesting to note that the potential confounding role of residual kidney function could be ruled out in our study, as >90% of the incident patients studied had lost significant diuresis after 6 months. This clinical observation appears to be the likely consequence of a strict policy of extracellular fluid volume control implemented in our network following the findings of the Tassin study.21
A novel and interesting finding of our study is the inverse association relationship identified between convection volume and the inflammation status of the patients. As presented in Figure 8, log CRP decreases with increasing convection volume, at least up to ~ 45 l/week/m2 (75 l/week), even after adjustment for main confounding factors. It is of importance to note that this beneficial effect may also be related to the convection volume. In addition, the cubic spline analysis revealed that the relative survival rate is inversely associated with log CRP levels, with a threshold value of 10 mg/l (Figure 9).
As cubic spline analysis is based on a multiple polynomial structure, it allows the modeling of complex relative survival rate functions (as opposed to the classical Cox regression). This was fundamental to deriving an accurate approximation of the association between survival rate and convection volume and the relationship between convection volume and pre-dialysis ß2-M and CRP levels. To further enhance the independent and predictive value of convection volume on relative survival rate of incident dialysis patients, the cubic spline model analysis was adjusted for main confounding factors (age, gender, Charlson Comorbidity Index, vascular access, albumin, CRP, and Kt/V). A limitation of the performed analysis is that the convection volume for each patient is represented by the mean of all convection volumes delivered for the study period. However, the s.d. and the coefficient of variation of the convection volumes were 7.38 l/week and 0.11, respectively, indicating a quite homogeneous individual prescription and that the averaged values are quite representative of the delivered convection treatment. A further limitation is that the relatively limited number of patients does not allow a more precise estimation of the relative survival at high convection volumes.
In conclusion, convection dose is a strong determinant factor of survival of patients on OL-HDF. The original finding of this study is that improvement of relative survival rate has a convection volume dependency that is almost linear from 30 l/week/m2 (~ 55 l/week) to 45 l/week/m2 (75 l/week). Furthermore, we can speculate that early start of OL-HDF can be beneficial for reducing mortality of HD patients. Clinical practice should be tailored to target and achieve an optimal convection volume. The improvement in survival is linearly associated with a decrease of log CRP and ß2-M levels, suggesting that the observed benefit may be attributed predominantly to reducing inflammation and middle molecule elimination. We cannot exclude the possibility that a higher frequency and/or duration of treatment may have further impact on the convection volume results of our study, as our analysis was based mainly on a thrice weekly 4-hour treatment schedule. A convection dose target based either on convection volume or on pre-dialysis ß2-M concentrations should now be considered and confirmed as a new determinant of dialysis adequacy.
MATERIALS AND METHODS
In this retrospective observational study, data were extracted from a cohort of 2634 adult patients on in-center OL-HDF treatment in a large private dialysis network between January 1, 2005 and May 31, 2013. The participating countries were Czech Republic, France, Italy, Portugal, Romania, Russia, Spain, and Turkey. To select a dialysis population of incident patients (i.e., patients admitted to a participating clinic within 90 days of dialysis initiation) receiving uninterrupted OL-HDF treatment over the time of observation, different selection criteria were applied (see Figure 1). To assure exclusivity of HDF treatment, patients were excluded from the analysis when the percentage of HDF sessions over the entire period of treatment observation was <90%. To ensure that HDF treatment was delivered also in a continuous manner, patients with >60 days of treatment interruption (e.g., due to hospitalization, holidays) were excluded. Finally patients having <10 OL-HDF treatments during the observation period were also excluded because of insufficient data for analysis.
After application of the selection criteria, 2293 patients remained in the study. This group constituted the basis for the subsequent determination of the threshold of convection volume above which survival was increased.
HDF treatment prescription is sensitive to the total substitution volume delivered per session. This is a function of the instantaneous substitution flow and the duration of the session. Since January 2012, a substitution volume of 21 l/session has been specified as the target substitution volume throughout the clinic network; effective achievement is continuously monitored by the quality control system. The weight loss achieved by ultrafiltration corresponds to the interdialytic weight gain adjusted to the dry weight target. The total ultrafiltered volume or effective convection volume removed during the session is the sum of these two components, substitution volume and ultrafiltration weight loss. Main factors affecting HDF performance (e.g., blood flow, dialysate flow, treatment time, anticoagulation, manual or automatic ultrafiltration control by the HDF machine)10 are subject to regional or local practice patterns. Implementation of best practice guidelines within the network is supported by educational materials and local expertise.
All data were obtained using electronic medical records from the European Clinical Database (EuCliD) and were collected according to company standard clinical protocols and procedures.22 All patients consented that their data can be used in an anonymized form for scientific research. Collected variables included demographics, medical history, underlying renal disease, comorbidities, vascular access, treatment prescriptions, laboratory data, detailed records of each delivered dialysis treatment and events (hospitalizations, death and their causes). All blood samples for laboratory evaluations were taken at the mid-week session with the following frequencies: Kt/V monthly, CRP quarterly, and ß2-M every 6 months.
BSA was estimated according to the formula of Mosteller: BSA=([Height (cm) × Weight (kg)]/ 3600)(1/2). The not normally distributed variable CRP was log-transformed and considered as time averaged log CRP over the observation period. ß2-M was considered as single measurements.
Statistical analyses
To assess the association between convection volume and survival, PSM was applied. For the computation of PSM the variables that might influence convection volume and survival were considered. These included age, gender, Charlson Comorbidity Index, vascular access, albumin, CRP, and Kt/V. All these variables, except gender and vascular access, were allocated to four categories considering the quartiles of the distribution as thresholds.
All 2293 patients were considered for the selection of two matched populations based on PSM.23 Specifically, the lowest and highest achieved convection tertiles of average convection volume were used to define the two populations (54.6 l/week and 64.8 l/week, respectively) Using PSM, an adjusted population of 408 patients (41 deaths) was considered for survival rate computation based on a Cox regression model.24
All 2293 patients were also analyzed by cubic spline methodology to better understand the continuous relationship between convection volume and survival and to establish the threshold of the convection volume offering a significant survival benefit.
To define the threshold where convection volume begins to become beneficial, and to identify the limit at which no additional benefit can be detected, unadjusted and adjusted associations between convection volume and survival were estimated using multivariable Cox proportional hazards models combined with cubic spline analysis as described by Flythe et al.25 This approach is complementary to PSM: first, it provides a clue to understanding the continuous relationship between convection dose and survival; second, it strengthens the analysis since the whole patient cohort is used, and it accounts also for confounding effects through the adjustment for covariable predictors of mortality.26
The cubic spline model was also chosen as it is a flexible method that does not require a priori assumptions about the shape of the distribution characterizing the data set.27 The smoothness (data fitting) of the model can be easily controlled by means of the number of polynomials (number of knots) of the spline.
The first set of data used to perform the cubic spline analysis for convection volume was the entire population that had 2 years of follow-up. The first two cubic spline analyses (Figure 3) were non-adjusted and had four knots each, placed at 20, 40, 60, and 80 percentiles for convection volume (36.4, 54.2, 61.8, and 67.7 l/week, respectively) and of convection volume normalized to BSA (20.1, 29.6, 34.1, and 38.3 l/week/m2, respectively).
The second two cubic spline analyses (Figure 4) were adjusted for age, gender, Charlson Comorbidity Index, vascular access, albumin, log CRP, and Kt/V, and were designed in a similar manner as the non-adjusted curves. The 20, 40, 60, and 80 percentiles for convection volume were 47.9, 57, 62.6, and 67.8 l/week, respectively, and for the convection volume normalized for BSA they were 26.0, 30.9, 34.7, and 38.5 l/week/ m2, respectively.
Cubic spline analysis was also used to model the association of convection volume with pre-dialysis ß2-M (Figure 7) and log CRP (Figure 8) levels, whereby only the latter was adjusted for age, gender, Charlson Comorbidity Index, vascular access, albumin, and Kt/V. Both the splines have a single knot at the median of convection volume, 67.9 l/week for ß2-M and 60.2 l/week for CRP.
Convection volume was calculated either as total weekly convection volume or as weekly and normalized by BSA, always applying a three treatments per week factor.
A P-value of < 0.05 was considered as significant. All descriptive statistics were performed by Matlab 2013b software; cubic spline analysis was done using R 3.0.1.
Acknowledgments
We thank the medical and nursing staff of all NephroCare clinics for their diligence and attention to detail in addressing correctness and completeness of the treatment database.
All authors are employees of Fresenius Medical Care and may hold stock in the company.
Footnotes
Disclaimer
No external funding was received.
References
- 1Locatelli F, Canaud B. Dialysis adequacy today: a European perspective. Nephrol Dial Transplant 2012; 27: 3043–3048. [DOI] [PubMed] [Google Scholar]
- 2Thomas G, Jaber BL. Convective therapies for removal of middle molecular weight uremic toxins in end-stage renal disease: a review of the evidence. Semin Dial 2009; 22: 610–614. [DOI] [PubMed] [Google Scholar]
- 3Canaud B, Bowry SK. Emerging clinical evidence on online hemodiafiltration: does volume of ultrafiltration matter? Blood Purif 2013; 35: 55–62. [DOI] [PubMed] [Google Scholar]
- 4Canaud B, Bragg-Gresham JL, Marshall MR et al. Mortality risk for patients receiving hemodiafiltration versus hemodialysis: European results from the DOPPS. Kidney Int 2006; 69: 2087–2093. [DOI] [PubMed] [Google Scholar]
- 5Grooteman MP, van den Dorpel MA, Bots ML et al. Effect of online hemodiafiltration on all-cause mortality and cardiovascular outcomes. J Am Soc Nephrol 2012; 23: 1087–1096. [DOI] [PMC free article] [PubMed] [Google Scholar]
- 6Ok E, Asci G, Toz H et al. Mortality and cardiovascular events in online haemodiafiltration (OL-HDF) compared with high-flux dialysis: results from the Turkish OL-HDF Study. Nephrol Dial Transplant 2013; 28: 192–202. [DOI] [PubMed] [Google Scholar]
- 7Maduell F, Moreso F, Pons M et al. High-efficiency postdilution online hemodiafiltration reduces all-cause mortality in hemodialysis patients. J Am Soc Nephrol 2013; 24: 487–497. [DOI] [PMC free article] [PubMed] [Google Scholar]
- 8Bowry SK, Canaud B. Achieving high convective volumes in on-line hemodiafiltration. Blood Purif 2013; 35: 23–28. [DOI] [PubMed] [Google Scholar]
- 9Tattersall JE, Ward RA. Online haemodiafiltration: definition, dose quantification and safety revisited. Nephrol Dial Transplant 2013; 28: 542–550. [DOI] [PubMed] [Google Scholar]
- 10Marcelli D, Scholz C, Ponce P et al. High-volume postdilution hemodiafiltration is a feasible option in routine clinical practice. Artif Organs 2014; 39: 142–149. [DOI] [PMC free article] [PubMed] [Google Scholar]
- 11Chapdelaine I, Mostovaya IM, Blankestijn PJ et al. Treatment policy rather than patient characteristics determines convection volume in online post-dilution hemodiafiltration. Blood Purif 2014; 37: 229–237. [DOI] [PubMed] [Google Scholar]
- 12Miller JE, Kovesdy CP, Nissenson AR et al. Association of hemodialysis treatment time and dose with mortality and the role of race and sex. Am J Kidney Dis 2010; 55: 100–112. [DOI] [PMC free article] [PubMed] [Google Scholar]
- 13Imamovic G, Hrvacevic R, Kapun S et al. Survival of incident patients on high-volume online hemodiafiltration compared to low-volume online hemodiafiltration and high-flux hemodialysis. Int Urol Nephrol 2013; 46: 1191–1200. [DOI] [PubMed] [Google Scholar]
- 14Lornoy W, Becaus I, Billiouw JM et al. On-line haemodiafiltration. Remarkable removal of beta2-microglobulin. Long-term clinical observations. Nephrol Dial Transplant 2000; 15: 49–54. [DOI] [PubMed] [Google Scholar]
- 15Cheung AK, Rocco MV, Yan G et al. Serum beta-2 microglobulin levels predict mortality in dialysis patients: results of the HEMO study. J Am Soc Nephrol 2006; 17: 546–555. [DOI] [PubMed] [Google Scholar]
- 16Locatelli F, Mastrangelo F, Redaelli B et al. Effects of different membranes and dialysis technologies on patient treatment tolerance and nutritional parameters. The Italian Cooperative Dialysis Study Group. Kidney Int 1996; 50: 1293–1302. [DOI] [PubMed] [Google Scholar]
- 17Ward RA, Schmidt B, Hullin J et al. A comparison of on-line hemodiafiltration and high-flux hemodialysis: a prospective clinical study. J Am Soc Nephrol 2000; 11: 2344–2350. [DOI] [PubMed] [Google Scholar]
- 18Liabeuf S, Lenglet A, Desjardins L et al. Plasma beta-2 microglobulin is associated with cardiovascular disease in uremic patients. Kidney Int 2012; 82: 1297–1303. [DOI] [PubMed] [Google Scholar]
- 19Cornelis T, van der Sande FM, Eloot S et al. Acute hemodynamic response and uremic toxin removal in conventional and extended hemodialysis and hemodiafiltration: a randomized crossover study. Am J Kidney Dis 2014; 64: 247–256. [DOI] [PubMed] [Google Scholar]
- 20Canaud B, Bowry SK. Revisiting frontiers of tolerability and efficacy in renal replacement therapy. Am J Kidney Dis 2014; 64: 171–173. [DOI] [PubMed] [Google Scholar]
- 21Chazot C, Wabel P, Chamney P et al. Importance of normohydration for the long-term survival of haemodialysis patients. Nephrol Dial Transplant 2012; 27: 2404–2410. [DOI] [PubMed] [Google Scholar]
- 22Marcelli D, Kirchgessner J, Amato C et al. EuCliD (European Clinical Database): a database comparing different realities. J Nephrol 2001; 14: S94–100. [PubMed] [Google Scholar]
- 23Rosenbaum PR, Rubin DB. The central role of the propensity score in observational study for causal effects. Biometrika 1983; 70: 41–55. [Google Scholar]
- 24Cox DR. Regression models and life-tables. J R Stat Soc Series B 1972; 34: 187–220. [Google Scholar]
- 25Flythe JE, Kimmel SE, Brunelli SM. Rapid fluid removal during dialysis is associated with cardiovascular morbidity and mortality. Kidney Int 2011; 79: 250–257. [DOI] [PMC free article] [PubMed] [Google Scholar]
- 26Rosenberg PS. Hazard function estimation using B-splines. Biometrics 1995; 51: 874–887. [PubMed] [Google Scholar]
- 27Heinzl H, Kaider A. Gaining more flexibility in Cox proportional hazards regression models with cubic spline functions. Comput Methods Programs Biomed 1997; 54: 201–208. [DOI] [PubMed] [Google Scholar]


