

Background: Structural changes in the antithrombin reactive center loop P14 residue are thought to mediate heparin allosteric activation.
Results: P14 residue mutations produced antithrombin activating effects indicative of multiple allosteric activation states.
Conclusion: Heparin allosterically activates antithrombin by a minimal three-step mechanism involving intermediate and fully activated states.
Significance: New insights into the allosteric activation mechanism of a critical anticoagulant protein are gained.
Keywords: allosteric regulation, antithrombin (AT), coagulation factor, heparin, protease, protease inhibitor, serine protease, serpin, anticoagulant
Abstract
Past studies have suggested that a key feature of the mechanism of heparin allosteric activation of the anticoagulant serpin, antithrombin, is the release of the reactive center loop P14 residue from a native state stabilizing interaction with the hydrophobic core. However, more recent studies have indicated that this structural change plays a secondary role in the activation mechanism. To clarify this role, we expressed and characterized 15 antithrombin P14 variants. The variants exhibited basal reactivities with factors Xa and IXa, heparin affinities and thermal stabilities that were dramatically altered from wild type, consistent with the P14 mutations perturbing native state stability and shifting an allosteric equilibrium between native and activated states. Rapid kinetic studies confirmed that limiting rate constants for heparin allosteric activation of the mutants were altered in conjunction with the observed shifts of the allosteric equilibrium. However, correlations of the P14 mutations' effects on parameters reflecting the allosteric activation state of the serpin were inconsistent with a two-state model of allosteric activation and suggested multiple activated states. Together, these findings support a minimal three-state model of allosteric activation in which the P14 mutations perturb equilibria involving distinct native, intermediate, and fully activated states wherein the P14 residue retains an interaction with the hydrophobic core in the intermediate state but is released from the core in the fully activated state, and the bulk of allosteric activation has occurred in the intermediate.
Introduction
Antithrombin, a protein protease inhibitor of the serpin superfamily, together with the glycosaminoglycan activator, heparin, are essential anticoagulant regulators of blood coagulation proteases (1). The physiologic importance of antithrombin in regulating blood coagulation is well established from the elevated risk of thrombosis in humans with inherited or acquired deficiencies of the serpin (2) and by the embryonic lethality and coagulopathy of complete deficiency in mice (3) and zebrafish (4). Antithrombin is a slow inhibitor of its target proteases, mainly thrombin, factor Xa, and factor IXa, in the absence of heparin, whereas the serpin becomes a rapid inhibitor of these proteases in the presence of the glycosaminoglycan. Heparin activates antithrombin partly through an allosteric mechanism wherein activating conformational changes induced in the serpin by a sequence-specific heparin pentasaccharide enhance the inhibition of factors Xa and IXa several hundredfold, although these changes minimally affect thrombin inhibition (5, 6). Full-length heparin containing the pentasaccharide produces an additional activating effect through a heparin-bridging mechanism in which binding of both antithrombin and the target protease to the longer heparin chain promotes the inhibitor-protease interaction (7).
The mechanism of heparin allosteric activation has been the subject of extensive studies. X-ray structures of antithrombin in uncomplexed and heparin pentasaccharide complexed states have revealed that allosteric activation of antithrombin results in marked structural changes in the heparin-binding site and the reactive center loop (RCL)2 protease-binding site as well as global changes in the hydrophobic core. Notably, the RCL P14 residue3 is inserted into the center of β-sheet A as an additional short β-strand in the uncomplexed native state of the serpin and is expelled from sheet A in the heparin-complexed activated state. Mutagenesis studies (8, 9) and x-ray structures of heparin pentasaccharide-activated antithrombin complexes with catalytically disabled factor Xa (10) and factor IXa (11) have shown that allosteric activation is mediated by a common exosite outside the RCL whose engagement by RCL-bound factors Xa and IXa augments the protease interaction with the serpin and thereby enhances reactivity. Recent mutagenesis studies have shown that the exosite is accessible to RCL-bound proteases in the native structure despite RCL insertion into sheet A and contributes to the low antithrombin reactivity with these proteases in the native state (12).
That the RCL-sheet A interaction functions to maintain antithrombin in the native low reactivity state has been suggested by mutagenesis studies of the RCL P14 residue. Substitution of the wild-type P14 Ser with Trp (13), Cys derivatized with fluorescein (14), and Glu (15) result in partial or full activation of inhibitor reactivity with factor Xa, consistent with disruption of the RCL-sheet A interaction causing inhibitor activation. However, an x-ray structure of the fluorescein-derivatized variant revealed that the fluorescein substituent did not prevent the insertion of the RCL backbone into sheet A, but it did block side chain insertion and resulted in exposure of the fluorescein moiety on the sheet A surface (16). Such findings suggest a more complex role for the P14 residue in the activation mechanism.
Recent studies have proposed a revision of the allosteric activation mechanism wherein multiple activated states are involved (17–19), and RCL expulsion from sheet A is not the critical activating conformational change that greatly enhances inhibitor reactivity with factors Xa and IXa (12, 20). A particularly notable recent report showed that an antithrombin variant fully activated without the need for heparin nevertheless retained an intact RCL-sheet A interaction (21). In view of such findings, we were interested in clarifying the role of the RCL-sheet A interaction in the mechanism of heparin allosteric activation. We thus undertook saturation mutagenesis of the P14 residue and performed a comprehensive functional study of 15 P14 variants. Our findings support a minimal three-step model of allosteric activation in which P14 mutations perturb an allosteric equilibrium between a native and intermediate activated state that does not involve RCL expulsion from sheet A. Heparin binding induces the inhibitor to favor intermediate and fully activated states with RCL expulsion associated only with the latter state. Our findings are in keeping with the conformational changes induced in the intermediate activated state being principally responsible for enhancing antithrombin reactivity with factors Xa and IXa.
Experimental Procedures
Proteins
Recombinant antithrombin variants with mutations in the RCL P14 residue were engineered on an N135Q background to block glycosylation at Asn-135 and avoid heterogeneous glycoforms with variable heparin affinities (22). Mutations were introduced in the antithrombin cDNA cloned into the pFASTBac baculovirus plasmid (Invitrogen) by PCR using specifically designed oligonucleotides and the splicing-overlapping extension method as in previous studies (8). After confirming the mutations by DNA sequencing, Sf9 insect cells were transfected with bacmid vectors containing the mutant antithrombin cDNAs and the variants expressed as described previously (8, 9). Variants were purified from culture media by a combination of heparin affinity, ion exchange, and size exclusion chromatography, as described (8, 23). The concentration of antithrombin variants was measured from the absorbance at 280 nm using an extinction coefficient of 37,700 m−1 cm−1 (24) except for the P14 Trp variant for which a calculated value of 41,610 m−1 cm−1 was used (25).
Human α-thrombin was purchased from United States Biochemical Corp. (Cleveland, OH), and human factors Xa and IXa were obtained from Enzyme Research Labs (South Bend, IN). Active protease concentrations were determined from standard substrate assays that had been calibrated with active-site titrated enzymes as described (6, 26). A synthetic heparin pentasaccharide corresponding to the antithrombin-binding sequence in heparin was provided by Sanofi-Aventis (Toulouse, France). Full-length heparin (50-mer) containing the pentasaccharide-binding sequence was prepared by size exclusion and affinity fractionation of commercial heparin as described (23). Concentrations of heparins were obtained by stoichiometric binding titrations of plasma antithrombin with the polysaccharides monitored from the tryptophan fluorescence enhancement that reports binding as described (23).
SDS-PAGE
The purity of recombinant antithrombins and their ability to form SDS-stable complexes with proteases was evaluated by SDS-PAGE using 10% acrylamide gels and the Laemmli discontinuous buffer system (27).
Experimental Conditions
Experiments were performed at 25 °C in 20 mm sodium phosphate buffer, pH 7.4, containing 0.1 mm EDTA, 0.1% PEG 8000, and 0.1 m NaCl to achieve an ionic strength (I) of 0.15. Ionic strength was varied in some experiments by changing the NaCl concentration. Experiments with factor IXa employed a calcium buffer consisting of 100 mm Hepes, 93.5 mm NaCl, 5 mm CaCl2, 0.1% PEG 8000, pH 7.4, I 0.15.
Stoichiometry of Antithrombin-Protease Reactions
Stoichiometries of inhibition (SI) for variant antithrombin reactions with thrombin, factor Xa, and factor IXa in the absence and presence of pentasaccharide and full-length heparins were measured by incubating fixed concentrations of protease (1–100 nm) with increasing molar ratios of inhibitor to protease sufficient to inhibit >70% protease activity. When present, the heparin concentration was fixed at double the highest concentration of inhibitor. After allowing enough time for completion of the reaction based on measured inhibition rate constants, an aliquot of the reaction mixture was diluted into 1 ml of 100 μm chromogenic substrate (S2238 for thrombin (Chromogenix), Spectrozyme FXa for factor Xa (American Diagnostica), and Pefachrome FIXa for factor IXa (Centerchem)) containing 0.1 mg/ml Polybrene to neutralize heparin, and the residual enzymatic activity was measured from the initial linear rate of absorbance change at 405 nm. Assays of factor IXa activity were done in the Hepes buffer used for factor IXa experiments except that the CaCl2 concentration was increased to 10 mm, and 33% ethylene glycol was added to enhance factor IXa substrate reactivity (28). The decrease in residual protease activity with increasing molar ratio of antithrombin/protease was fit by linear regression analysis, and the stoichiometry was obtained from the abscissa intercept.
Kinetics of Antithrombin-Protease Reactions
Second order association rate constants (ka) for reactions of variant antithrombins with proteases in the absence or presence of heparin pentasaccharide or full-length heparin were measured under pseudo-first order conditions, i.e. employing inhibitor concentrations at least 5-fold greater than that required to fully inhibit protease based on measured values of inhibition stoichiometries. For most reactions performed in the absence of heparin or in the presence of heparin pentasaccharide levels that saturated antithrombin (2-fold molar excess over antithrombin) and for which ka <∼104 m−1 s−1, full reaction time courses (∼3 half-lives) of the loss of protease activity were acquired by sampling of reaction mixtures at varying incubation times and measuring residual protease activity as in determinations of inhibition stoichiometries. For reactions employing protease concentrations of <1 nm, a fluorogenic substrate (50 μm) was used to measure residual reactivity (tosyl-GPR-amido-4-methylcoumarin for thrombin (Sigma), t-butoxycarbonyl-IEGR-amido-4-methylcoumarin for factor Xa, and Pefafluor for factor IXa (Centerchem)) with hydrolysis of substrate monitored at λex 380 nm and λem 440 nm. The time-dependent losses in protease activity were fit by a single exponential function with a zero activity end point for thrombin and factor Xa reactions and nonzero end point for factor IXa reactions to account for a minor fraction of degraded protease resistant to antithrombin inhibition (6). The second order association rate constant was obtained by dividing the fitted pseudo-first order rate constant, kobs, by the antithrombin or antithrombin-heparin complex concentration (calculated based on measured KD values for the complex). Reactions of each variant were performed with two or more antithrombin concentrations to ensure a proportional relationship between kobs and the antithrombin or antithrombin-heparin complex concentration (23).
For faster reactions in the presence of heparin pentasaccharide or full-length heparin (ka>∼104 m−1 s−1), reactions were incubated for a fixed time, t, with increasing heparin concentrations. The loss of residual protease activity as a function of heparin concentration in this case conforms to a single exponential with kobs equal to ka × ([AT]0/(KAT, H + [AT]0)) × t, where [AT]o is the total antithrombin concentration and KAT, H is the dissociation constant for the antithrombin-heparin interaction under the conditions of measurement (8). The factor, [AT]0/(KAT, H + [AT]0), corrects for the fraction of added heparin that is complexed with antithrombin. Dividing by this factor and the fixed reaction time, t, then provides ka. Rate constants measured by this method employed at least two different fixed reaction times to ensure a proportional dependence of kobs on t.
Some reactions were also monitored continuously, again under pseudo-first order conditions employing at least two fixed antithrombin or antithrombin-heparin complex concentrations, by including a chromogenic or fluorogenic substrate in the reaction and following the exponential decrease in the rate of substrate hydrolysis to an end point (5–10 half-lives) (23). To ensure pseudo-first order conditions, only inhibitor concentrations that restricted substrate hydrolysis following complete reaction to under 10% were employed. kobs in this case requires correction for the competitive effect of substrate on the inhibition reaction. ka is thus obtained by dividing kobs by the antithrombin or antithrombin-heparin complex concentration and multiplying by the factor (1 + [S]0/Km), where [S]o is the substrate concentration and Km is the independently measured Michaelis constant for protease hydrolysis of the substrate.
Reaction of the antithrombin P14 Arg variant, which behaved exclusively as a protease substrate, with factor Xa was measured by monitoring RCL cleavage of the variant on a 10% SDS-polyacrylamide gel under reducing conditions, based on the loss of the C-terminal fragment of the serpin upon cleavage (14). A fixed concentration of the variant (∼700 nm) was incubated with increasing concentrations of factor Xa (0–25 nm) in the absence of heparin for 5 min followed by quenching with SDS buffer and boiling. After SDS-PAGE resolution of uncleaved and cleaved inhibitor bands, the bands were quantitated using Scion Image software (Scion Corp., Frederick, MD), and the disappearance of native antithrombin band intensity and the appearance of cleaved antithrombin band intensity were fit by single exponential curves as a function of the protease concentration. Dividing the fitted exponential rate constant by the fixed reaction time provided the kcat/Km for the substrate cleavage reaction based on the integrated Michaelis-Menten equation assuming a substrate concentration much less than Km.
Heparin Binding to Antithrombin Variants
Stoichiometries of heparin pentasaccharide binding to the antithrombin variants were measured in I 0.15, pH 7.4, sodium phosphate buffer (except for the P14 Val variant that employed the same buffer lacking NaCl) by titrations of 200 nm antithrombin with up to a 5-fold molar excess of the saccharide monitored by tryptophan fluorescence changes that report binding (λex 280 nm and λem 340 nm) using an SLM 8000 spectrofluorimeter. The antithrombin concentration employed in this case was at least 100 × KD to ensure stoichiometric binding. Fluorescence changes (corrected for buffer and dilution (<5%)) were fit by the quadratic binding Equation 1,
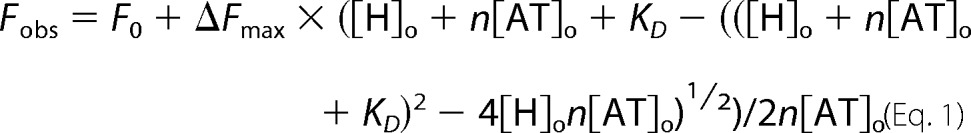 |
in which Fo is the initial fluorescence; Fobs is the observed fluorescence after each addition of titrant; ΔFmax is the maximal fluorescence change; [H]o and [AT]o are the total heparin and antithrombin concentrations, respectively, and n is the binding stoichiometry. KD was fixed at values estimated from extrapolations of binding measurements at higher ionic strengths (assuming n = 1) and n, Fo, ΔFmax fitted as parameters except for the Val variant in which KD was also fitted (23).
The affinities of heparin pentasaccharide for the antithrombin variants were quantitated by similar fluorescence titrations of 100–200 nm antithrombin with the pentasaccharide in sodium phosphate buffers of varying ionic strength ranging from 0.05 to 1. Pentasaccharide affinities for wild type, P14 Glu, and P14 Gln antithrombin variants were also measured in 20 mm TAPS buffer, pH 9.0, containing 0.1 mm EDTA, 0.1% PEG 8000, and NaCl concentrations in the range 0.15–0.75 m. Titrations were computer-fit by non-linear least squares regression to the quadratic equilibrium binding equation with stoichiometry fixed at the value determined from stoichiometric titrations and KD, Fo, and ΔFmax fitted as parameters. For the P14 Glu variant, which underwent minor tryptophan fluorescence changes upon heparin binding, binding was monitored by bound TNS fluorescence changes (λex 330 nm and λem 440 nm) (29) that were unaffected by the P14 Glu mutation with antithrombin and TNS present at 0.5 and 10 μm, respectively.
The relative heparin affinities of the antithrombin variants were also evaluated by FPLC based on the time of salt gradient elution of the bound proteins from a Hi-Trap heparin-agarose affinity matrix (5-ml column, GE Healthcare). Proteins (∼10 μg) were loaded onto the column equilibrated in I 0.15 sodium phosphate buffer, pH 7.4; the column washed for 15 min with this buffer and then eluted with a linear salt gradient up to 3 m NaCl over 45 min followed by washing with 3 m NaCl limit buffer for 10 min all at a flow-rate of 1 ml/min except for the last 5 min (2 ml/min). Protein peaks were detected by monitoring protein fluorescence (λex 280 nm and λem 340 nm).
Correlation of Antithrombin Variant Reactivities and Heparin Affinities
Correlations between antithrombin basal reactivities with factor Xa and IXa and antithrombin affinities for heparin were analyzed based on the two-state allosteric equilibrium model shown in Equation 2,
where AT and AT* represent native (N) and activated (A) conformational states, respectively. The fraction of antithrombin in the activated state, fA, is given by Equation 3,
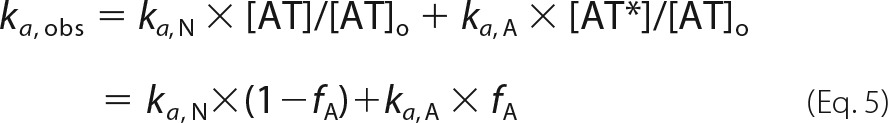
The observed pseudo-first order rate constant, kobs, for the basal reaction of antithrombin with factor Xa or with factor IXa in the absence of heparin can be expressed in terms of an observed second order association rate constant, ka, obs, as well as intrinsic second order association rate constants for reactions of native (ka, N) and activated (ka, A) antithrombin conformers as shown in Equation 4,
Solving for ka, obs gives Equation 5
 |
Solving for fA then gives Equation 6.
Binding of heparin to native and activated conformers of antithrombin can similarly be expressed in terms of an observed association equilibrium constant, KA, obs and intrinsic association equilibrium constants for native (KA, N) and activated (KA, A) conformers as shown in Equation 7,
 |
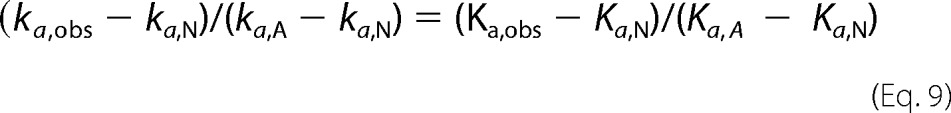
where [H], [AT.H], and [AT*.H] represent concentrations of free heparin, native antithrombin-heparin complex, and activated antithrombin-heparin complex, respectively. Solving for fA yields Equation 8,
Equating the two expressions for fA then gives Equation 9,
 |
When ka, A ≫ ka, N and Ka, A ≫ Ka, N, Equation 9 simplifies to Equation 10,
Fluorescence Spectra
Protein fluorescence spectra of antithrombin variants in the absence and presence of heparin pentasaccharide were acquired in sodium phosphate buffer, pH 7.4, I 0.15, 25 °C at wavelengths between 300 and 400 nm with the SLM 8000 spectrofluorimeter. Measurements were taken at two antithrombin concentrations (100 and 200 nm) every 5 nm with a 10-s integration time using excitation and emission bandwidths of 4 and 16 nm, respectively. Spectra collected in the presence of heparin contained a 2–4-fold molar excess of the saccharide over antithrombin. Spectra were obtained in duplicate, averaged, and then corrected for buffer background and heparin dilution. Spectra of antithrombin variants were compared with wild-type controls obtained on the same day. For antithrombin variants with the weakest heparin affinities, the antithrombin-heparin complex spectrum was obtained by correcting for free antithrombin based on measured KD values for the antithrombin-heparin interaction.
Rapid Kinetics of Heparin Binding
The kinetics of heparin pentasaccharide binding to antithrombin variants were analyzed under pseudo-first order conditions with a 5–10-fold molar excess of heparin pentasaccharide over antithrombin by monitoring tryptophan fluorescence changes accompanying binding as in past studies (22). The kinetics were studied in 20 mm sodium phosphate buffers with ionic strengths of 0.15 or 0.05, pH 7.4, at 25 °C with an Applied Photophysics SX-17MV stopped-flow fluorometer (Leatherhead, UK). Tryptophan fluorescence was monitored with an excitation wavelength of 280 nm and an emission cut-on filter with 50% transmittance at 320 nm. Progress curves of heparin binding to antithrombin were computer fit by a single exponential function by non-linear regression analysis to obtain the observed pseudo-first order rate constant, kobs, for heparin binding. For the P14 Glu variant as well as wild type, the kinetics of heparin binding were monitored by changes in antithrombin-bound TNS fluorescence with TNS at 10 μm and with excitation at 330 nm and emission monitored with a cut-on filter with 50% transmittance at 400 nm.
Simulations of heparin binding to antithrombin by the general scheme in which binding may occur by an induced allosteric activation pathway or a pre-equilibrium allosteric activation pathway (Scheme 1) were done with Kintech software (30). K1 = k-1/k+1, k+2, an k-2 were set at values approximating those measured for wild type (values for k+1 and k-1 of 109 m−1s−1 and 103 s−1 were assumed to give K1 = 10−6 m, k+2 = 103 s−1 and k-2 = 0.1 s−1), values for k+4 and k−4 of 109 m−1s−1 and 10−3 s−1 were assumed to give K4 = 10−12 m, the value estimated for the fully activated P14 Glu mutant, k3 was fixed at 10 s−1 based on previous studies (31) and k-3 set at 103 s−1 to satisfy the constraints of the thermodynamic cycle, i.e. (k-1 x k-2)/(k+1 x k+2) = (k-3 x k-4)/(k+3 x k+4). Changes in the allosteric equilibrium were then produced by changing either the forward rate constants, k+3 and k+2, by factors of 10, or the reverse rate constants, k-3 and k-2, in the same manner.
SCHEME 1.
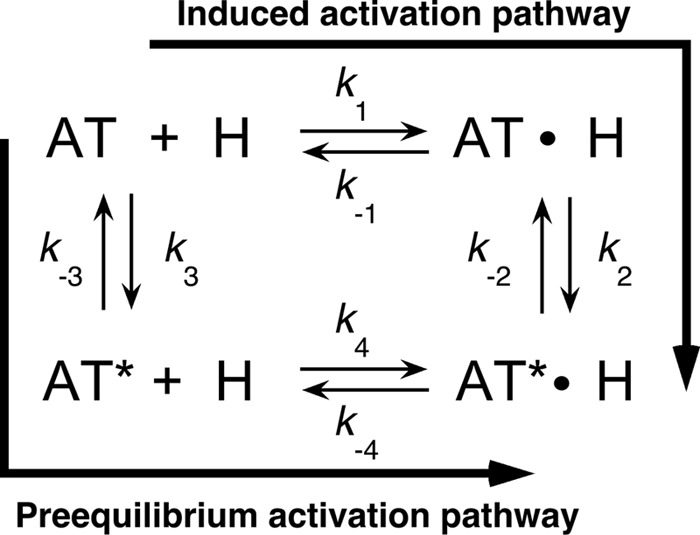
General scheme for heparin allosteric activation of antithrombin. The scheme depicts two alternative pathways for allosteric activation wherein either heparin may bind native antithrombin (AT) and induce allosteric activation (AT*) (induced activation pathway) or native antithrombin may be activated without heparin through a conformational pre-equilibrium followed by heparin binding (pre-equilibrium activation pathway).
Thermal Stability
The thermal stability of antithrombin variants was measured over the temperature range 40–74 °C with 100 nm protein in I 0.15, pH 7.4, sodium phosphate buffer by monitoring tryptophan fluorescence changes that accompany thermal denaturation at λex 280 nm, λem 340 nm with an SLM 8000 spectrofluorometer (32). Samples were allowed to equilibrate at ∼40 °C, and after recording the initial fluorescence, the temperature was increased by ∼0.5°/min with a Peltier-controlled cuvette holder (Quantum Northwest, Spokane, WA) with continuous stirring of protein solutions. Fluorescence readings were taken at ∼5-min intervals. Melting curves were analyzed by nonlinear regression fitting to Equation 11 (33),
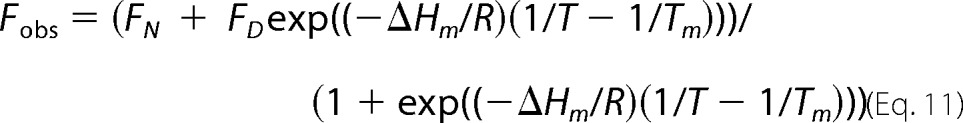 |
where Fobs is the observed fluorescence at temperature T in degrees kelvin; FN and FD are the fluorescence of native and denatured states at temperature T; ΔHm is the van't Hoff enthalpy change for thermal unfolding; R is the gas constant; and Tm is the melting temperature at the midpoint of the thermal transition. FN and FD increase linearly with temperature according to Equation 12,
where FN0 and FD0 are the intercepts, and mN and mD are the slopes of this dependence, respectively. Melting curves were fit by nonlinear regression to these equations with FN0, FD0, mN, mD, ΔHm, and Tm fit as parameters. Changes in the melting temperature of mutant antithrombins from wild type were used to calculate changes in protein stability at the melting temperature of wild type from Equation 13 (34),
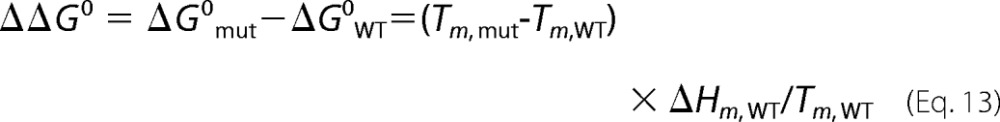 |
where the subscripts, mut and WT, represent the parameters for mutant and wild-type proteins, respectively.
Results
Saturation Mutagenesis of the RCL P14 Residue
To evaluate the role of an RCL-sheet A interaction in regulating an allosteric equilibrium between native and activated states of antithrombin, we sought to perturb the wild-type RCL P14 Ser interaction by saturation mutagenesis of the P14 residue. Fifteen P14 mutants were engineered and expressed at levels comparable with wild type. All mutants bound tightly to a heparin affinity matrix and could be purified to homogeneity similar to wild type. Stoichiometric titrations of the antithrombin mutants with the minimal heparin pentasaccharide activator monitored by tryptophan fluorescence changes that report heparin binding resulted in stoichiometries close to 1:1 (Table 1). All mutants were fully reactive with thrombin in forming SDS-stable antithrombin-thrombin complexes, as well as variable amounts of cleaved antithrombin based on SDS-PAGE analysis (data not shown). The cleaved serpin was the dominant product for some mutants. The mutant antithrombins thus retained the characteristic heparin-binding and protease-reactive functions of wild-type antithrombin, despite a significant variability in their preference for inhibitor or substrate modes of reaction (35).
TABLE 1.
Heparin pentasaccharide stoichiometry, affinity, and kinetics of binding to antithrombin P14 variants and ionic/nonionic contributions to binding at pH 7.4, I 0.15, 25 °C
Stoichiometries and affinities of heparin pentasaccharide interactions with variant antithrombins and the ionic (number of charged interactions, Z) and nonionic (log K′D) contributions to binding ± S.E. were measured by fluorescence titrations as a function of ionic strength as described under “Experimental Procedures.” The latter were obtained from the data in Fig. 4. The time of elution of variants from heparin-agarose upon application of a salt gradient was measured as detailed under “Experimental Procedures.” On-rate constants (kon) for pentasaccharide binding were obtained from the slopes of the initial linear dependence of the pseudo-first order binding rate constant on heparin concentration from the data in Fig. 6A. ND indicates that a value was not determined.
| P14 variant | Binding stoichiometry | Z | log K′D | KD, obs I 0.15 | Heparin-agarose elution | kon I 0.15 |
|---|---|---|---|---|---|---|
| mol heparin/mol AT | m | m | min | μm−1 s−1 | ||
| Val | 0.74 ± 0.05 | 3.2 ± 0.4 | −4.7 ± 0.3 | 1.4 ± 0.6 × 10⁻⁷ | 42.9 | 64 ± 10 |
| Thr | 0.96 ± 0.12 | 4.5 ± 0.3 | −4.6 ± 0.2 | 2.2 ± 0.4 × 10⁻⁸ | 47.6 | 67 ± 6 |
| Ala | 0.91 ± 0.10 | 5.3 ± 0.6 | −4.3 ± 0.3 | 1.2 ± 0.3 × 10⁻⁸ | 48.3 | 74 ± 2 |
| Leu | 0.71 ± 0.03 | 4.3 ± 0.3 | −5.4 ± 0.1 | 4.5 ± 0.5 × 10⁻⁹ | 52.0 | 62 ± 9 |
| Met | 0.61 ± 0.05 | 5.1 ± 0.4 | −5.1 ± 0.2 | 2.4 ± 1.9 × 10⁻⁹ | ND | 71 ± 2 |
| Ser (WT) | 1.00 ± 0.08 | 5.4 ± 0.4 | −5.3 ± 0.1 | 8.5 ± 1.4 × 10⁻¹⁰ | 57.5 | 68 ± 3 |
| Trp | 0.78 ± 0.01 | ND | ND | ND | 62.4 | ND |
| Phe | 0.72 ± 0.07 | 6.7 ± 0.3 | −5.6 ± 0.1 | 6.2 ± 0.5 × 10⁻¹¹ | 61.0 | 75 ± 2 |
| Gly | 0.88 ± 0.05 | 6.3 ± 0.5 | −5.9 ± 0.1 | 5.7 ± 1.2 × 10⁻¹¹ | 64.8 | 71 ± 3 |
| Pro | 0.90 ± 0.14 | 6.2 ± 0.6 | −6.2 ± 0.2 | 3.8 ± 1.3 × 10⁻¹¹ | 66.3 | 74 ± 2 |
| His | 0.79 ± 0.08 | 7.4 ± 0.2 | −5.9 ± 0.1 | 1.0 ± 0.1 × 10⁻¹¹ | 65.2 | 90 ± 1 |
| Tyr | 0.76 ± 0.06 | 7.5 ± 0.4 | −5.6 ± 0.1 | 1.4 ± 0.2 × 10⁻¹¹ | 63.5 | 97 ± 3 |
| Gln | 0.91 ± 0.11 | 6.7 ± 0.8 | −6.6 ± 0.1 | 5.7 ± 0.8 × 10⁻¹² | 66.6 | 96 ± 3 |
| Asp | 0.95 ± 0.04 | ND | ND | ND | 66.8 | ND |
| Glu | 0.97 ± 0.09 | ND | ND | <6 × 10⁻¹³a | 67.0 | ND |
| Arg | 0.88 ± 0.11 | 8.2 ± 0.5 | −6.8 ± 0.1 | 3.0 ± 0.2 × 10⁻¹³ | 67.2 | ND |
a Value was estimated based on comparisons of wild type, P14 Gln, and P14 Glu affinities at pH 9 and the affinity differences between wild type and P14 Gln at pH 9 and pH 7.4.
Effects of P14 Residue Mutations on Antithrombin Substrate Reactivity with Proteases
To quantitatively evaluate the effects of the P14 residue mutations on antithrombin reactivity as a substrate or inhibitor of proteases, we measured the SI for antithrombin reactions with thrombin, factor Xa, and factor IXa in the absence and presence of heparin pentasaccharide and for the former two protease reactions, also in the presence of a full-length heparin activator containing the pentasaccharide. Inhibition stoichiometries in the absence of heparin were significantly increased above the wild-type (P14 Ser) value of ∼1 mol of serpin/mol of protease for several P14 residue substitutions in reactions with thrombin and factor Xa (Fig. 1 and Table 2), confirming the SDS-PAGE analysis of the mutant reactions with thrombin. P14 side chains with mostly nonpolar character (Ala, Gly, Thr, Pro, Val, Leu, Met, and Phe) showed no or modest increases in SI, whereas charged (Asp and Glu), polar (Gln), and mixed polar/nonpolar aromatic (Tyr, Trp, and His) residues showed large increases. These effects were protease-dependent with the SI increases being greatest for factor Xa reactions, less for thrombin reactions, and least for factor IXa reactions. Those P14 variants showing elevated stoichiometries in the absence of heparin exhibited even larger elevations in the presence of heparin, with these effects again being greatest for factor Xa reactions, intermediate for thrombin reactions, and smallest for factor IXa reactions. Notably, all P14 variants except those with Ala and Gly substitutions showed significant elevations in SI in reactions with factor Xa in the presence of heparin. No inhibition of thrombin or factor Xa was detected with the P14 Arg antithrombin variant in the absence or presence of heparin, and SDS-PAGE analysis showed that this variant reacted exclusively as a substrate of these proteases (see below).
FIGURE 1.

Stoichiometries of inhibition for reactions of antithrombin P14 variants with proteases. Bar graphs comparing inhibition stoichiometries measured for reactions of antithrombin P14 variants with thrombin (top panel), factor Xa (middle panel), and factor IXa (bottom panel) in the absence of heparin (light gray) and in the presence of pentasaccharide (dark gray) or full-length heparins (black) from Table 2. The substituted RCL P14 residues are indicated by the single letter code. Dashed lines correspond to wild-type values, and the asterisk indicates the wild-type antithrombin reaction.
TABLE 2.
Stoichiometries and second order association rate constants for reactions of wild-type (WT) and P14 variant antithrombins with proteases in the absence of heparin (SI−H, ka, −H) and presence of pentasaccharide (SI+H5, ka, +H5) or full-length heparins (SI+H50, ka, +H50)
Stoichiometries of inhibition (SI) and association rate constants (ka) ±S.E. for reactions of antithrombin P14 variants with proteases were measured by end point titrations or by time-dependent or heparin-dependent inhibition progress curves under pseudo-first order conditions, respectively, in I 0.15, pH 7.4 sodium phosphate (thrombin and factor Xa) or Hepes/calcium (factor IXa) buffers at 25 °C as described under “Experimental Procedures.” Association rate constants have been corrected for variable inhibition reaction stoichiometries by multiplying apparent rate constants by the SI. ND indicates that a value was not determined.
| P14 variant | SI−H | ka, −H | SI+H5 | ka, +H5 | SI+H50 | ka, +H50 |
|---|---|---|---|---|---|---|
| Thrombin reactions | ||||||
| Val | 1.0 ± 0.1 | (9.4 ± 0.4) × 103 | 1.1 ± 0.1 | (1.1 ± 0.1) × 104 | 1.5 ± 0.1 | (2.0 ± 0.1) × 107 |
| Thr | 1.4 ± 0.1 | (7.5 ± 0.1) × 103 | 1.3 ± 0.1 | (1.3 ± 0.1) × 104 | 1.7 ± 0.1 | (2.7 ± 0.1) × 107 |
| Ala | 1.7 ± 0.1 | (1.2 ± 0.1) × 104 | 1.7 ± 0.2 | (2.3 ± 0.1) × 104 | 1.7 ± 0.2 | (1.5 ± 0.5) × 107 |
| Leu | 1.2 ± 0.1 | (9.4 ± 0.2) × 103 | 2.5 ± 0.1 | (1.3 ± 0.1) × 104 | 3.4 ± 0.2 | (2.1 ± 0.3) × 107 |
| Met | 1.4 ± 0.1 | (8.8 ± 0.1) × 103 | 1.8 ± 0.1 | (1.6 ± 0.1) × 104 | 2.5 ± 0.1 | (2.2 ± 0.1) × 107 |
| Ser (WT) | 1.3 ± 0.1 | (1.1 ± 0.1) × 104 | 1.3 ± 0.1 | (2.2 ± 0.1) × 104 | 1.7 ± 0.1 | (3.4 ± 0.1) × 107 |
| Trp | 13 ± 1 | (1.0 ± 0.1) × 104 | 8.8 ± 0.2 | (2.4 ± 0.1) × 104 | 25 ± 1 | ND |
| Phe | 1.6 ± 0.1 | (9.1 ± 1.2) × 103 | 1.7 ± 0.1 | (2.0 ± 0.1) × 104 | 2.7 ± 0.1 | (1.9 ± 0.2) × 107 |
| Gly | 1.0 ± 0.1 | (6.3 ± 0.2) × 103 | 1.0 ± 0.1 | (1.4 ± 0.1) × 104 | 1.5 ± 0.1 | (2.0 ± 0.1) × 107 |
| Pro | 1.5 ± 0.1 | (1.1 ± 0.1) × 104 | 2.8 ± 0.1 | (2.0 ± 0.1) × 104 | 7.7 ± 0.6 | (2.6 ± 0.8) × 107 |
| His | 10 ± 1 | (2.9 ± 0.1) × 104 | 30 ± 1 | (1.9 ± 0.1) × 104 | 110 ± 6 | (3.7 ± 1.2) × 107 |
| Tyr | 6.8 ± 0.2 | (1.4 ± 0.1) × 104 | 5.6 ± 0.2 | (2.3 ± 0.1) × 104 | 13 ± 1 | (3.2 ± 0.3) × 107 |
| Gln | 2.0 ± 0.1 | (1.2 ± 0.1) × 104 | 11 ± 1 | (1.4 ± 0.1) × 104 | 62 ± 3 | (3.3 ± 0.3) × 107 |
| Asp | 2.2 ± 0.2 | (1.9 ± 0.4) × 104 | 270 ± 20 | (2.0 ± 0.2) × 104 | 150 ± 20 | (1.8 ± 0.2) × 107 |
| Glu | 3.1 ± 0.4 | (1.4 ± 0.5) × 104 | 480 ± 40 | (3.0 ± 0.3) × 104 | 430 ± 40 | (7.6 ± 2.3) × 106 |
| Factor Xa reactions | ||||||
| Val | 1.3 ± 0.1 | (2.6 ± 0.4) × 103 | 5.5 ± 0.4 | (2.5 ± 0.1) × 105 | 3.4 ± 0.2 | (1.3 ± 0.1) × 106 |
| Thr | 2.1 ± 0.1 | (1.7 ± 0.2) × 103 | 2.4 ± 0.1 | (4.0 ± 0.2) × 105 | 2.0 ± 0.1 | (1.6 ± 0.2) × 106 |
| Ala | 1.1 ± 0.1 | (1.7 ± 0.4) × 103 | 1.6 ± 0.3 | (7.4 ± 2.1) × 105 | 1.7 ± 0.1 | (6.0 ± 0.4) × 106 |
| Leu | 1.8 ± 0.1 | (2.6 ± 0.2) × 103 | 41 ± 1 | (6.0 ± 0.8) × 105 | 16 ± 1 | (8.8 ± 1.6) × 105 |
| Met | 1.6 ± 0.1 | (1.9 ± 0.4) × 103 | 7.9 ± 0.1 | (4.8 ± 1.7) × 105 | 3.9 ± 0.7 | (4.3 ± 0.2) × 106 |
| Ser (WT) | 1.2 ± 0.1 | (4.4 ± 0.2) × 103 | 1.4 ± 0.1 | (4.6 ± 0.5) × 105 | 1.4 ± 0.1 | (1.5 ± 0.2) × 106 |
| Trp | 28 ± 2 | (1.3 ± 0.5) × 104 | 81 ± 5 | (5.8 ± 1.0) × 105 | 55 ± 2 | (2.9 ± 0.4) × 106 |
| Phe | 2.2 ± 0.3 | (1.6 ± 0.1) × 104 | 5.1 ± 0.4 | (5.6 ± 0.3) × 105 | 4.4 ± 0.2 | (2.5 ± 0.3) × 106 |
| Gly | 1.0 ± 0.1 | (1.6 ± 0.1) × 104 | 1.4 ± 0.1 | (6.2 ± 0.6) × 105 | 1.3 ± 0.1 | (1.6 ± 0.1) × 106 |
| Pro | 1.8 ± 0.1 | (3.6 ± 0.3) × 104 | 8.3 ± 0.1 | (4.6 ± 0.1) × 105 | 10 ± 1 | (1.4 ± 0.1) × 106 |
| His | 18 ± 1 | (4.6 ± 0.6) × 104 | 170 ± 10 | (4.9 ± 0.1) × 105 | 180 ± 10 | (4.8 ± 0.3) × 106 |
| Tyr | 29 ± 2 | (7.4 ± 1.0) × 104 | 38 ± 2 | (8.5 ± 1.6) × 105 | 25 ± 2 | (6.8 ± 0.2) × 106 |
| Gln | 5.4 ± 0.3 | (9.0 ± 1.1) × 104 | 180 ± 10 | (7.4 ± 1.1) × 105 | 120 ± 5 | (2.7 ± 0.2) × 106 |
| Asp | 4.1 ± 0.1 | (8.2 ± 1.0) × 105 | 740 ± 30 | (8.1 ± 0.4) × 105 | 440 ± 30 | (3.9 ± 0.9) × 106 |
| Glu | 7.9 ± 1.9 | (1.3 ± 0.2) × 106 | 2100 ± 400 | (1.5 ± 0.7) × 105 | 1300 ± 300 | (1.7 ± 0.3) × 106 |
| Factor IXa reactions | ||||||
| Val | 1a | (4.5 ± 1.1) × 100 | 1.2 ± 0.1 | (8.5 ± 1.3) × 103 | ||
| Thr | 1a | (1.7 ± 0.3) × 101 | 1.2 ± 0.1 | (1.6 ± 0.6) × 104 | ||
| Ala | 1.0 ± 0.1 | (1.3 ± 0.1) × 101 | 1.0 ± 0.1 | (1.4 ± 0.2) × 104 | ||
| Leu | 1.0 ± 0.1 | (3.9 ± 0.3) × 101 | 1.4 ± 0.1 | (1.3 ± 0.3) × 103 | ||
| Met | ND | ND | ND | ND | ||
| Ser (WT) | 1.1 ± 0.2 | (1.8 ± 0.1) × 102 | 1.0 ± 0.1 | (2.4 ± 0.2) × 104 | ||
| Trp | 1.8 ± 0.2 | (2.7 ± 0.4) × 102 | 3.2 ± 0.1 | (9.2 ± 0.1) × 102 | ||
| Phe | 1.3 ± 0.2 | (4.3 ± 0.6) × 102 | 1.0 ± 0.1 | (5.7 ± 1.0) × 103 | ||
| Gly | 1.0 ± 0.1 | (6.6 ± 0.6) × 102 | 1.0 ± 0.1 | (2.1 ± 0.1) × 104 | ||
| Pro | 1.1 ± 0.1 | (8.5 ± 0.9) × 102 | 1.2 ± 0.1 | (4.5 ± 0.7) × 103 | ||
| His | 1.8 ± 0.1 | (1.0 ± 0.1) × 103 | 9.6 ± 2.6 | (9.6 ± 4.0) × 102 | ||
| Tyr | 1.5 ± 0.1 | (1.7 ± 0.1) × 103 | 2.0 ± 0.2 | (1.4 ± 0.2) × 103 | ||
| Gln | 1.4 ± 0.1 | (2.4 ± 0.2) × 103 | 6.1 ± 0.3 | (2.5 ± 0.4) × 103 | ||
| Asp | ND | ND | ND | ND | ||
| Glu | 1.7 ± 0.1 | (1.9 ± 0.4) × 104 | 710 ± 120 | (4.2 ± 0.7) × 103 | ||
a SI could not be measured because of slow reaction kinetics and was assumed to be 1 based on the SI measured for the pentasaccharide-activated antithrombin reaction.
Effects of P14 Mutations on Antithrombin Inhibitor Reactivity with Proteases
To determine whether the P14 mutations perturbed the allosteric equilibrium between native and activated states of antithrombin with and without bound heparin, second order inhibition rate constants were measured for reactions of the antithrombin P14 variants with factor Xa, factor IXa, and thrombin in the absence and presence of pentasaccharide heparin and for thrombin and factor Xa reactions also with full-length heparin (Fig. 2 and Table 2). Antithrombin reactivity with factors Xa and IXa is enhanced several hundredfold upon allosteric activation by the heparin pentasaccharide and is thus diagnostic of changes in the allosteric equilibrium in the absence and presence of heparin, whereas reactivity with thrombin is insensitive to allosteric activation and provided a control for any nonspecific effects of the mutations (5, 6). Full-length heparin activation of antithrombin produces additional reactivity enhancements with all proteases due to the longer heparin chain bridging antithrombin and protease in a ternary encounter complex and provided a positive control for normal heparin-bridging effects (6). Apparent second order rate constants for antithrombin-protease reactions were multiplied by measured SIs to correct for the differing extents to which the variant serpins reacted as substrates and thereby to obtain rate constants that solely reflected the reaction through the inhibitory pathway (35).
FIGURE 2.

Association rate constants for reactions of antithrombin P14 variants with proteases. Bar graphs comparing second order association rate constants for reactions of antithrombin P14 variants with thrombin (top panel), factor Xa (middle panel), and factor IXa (bottom panel) in the absence of heparin (light gray) and in the presence of pentasaccharide (dark gray) or full-length heparins (black) from Table 2. Wild-type and variant antithrombin reactions are indicated as in Fig. 1. Rate constants have been corrected for the variable flux through the substrate pathway by multiplying apparent rate constants (ka, app) by inhibition stoichiometries (SI). Dashed lines correspond to wild-type values, with both basal and heparin-activated values shown for variant antithrombin reactions with factor Xa and IXa in the absence of heparin.
The mutants fell into two classes. In one class, consisting of mostly nonpolar aliphatic P14 side chains (Ala, Thr, Val, Leu, and Met), the basal factor Xa and factor IXa rate constants measured in the absence of heparin were decreased relative to wild type (P14 Ser), suggesting an increased stabilization of the native low reactivity antithrombin conformation (14). The decreases in reactivity were greater for factor IXa than for factor Xa suggesting that the native state has a lower reactivity with factor IXa than factor Xa. In a second class, either having no P14 side chain (Gly) or possessing bulky aromatic (Trp, Phe, His, and Tyr), polar (Pro and Gln), and charged (Asp and Glu) P14 side chains, the basal factor Xa and factor IXa rate constants were greater than wild type, suggesting destabilization of the native state and a shifting of the allosteric equilibrium toward the activated state. Notably, the Asp and Glu mutants showed basal reactivities similar to fully activated wild type for both proteases, in agreement with a previous study of the Glu variant (15).
Heparin pentasaccharide activation of the antithrombin variants resulted in enhancements of rate constants for factor Xa inhibition that in most cases achieved or differed only modestly from the pentasaccharide-activated wild-type inhibition rate constant. By contrast, heparin-activated variants exhibited reactivities with factor IXa that significantly differed from those of activated wild type. Most noteworthy, only the pentasaccharide-activated Gly variant achieved a reactivity with factor IXa comparable with that of activated wild type. Nonpolar P14 variants whose basal reactivities with factor IXa were reduced from wild type showed large increases in reactivity upon pentasaccharide activation, but these increases fell short of the reactivity of activated wild type. Variants whose basal reactivities with factor IXa were activated relative to wild type showed either further reactivity enhancements with pentasaccharide activation (Trp, Phe, and Pro), no additional reactivity enhancement (His, Tyr, and Gln), or a loss in reactivity (Glu). Again, all of these latter reactivity enhancements failed to achieve the reactivity of activated wild type. Heparin pentasaccharide activation of the mutant antithrombins thus result in reactivities similar to wild type with factor Xa, but less than wild type with factor IXa.
Significantly, the rate constants for reaction of the antithrombin variants with thrombin were highly similar to wild-type reaction rate constants for both basal and pentasaccharide-activated inhibitor reactions, indicating that the changes in the allosteric activation state produced by the mutations did not affect antithrombin reactivity with thrombin. A full-length bridging heparin also produced similar ∼1000–2000-fold rate enhancements of the reactions of wild type and variant antithrombins with thrombin and ∼3–11-fold additional rate enhancements over those produced by pentasaccharide of wild type and variant antithrombin reactions with factor Xa,4 implying that heparin bridging was essentially normal for all P14 antithrombin variants.
Limited data on the effect of the P14 Arg mutation on antithrombin reactivity was obtained by evaluating the kinetics of the substrate reaction of this variant with catalytic levels of factor Xa using SDS-PAGE and quantitative gel scanning analysis. Fig. 3 shows that the variant was cleaved rapidly, with the native serpin band decreasing in intensity and the cleaved serpin band increasing in intensity in a first order process after fixed time reactions with increasing levels of factor Xa. The measured value of kcat/Km obtained from the exponential progress curves (2 × 10⁵ m−1 s−1) indicated that the variant was 50-fold activated as a substrate of factor Xa.
FIGURE 3.
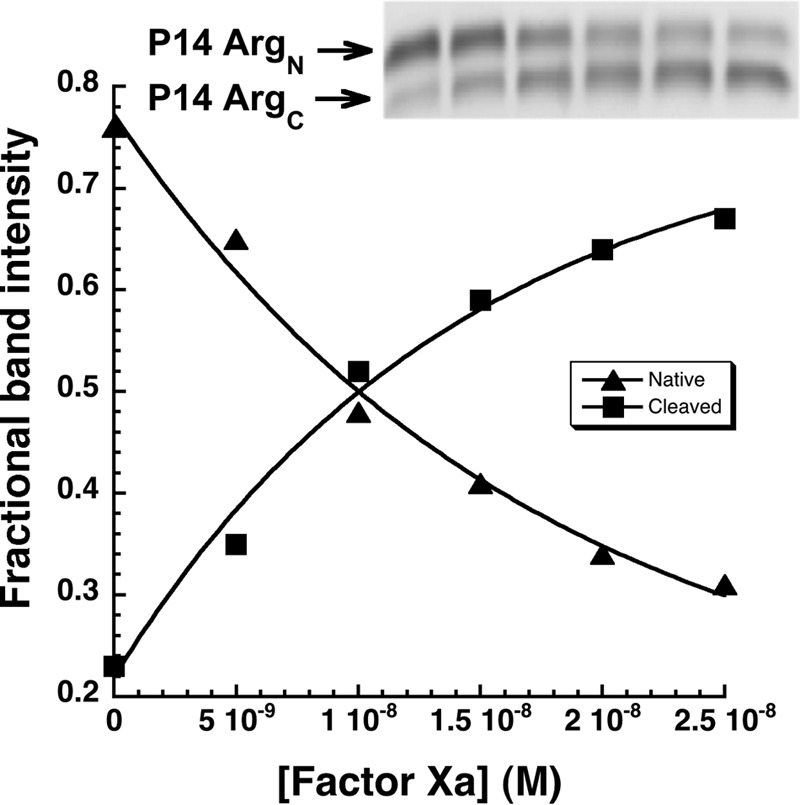
Reaction of antithrombin P14 Arg variant with factor Xa. SDS-PAGE analysis of the substrate reaction of 700 nm antithrombin P14 Arg variant with 0, 5, 10, 15, 20, and 25 nm factor Xa (lanes from left to right) for 5 min as described under “Experimental Procedures.” The graph shows fractional band intensities of native (P14 ArgN) and RCL-cleaved inhibitors (P14 ArgC) that were quantified with imaging software and plotted as a function of factor Xa concentration. Solid lines are fits of the changes in band intensity by a single exponential function to obtain kcat/Km for the reaction.
Effect of P14 Residue Mutations on Heparin Binding Affinity
Because native and activated states of antithrombin differ markedly in their affinities for the heparin pentasaccharide (5), perturbations of the allosteric equilibrium by the P14 mutations were expected to result in changes in heparin affinity. Heparin pentasaccharide affinities of the variant antithrombins were quantitated by equilibrium binding titrations monitored by protein fluorescence changes that accompany binding as in past studies (5). To determine the heparin affinities at physiologic ionic strength and pH (I 0.15, pH 7.4) required measuring affinities over a range of ionic strengths and extrapolating to I 0.15 because the affinities were much too strong to measure accurately at I 0.15. The ionic strength dependence of the observed dissociation constant for heparin pentasaccharide binding to antithrombin, KD, obs, was evaluated based on the theory of protein-polyelectrolyte interactions (36) by Equation 14,
where K′D represents the dissociation constant due to nonionic interactions, Z is the number of ionic interactions involved in binding, and ψ is the fraction of sodium ions bound to heparin that are released when antithrombin is bound (equal to 0.8) (5).5 Linear regression analysis of the dependence of log KD, obs on log [Na+] for each antithrombin variant showed that the slopes and intercepts were both decreased from wild type for the class of variants that appeared to stabilize the native state (Fig. 4, A and B, and Table 1). In contrast, slopes and intercepts were both increased for the class of variants that appeared to destabilize the native state and shift the allosteric equilibrium toward the activated state. Values for Z and log K′D obtained from these plots (Table 1) showed that the P14 mutations affected both the number of ionic interactions (Z) and the nonionic binding energy (log K′D) mediating the antithrombin-pentasaccharide interaction. The relative heparin affinities at physiologic ionic strength (I 0.15) determined by extrapolation of the plots (Table 1) similarly showed lower affinities than wild type for those mutants with decreased factor Xa and IXa basal reactivities (KD, obs increased from ∼1 nm to ∼100 nm) and higher affinities than wild type for those with increased factor Xa and IXa basal reactivities (KD, obs decreased from ∼1 nm to ∼0.0003 nm). A similar ordering of heparin affinities was obtained by analyzing the salt concentration required to elute the mutants from an immobilized heparin column (Table 1).
FIGURE 4.

Ionic strength dependence of heparin binding to antithrombin P14 variants. Observed dissociation constants (KD, obs) for heparin pentasaccharide binding to antithrombin P14 Val (■), Thr (▵), Ala (▴), Leu (♢), Met (×), wild type (WT, ●), Phe (□), Tyr (▾), and His (▿) variants (A); WT (●), Gly (○), Pro (▴), Gln (▵), and Arg (■) variants (B); and WT (●), Gln (▴), and Glu (■) variants (C) were measured by fluorescence titrations as a function of ionic strength at pH 7 4 (A and B) or pH 9 (C) as described under “Experimental Procedures.” Plots of log KD, obs versus log [Na+] were fit by linear regression (solid lines) to obtain the number of ionic charges (Z) and the nonionic dissociation constant (K′D) for the interactions based on Equation 14 (tabulated in Table 1).
For the P14 Glu mutant that appeared to be fully activated in the absence of heparin, protein fluorescence changes induced by heparin binding were too small for accurate binding studies, but fluorescence changes induced in the bound extrinsic probe, TNS, upon heparin activation were similar for wild type and the P14 Glu variant to allow such studies (29). Reliable binding titrations could only be conducted at higher pH (9.0) in this case because of the high affinity at pH 7.4 and the need for higher protein concentrations (500 nm) to provide a large enough fluorescence change. Measurements of KD, obs over a range of ionic strength for the P14 Glu mutant as well as for wild type and the P14 Gln variant at pH 9 showed linear changes in log KD, obs as a function of log[Na+] in all cases, with extrapolated affinities at I 0.15 of 51, 4.3, and 0.47 nm for wild type, Gln, and Glu variants, respectively (Fig. 4C). Because the differences in KD, obs at pH 9 for wild type and P14 Gln mutants are amplified at pH 7.4, we reasoned that the observed ∼10-fold difference in KD, obs for P14 Glu and Gln mutants at pH 9 implied that KD, obs for the P14 Glu mutant at pH 7.4 was at least 10-fold lower than that of the P14 Gln mutant, i.e. <0.6 pm, a value comparable with that of the P14 Arg variant.
To determine whether heparin affinity changes of the P14 variants correlated with changes in basal reactivities with factors Xa and IXa in accordance with a two-state allosteric activation model, we plotted log ka, obs for reactions of the mutants with factor Xa and factor IXa against log KD, obs at I 0.15 (Fig. 5). The relationship between these parameters that is predicted for a two-state allosteric equilibrium model is given by Equation 15,
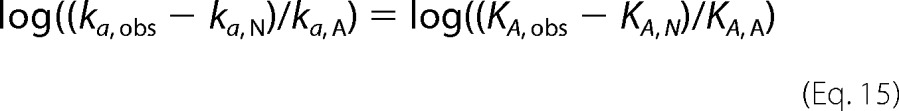 |
where ka, N and ka, A are intrinsic association rate constants for reaction of native and activated conformers with protease, KA, obs is the observed equilibrium association constant for heparin binding, and KA, N and KA, A are intrinsic association equilibrium constants for heparin interactions with native and activated conformers under the conditions ka, A ≫ ka, N and Ka, A ≫ Ka, N (see under “Experimental Procedures”). For values of ka, obs ≫ ka, N and KA, obs ≫ KA, N, Equation 15 predicts a linear correlation between log ka, obs and log KA, obs = −log KD, obs with a unit slope. Linear correlations were observed between log ka, obs and log KD, obs for both factor Xa and IXa reactions (Fig. 5). However, the slopes of these plots significantly differed from −1 (−0.64 ± 0.02 to −0.68 ± 0.07), and a plateau was reached in the plot of factor Xa reactivities. Correction of ka, obs in the latter plot for a limiting ka, N of 1500 m−1 s−1 resulted in linearization of this plot. Together, these results suggested that changes in heparin affinity of the mutants paralleled changes in basal reactivity with factors Xa and IXa, but this correlation deviated from that expected for a two-state allosteric equilibrium, i.e. the fraction of activated antithrombin predicted by the two parameters did not correspond. Moreover, the observation that the heparin affinity changes result from alterations in both the ionic and nonionic binding energy was inconsistent with heparin stabilizing a common activated state and instead implied multiple activated states with different modes of heparin interaction.
FIGURE 5.
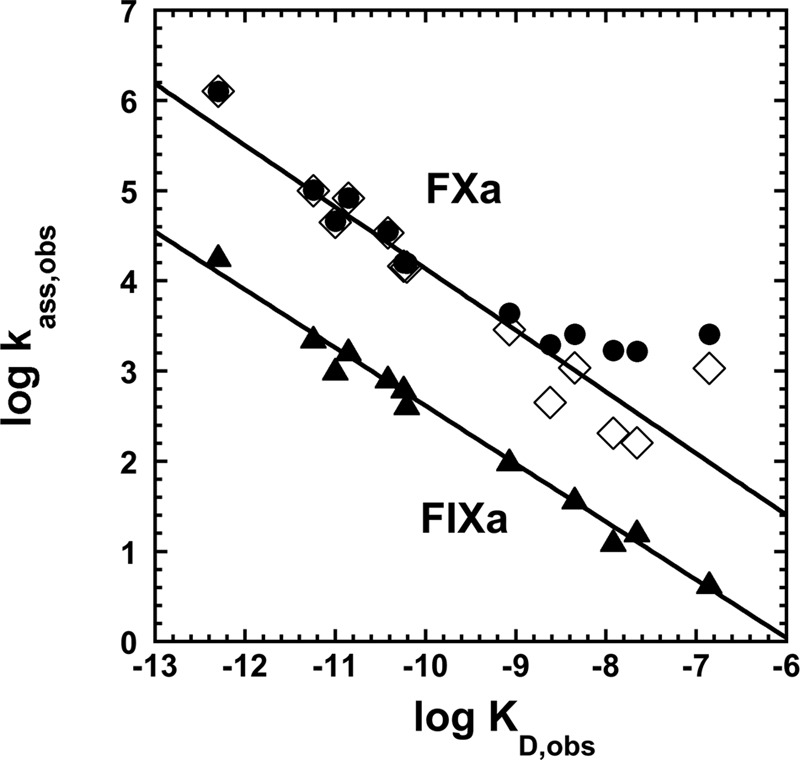
Correlation of basal reactivities of antithrombin P14 variants with factor Xa and factor IXa with heparin affinities of the variants. Shown are log-log plots of observed second order association rate constants for reaction of antithrombin variants with factor Xa (●) or factor IXa (▴) through the inhibitory pathway (ka, obs) in the absence of heparin against extrapolated values of observed dissociation constants for heparin binding at I 0.15 (KD, obs). Factor Xa reaction data are shown replotted (♢) after subtracting an assumed rate constant of 1500 m−1 s−1 for the native state reaction. Solid lines are linear regression fits for corrected factor Xa reaction data and uncorrected factor IXa reaction data.
Rapid Kinetics of Heparin Binding to Antithrombin Variants
To determine whether the P14 residue mutations affected heparin affinity for antithrombin by perturbing the allosteric equilibrium between native and activated states, we investigated the kinetics of heparin pentasaccharide binding to the variant antithrombins by monitoring fluorescence changes reporting binding under pseudo-first order conditions. Heparin binds to wild-type antithrombin in a two-step process in which an initial weak binding of heparin (H) to native antithrombin (AT) induces the serpin into the activated high heparin affinity state (AT*) with greater fluorescence (induced activation pathway of Scheme 1) (5, 37). Because the P14 mutations cause varying extents of activation of antithrombin in the absence of heparin, it was necessary to consider the more general scheme for heparin binding and allosteric activation in which native antithrombin may also be activated through a pre-existing allosteric equilibrium prior to binding heparin (pre-equilibrium pathway of Scheme 1). In this scheme, k+1 and k+4 are association rate constants, and k−1 and k−4 are dissociation rate constants for heparin binding to native and activated antithrombin conformations, respectively, and k+3/k−3 and k+2/k−2 are forward/reverse rate constants for transformation of the native to the activated conformation in heparin-free and heparin-bound states, respectively. Simulations of this mechanism were performed starting with wild-type values for the induced activation pathway and estimated values for the pre-equilibrium activation pathway (see under “Experimental Procedures”) and then perturbing the allosteric equilibrium by changing forward or reverse allosteric equilibrium rate constants. Such simulations showed that the observed pseudo-first order rate constant for heparin binding, kobs, is expected to increase hyperbolically with increasing heparin concentration to a limiting rate constant, klim, that closely approximates k+2, in accordance with the empirical Equation 16 (37),
where K0.5 corresponds to the heparin concentration yielding half of klim and koff is the apparent off-rate constant. This behavior reflects the dominance of the induced allosteric activation pathway as heparin concentrations approach and exceed K0.5 to favor saturation of the intermediate native antithrombin-heparin complex. Heparin binding through the pre-equilibrium activation pathway becomes important at heparin concentrations much less than K0.5 and affects the intercept value corresponding to koff.
We first measured the kinetics of heparin pentasaccharide binding to antithrombin at physiologic ionic strength (I 0.15) over a heparin concentration range that was subsaturating with respect to the initial wild-type antithrombin-heparin interaction. kobs increased linearly with increasing heparin concentration for all mutants except Val, Leu, and Thr, which showed a hyperbolic dependence (Fig. 6A). The slopes of the linear plots and initial slopes of the hyperbolic plots, reflecting the on-rate constant, kon = klim/K0.5, showed only modest variations from that of wild type (Table 1), suggesting that the large differences in heparin affinity of the variants resulted from dominant effects of the mutations on the off-rate constant, which corresponds to the reverse allosteric equilibrium rate constant, k−2, in the case of wild-type antithrombin (5). Unfortunately, the intercepts of the plots were indistinguishable from zero in most cases, precluding any reliable measurements of koff.
FIGURE 6.

Rapid kinetic analysis of heparin binding to select antithrombin P14 variants. Shown are plots of the heparin pentasaccharide concentration dependence of kobs for heparin pentasaccharide binding to antithrombin P14 variants in I 0.15 (A) and I 0.05 (B and C) sodium phosphate buffers, pH 7.4, 25 °C under pseudo-first order conditions. P14 variants in A are wild type (WT, ●), Thr (▵), Ala (▴), Met (○), Leu (♢), Val (■), Phe (□), Gly (♦), Pro (▷), His (▿), Tyr (▾), and Gln (◁); P14 variants in B and C are WT (○,●), His (▿), Gly (♦), Gln (◁), Glu (▴), Tyr (▾), Trp (□), Thr (▵), Leu (♢), and Val (■). Values of kobs were measured from heparin binding progress curves monitored by protein fluorescence changes for all except the Glu variant, which was monitored by TNS fluorescence changes (▴). Heparin binding to wild-type antithrombin was measured by both protein fluorescence (○) and TNS fluorescence changes (●). Solid lines in A are linear regression fits of data except for Thr, Leu, and Val variants that were fit by the hyperbolic Equation 16, whereas solid lines in B and C are fits of data by the hyperbolic Equation 16 except for the P14 Glu variant that was fit by linear regression. The dashed lines correspond to fits of wild type reactions monitored by protein fluorescence changes. The inset in C shows the P14 Leu and Val variant reactions on an expanded scale.
To observe saturation of the initial weak antithrombin-heparin interaction and resolve the effects of the P14 mutations on the two steps of the induced allosteric activation pathway, the kinetics of heparin binding to selected mutants were evaluated over a wider heparin concentration range at low ionic strength (0.05). All antithrombin mutants showed a saturable dependence of kobs on heparin concentration (Fig. 6, B and C, and Table 3). Thr, Leu, and Val mutants that showed factor Xa/IXa reactivity and heparin affinity lower than wild type showed reduced values of K0.5 and reduced values of klim for allosteric activation relative to wild type. Gly and Gln variants that showed higher factor Xa/IXa reactivity and bound heparin with higher affinity than wild type exhibited greater values of K0.5 and higher klim values for conformational activation than wild type. By contrast, the aromatic Trp, Tyr, and His P14 variants, which all showed enhanced factor Xa/IXa reactivity and higher heparin affinity than wild type, exhibited K0.5 and klim values reduced from wild type for the Trp variant, comparable with wild type for the Tyr variant and greater than wild type for the His variant.
TABLE 3.
Kinetics of heparin pentasaccharide binding to selected P14 variant antithrombins at I 0.05, pH 7.4, 25 °C
Kinetic parameters, K0.5 and klim, ±S.E. characterizing heparin pentasaccharide binding to antithrombin variants under pseudo-first order conditions were obtained from fits of the dependence of kobs for binding on heparin concentration shown in Fig. 6 by Equation 16. kobs was measured from progress curves of the tryptophan fluorescence changes that report heparin binding to antithrombin monitored with a stopped-flow fluorimeter as described under “Experimental Procedures.”
| P14 variant | K0.5 | klim | klim/K0.5 |
|---|---|---|---|
| μm | s−1 | μm−1 s−1 | |
| Val | 0.23 ± 0.03 | 55 ± 2 | 240 ± 20 |
| Thr | 1.2 ± 0.1 | 360 ± 10 | 300 ± 10 |
| Leu | 0.20 ± 0.01 | 57 ± 1 | 290 ± 10 |
| Ser (WT) | 3.8 ± 0.5 | 1370 ± 120 | 360 ± 20 |
| Trp | 1.1 ± 0.1 | 410 ± 20 | 380 ± 30 |
| Gly | 22 ± 4 | 5700 ± 800 | 260 ± 10 |
| His | 4.5 ± 0.5 | 1960 ± 150 | 440 ± 20 |
| Tyr | 2.5 ± 0.3 | 1050 ± 70 | 420 ± 30 |
| Gln | 17 ± 6 | 5700 ± 1800 | 340 ± 10 |
| Glu | 500 ± 10 |
Given the simulation results, these findings are consistent with the observed effects of the P14 mutations on basal factor Xa/IXa reactivity and heparin affinity arising from alterations in forward and reverse allosteric equilibrium rate constants. The observed effects of all variants except for Tyr on klim thus clearly show that the mutations markedly alter the forward allosteric equilibrium rate constant, k+2 and likely also k+3. That the P14 mutations also affect the reverse allosteric equilibrium rate constant, k−2 and likely also k−3, is implied by the observed dominant effect of all P14 mutations on the off-rate constant at I 0.15 and anticipated rate-controlling effect of k−2/k−3 on koff (37). The observed changes in K0.5 parallel those in klim, suggesting that the former arise from changes in klim ∼ k+2, because K0.5 is approximated by k+2/k+1 under conditions where k+2 ≫ k−1 that are likely to apply at the low ionic strength of our measurements. In the case of the Leu and the aromatic P14 variants, the effects on the forward allosteric equilibrium rate constant, klim, were not correlated with the effects on basal factor Xa/IXa reactivity and heparin affinity, implying an opposing effect of these mutations on the reverse allosteric equilibrium rate constant. These mutations thus appear to have both stabilizing and destabilizing effects on the native state.
The kinetics of heparin pentasaccharide binding to the fully activated P14 Glu antithrombin mutant were studied by following TNS fluorescence changes. The validity of TNS as a reporter of heparin binding was confirmed by the finding of identical kinetics of heparin binding to wild-type antithrombin when monitored by TNS or tryptophan fluorescence changes (Fig. 6B). The dependence of kobs for pentasaccharide binding to the P14 Glu antithrombin variant was linear up to the highest kobs value that was measurable (Fig. 6A), consistent with the mutation shifting the allosteric equilibrium fully into an activated conformational state that binds heparin in a simple one-step equilibrium.
Thermal Stability of P14 Mutants
To determine whether the perturbing effects of the P14 mutations on the allosteric equilibrium of antithrombin were correlated with changes in native state stability, we measured the heat stability of the antithrombin P14 variants. Melting curves for the metastable serpins were measured by monitoring changes in protein fluorescence as the temperature was increased from 40 to 74 °C. Fitting of the curves by a two-state transition from native to denatured states yielded the melting temperature from the mid-point of the transition (32). The mutants once again fell into two classes, one class showing an enhanced thermostability and the second class showing a decreased thermostability relative to wild type (Fig. 7 and Table 4). Mutants with increased thermal stability belonged to the class of nonpolar mutants that stabilized the native low reactivity state, whereas those with decreased stability belonged to the class of aromatic/polar/charged mutants that destabilized the native state and shifted the allosteric equilibrium toward the activated state. However, the magnitude of the effects on thermal stability were not well correlated with the magnitude of the activating effects of the mutations on antithrombin basal reactivity with factor Xa and factor IXa in the two classes, especially for the class of mutants that destabilized the native state.
FIGURE 7.
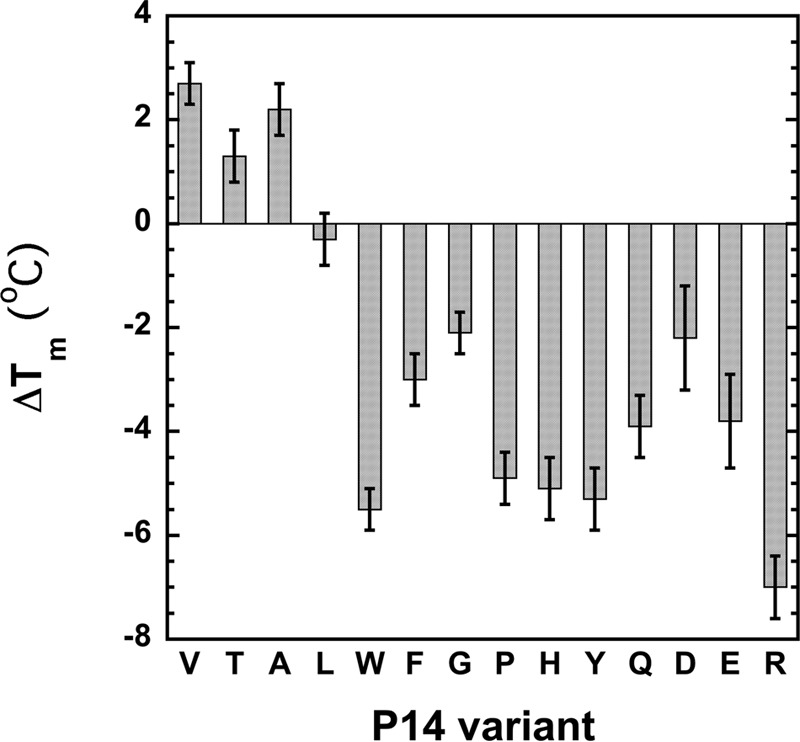
Relative thermal stabilities of antithrombin P14 variants. Melting temperatures of the indicated antithrombin variants were measured by monitoring protein fluorescence changes over a temperature range encompassing the melting transition and fitting the melting curves by the van't Hoff equation as described under “Experimental Procedures.” Shown are the differences in the melting temperatures measured for the mutants (tabulated in Table 4) from that of wild type.
TABLE 4.
Thermal stability of antithrombin P14 variants
The thermal stabilities of antithrombin P14 variants were measured from melting curves of the variants monitored by tryptophan fluorescence changes as a function of temperature as described under “Experimental Procedures.” Tm was obtained by fitting melting curves by Equation 11 as shown in the text. Data represent average values from at least two melting curves with errors representing the range of observed values. ND indicates that a value was not determined.
| P14 variant | Tm | Tm, mut- Tm, WT | ΔΔG0 |
|---|---|---|---|
| °C | °C | kcal/mol | |
| Val | 58.3 ± 0.1 | 2.7 ± 0.4 | 1.7 ± 0.5 |
| Thr | 56.9 ± 0.2 | 1.3 ± 0.5 | 0.8 ± 0.4 |
| Ala | 57.8 ± 0.2 | 2.2 ± 0.5 | 1.3 ± 0.5 |
| Leu | 55.3 ± 0.2 | −0.3 ± 0.5 | −0.2 ± 0.3 |
| Met | ND | ND | ND |
| Ser (WT) | 55.6 ± 0.3 | 0 | 0 |
| Trp | ND | −5.5 ± 0.4a | −3.4 ± 0.3 |
| Phe | 52.6 ± 0.2 | −3.0 ± 0.5 | −1.8 ± 0.1 |
| Gly | 53.5 ± 0.1 | −2.1 ± 0.4 | −1.3 ± 0.05 |
| Pro | 50.7 ± 0.2 | −4.9 ± 0.5 | −3.0 ± 0.2 |
| His | 50.5 ± 0.3 | −5.1 ± 0.6 | −3.1 ± 0.1 |
| Tyr | 50.3 ± 0.3 | −5.3 ± 0.6 | −3.2 ± 0.1 |
| Gln | 51.7 ± 0.3 | −3.9 ± 0.6 | −2.4 ± 0.1 |
| Asp | 53.4 ± 0.7 | −2.2 ± 1.0 | −1.3 ± 0.4 |
| Glu | 51.8 ± 0.6 | −3.8 ± 0.9 | −2.3 ± 0.2 |
| Arg | 48.6 ± 0.3 | −7.0 ± 0.6 | −4.3 ± 0.3 |
a Value was taken from Ref. 13.
Fluorescence Properties of P14 Variants
Allosteric activation of antithrombin by heparin is reported by an ∼40% enhancement in tryptophan fluorescence. To determine whether the allosteric activating effects of the P14 mutations were correlated with changes in the fluorescence properties of the P14 variants, we measured the fluorescence spectra of the variants in native and heparin-activated states and compared them with wild-type spectra (Table 5). The basal fluorescence of all variants was similar to or only modestly enhanced relative to wild type, except for the P14 Pro variant whose basal fluorescence significantly exceeded that of wild type. The basal fluorescence of the P14 mutants thus did not appear to correlate with the activating effects of the mutations on basal factor Xa/IXa reactivities, most notably in the case of the charged variants that appeared to be fully activated. The heparin-activated fluorescence was similar to activated wild-type fluorescence for most nonpolar aliphatic P14 variants as well as for the aromatic variants, implying similar heparin-activated states. However, Leu and Met variants as well as the charged variants showed heparin-activated fluorescence significantly reduced from wild type, whereas Gly, Pro, and Gln variants exhibited heparin-activated fluorescence much greater than wild type. The heparin-activated states of several P14 variants thus appear to exhibit fluorescence properties significantly different from heparin-activated wild type.
TABLE 5.
Fluorescence properties of antithrombin P14 variants
The tryptophan fluorescence of native and heparin pentasaccharide-activated states of antithrombin P14 variants relative to those of wild type at the emission maximum wavelength of 340 nm (λex 280 nm) were measured by acquiring spectra of equivalent concentrations of the variant and wild-type proteins in the absence and presence of saturating pentasaccharide as described under “Experimental Procedures.” Data represent at least two independent measurements with errors representing the range of observed values.
| P14 variant | Fo, var/Fo, WT | Fmax, var/Fo, WT |
|---|---|---|
| Val | 1.07 ± 0.05 | 1.36 ± 0.07 |
| Thr | 1.08 ± 0.06 | 1.49 ± 0.07 |
| Ala | 1.08 ± 0.04 | 1.42 ± 0.06 |
| Leu | 0.96 ± 0.03 | 1.20 ± 0.06 |
| Met | 0.89 ± 0.10 | 1.18 ± 0.13 |
| Ser (WT) | 1 | 1.42 ± 0.02 |
| Trpa | 1.15 ± 0.02 | 1.55 ± 0.02 |
| Phe | 1.06 ± 0.05 | 1.35 ± 0.05 |
| Gly | 1.17 ± 0.04 | 1.57 ± 0.08 |
| Pro | 1.36 ± 0.01 | 1.61 ± 0.03 |
| His | 1.06 ± 0.02 | 1.44 ± 0.04 |
| Tyr | 0.98 ± 0.04 | 1.41 ± 0.04 |
| Gln | 1.14 ± 0.04 | 1.60 ± 0.06 |
| Asp | 1.06 ± 0.11 | 1.16 ± 0.11 |
| Glu | 1.13 ± 0.02 | 1.19 ± 0.04 |
| Arg | 0.98 ± 0.05 | 1.17 ± 0.08 |
a The additional Trp residue contributes to the greater relative fluorescence of the free and heparin-bound P14 Trp variant.
Discussion
P14 Residue Is a Critical Determinant of the Allosteric Activation State of Antithrombin
Our characterization of 15 antithrombin P14 variants was undertaken to clarify the role of the RCL P14 residue of antithrombin in the mechanism of heparin allosteric activation of the serpin based on conflicting data concerning this role. In agreement with limited past mutagenesis studies (14–16), our findings have shown that mutations of the P14 residue have pronounced effects on native state stability that are correlated with comparable large effects on the allosteric activation state of the serpin. Mutants with small nonpolar aliphatic side chains (Ala, Thr, Val, and Leu) were found to enhance or have comparable thermostability relative to wild type, and this was correlated with a reduced basal reactivity with factor Xa and factor IXa as well as up to an ∼100-fold decreased heparin affinity. Contrastingly, mutants lacking a side chain (Gly) or possessing side chains that are highly constrained (Pro), bulky (Trp, Phe, Tyr, and His), polar (Gln), or charged (Asp, Glu, and Arg) were found to decrease thermal stability, and this was correlated with up to an ∼300-fold enhanced basal factor Xa and IXa reactivity and >1000-fold increased heparin affinity. That the mutations' effects on factor Xa/IXa reactivity and heparin affinity reflected alterations in an allosteric equilibrium between native and activated states was supported by rapid kinetic studies that revealed major effects on the allosteric activation rate constants of the heparin-bound mutants.
P14 Residue Effects on Allosteric Activation Are Incompatible with a Two-state Model
Although our findings appear to support an allosteric activation model suggested by past studies in which P14 mutations perturb an RCL-sheet A interaction that stabilizes the native state and thereby shifts a two-state allosteric equilibrium to favor or disfavor an activated state in which the RCL is expelled from sheet A (14–16), a number of our findings are incompatible with such a model. First, the effects of the P14 mutations on the stabilities of the native states do not correlate well with the extent to which they activate antithrombin reactivity with factors Xa and IXa, an observation inconsistent with the mutations shifting the allosteric equilibrium solely by perturbing native state stability. Second, heparin activation of the mutants normalizes their reactivities with factor Xa close to that of activated wild type but fails to do so with factor IXa, indicating that the mutations cannot just be affecting the native state but must also influence the heparin-activated state. Third, the mutations alter antithrombin affinity for heparin through changes in both ionic and nonionic interactions, implying that the mutations produce distinct heparin-activated states with different modes of heparin binding. Fourth, the effects of the P14 mutations on antithrombin basal factor Xa/IXa reactivity are correlated with effects on heparin affinity in a manner incompatible with the mutations perturbing a two-state allosteric equilibrium. Finally, the activating effects of the P14 mutations do not correlate with changes in basal tryptophan fluorescence that report allosteric activation, and heparin activation of the mutants does not normalize the fluorescence to that of activated wild type.
Three-state Allosteric Activation Model
These inconsistencies are partly explained by a more recently proposed three-state model of heparin allosteric activation of antithrombin in which activation involves both intermediate and final activated states (Scheme 2) (17, 19). In the intermediate state, structural changes in the heparin-binding site and in the RCL protease-binding site of the serpin have occurred that induce partial inhibitor activation, but the signature changes associated with full activation, i.e. the expulsion of the RCL from sheet A, have not (Scheme 2b). Partial activation is induced through structural changes in the allosteric core that promote RCL-bound protease interactions with an exosite in sheet C (12, 20). X-ray structures and kinetic studies support the existence of the intermediate-activated state and suggest that: (i) its formation is the rate-limiting step in heparin allosteric activation; (ii) it exists in an equilibrium with the fully activated state, and (iii) it accounts for most of the enhancement in antithrombin reactivity with factors Xa and IXa (17–19). Because the P14 residue is inserted into the hydrophobic core beneath sheet A in the intermediate, it will affect the stability of this partially activated state. Moreover, the intermediate activated state binds heparin with fewer ionic interactions and shows only a minor enhanced tryptophan fluorescence relative to the fully activated state (19), suggesting that the P14 residue can influence the number of ionic interactions that mediate heparin binding and the tryptophan fluorescence of the heparin-activated state by stabilizing or destabilizing the intermediate. In the fully activated state, (i) additional conformational changes are induced in the heparin-binding site that increase heparin affinity through an increased number of ionic interactions; (ii) the RCL is expelled from sheet A with an associated marked enhancement in tryptophan fluorescence, and (iii) factor Xa/IXa reactivity is modestly augmented (Scheme 2c) (19).
SCHEME 2.
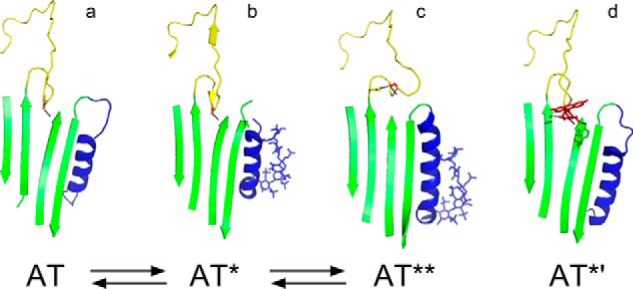
Three-state model of heparin allosteric activation of antithrombin. The scheme depicts the pre-equilibrium activation pathway involving native unactivated antithrombin (AT), intermediate-activated antithrombin (AT*), and fully activated antithrombin (AT**) states. Heparin binding to each of these states (not shown) defines a parallel induced activation pathway. a–c above the scheme show the structures of each of the three states (AT, Protein Data Bank code 1E05; AT*, Protein Data Bank code 1NQ9; AT**, Protein Data Bank code 1E03) highlighting the RCL (yellow), P14 Ser side chain (red), sheet A (green), and helix D with bound pentasaccharide in stick (blue). The structure in d is the heparin-free fluorescein-derivatized P14 Cys antithrombin variant (Protein Data Bank code 1DZH) that is fully activated and intermediate-like (AT*′). Dashed lines indicate P14 residue side chain interactions.
Need to Extend the Three-state Model
The three-state model presumes that the P14 residue affects the allosteric activation state of antithrombin through its interaction with the hydrophobic core in native and intermediate-activated states. However, P14 residues unable to interact with the core may still affect the allosteric activation state by an alternative mechanism as suggested by the x-ray structure of a highly activated P14 Cys antithrombin variant derivatized with fluorescein (16). The structure of this variant resembles native and intermediate structures in having the RCL backbone inserted into sheet A but differs from these structures in that the backbone is twisted to allow the Cys-fluorescein side chain to lie on the surface of sheet A (Scheme 2d). Moreover, the structure shows significant changes in the heparin-binding site. Surprisingly, the hydrophobic core is more like the native than the intermediate structure, despite the full activation of the variant with respect to basal factor Xa reactivity and heparin affinity (14). This suggests that activation can be achieved without the changes in the core or the changes in the RCL-sheet A interaction that are observed in heparin-activated structures. Instead, interactions of the fluorescein side chain on the surface of sheet A appear to activate this variant by disrupting a network of native state interactions that form an electrostatic link between the RCL and the heparin-binding site (16). It would thus appear that this electrostatic link may represent the relevant structural constraint in the native state that limits the ability of RCL-bound factors Xa and IXa to productively engage the antithrombin exosite and heparin to bind with high affinity.
Three-state Model Accounts for P14 Residue Effects on Allosteric Activation
A three-state allosteric activation model in which the P14 residue perturbs equilibria involving native, intermediate, and fully activated states of antithrombin through side chain interactions with the hydrophobic core or with surface residues can account for the observed effects of P14 residue mutations on the allosteric activation state of antithrombin in the absence and presence of heparin. Such a model explains why the activating effects of the P14 residue mutations on antithrombin reactivity with factors Xa/IXa in the absence of heparin are not correlated with tryptophan fluorescence changes that report allosteric activation. The wild type-like basal tryptophan fluorescence of all variants (with the exception of the Pro variant) thus implies that the allosteric equilibrium perturbed by the P14 mutations in the absence of heparin involves native and intermediate-activated states in which the P14 residue retains an interaction with sheet A, and the protein fluorescence is minimally altered from wild type.6 It follows that the position of this equilibrium will be determined by the differential stabilizing effects of P14 side chain interactions in native and intermediate states rather than just in the native state. This would explain why the P14 effects of mutations on antithrombin stability and activation are not correlated. The nonpolar aliphatic P14 residues thus enhance stability and reduce activation because these side chains interact with the hydrophobic core more favorably in the native than the intermediate state, whereas Gly and Pro variants decrease stability and are moderately activating because the absence of a side chain interaction or a constrained side chain interaction with the core is more destabilizing in the native than the intermediate state. The bulky aromatic side chains produce anomalously large decreases in stability, yet cause moderate activating effects. That these side chains insert into the hydrophobic core in native and intermediate states is supported by the previous observation that the P14 Trp variant shows a major ∼17-nm red-shift of the resolved fluorescence emission spectrum of the P14 Trp residue upon heparin activation (13). The pronounced destabilizing and moderate activating effects of these side chains thus may reflect a large destabilizing effect of side chain insertion in both native and intermediate states that is only partly relieved in the intermediate state. Charged and polar P14 residues are less destabilizing yet highly activating, consistent with these variants adopting an intermediate-like state in which the backbone is inserted into sheet A but the side chain is exposed with activation resulting from the disruption of surface residue interactions similar to the P14 fluorescein variant (14, 16).
The three-state model additionally explains why heparin activation of the mutant antithrombins does not normalize the tryptophan fluorescence of the variants to that of activated wild type and produces variable enhancements of basal fluorescence. This finding implies that heparin binding shifts the allosteric equilibrium of the antithrombin variants toward intermediate and fully activated states with the position of this equilibrium being determined by the differential stabilization of these states by P14 residue interactions. Because the two activated states bind heparin with different affinities and ionic/nonionic contributions, an equilibrium between these states accounts for our finding of different modes of heparin binding to the P14 variants involving different contributions of ionic and nonionic interactions. Because in the three-state model, the effects of the P14 mutations on factor Xa/IXa basal reactivity and on antithrombin affinities for heparin are determined by the perturbation of different allosteric equilibria, it is understandable why correlations between these parameters are inconsistent with a two-state model.7 The three-state model additionally explains our finding that heparin activation of the antithrombin P14 variants markedly affects their reactivity with factor IXa and less so with factor Xa because in the model the P14 residue influences antithrombin reactivity through interactions in both intermediate and fully activated states. X-ray structures of heparin-activated wild-type antithrombin in fact show the P14 Ser side chain making different interactions with sheet A residues in intermediate and fully activated states (Scheme 2). Antithrombin reactivity with factor IXa may be especially sensitive to P14 residue interactions in activated states because this reactivity depends on the catalytically disabled factor IXa making critical interactions with both unprimed and primed RCL residues as well as an exosite of antithrombin (11, 38). By contrast, the reactivity of the more catalytically competent factor Xa does not require the primed RCL interactions (10). Interactions of the P14 residue in the intermediate and fully activated states may thus constrain the ability of factor IXa to productively engage both the RCL and exosite and thereby affect reactivity.
SI Effects
Interestingly, both stabilizing and destabilizing P14 side chains influenced the SI of antithrombin variant reactions with proteases, with factor Xa reactions being the most affected especially when variants were activated by heparin. Both types of side chains must thus slow the rate of the RCL conformational change in which the RCL and acyl-linked protease fully insert into sheet A to trap the acyl-intermediate serpin-protease complex. This slowing increases the flux through a competing substrate pathway in which the acyl-intermediate is deacylated (35, 39). Factor Xa reactions are most affected presumably because deacylation of the factor Xa-acyl-intermediate complex is faster than that of thrombin and factor IXa acyl-intermediate complexes and thus able to better compete with the rate of the trapping RCL conformational change. The observation that all P14 residues except wild-type Ser, Ala, or Gly residues elevate the SI in reactions of heparin-activated variants with factor Xa underscores the importance of small side chains in optimizing the rate of the trapping serpin conformational change. Such SI elevations may reflect the fact that the P14 residue must reinsert into sheet A in the heparin-activated state and thereby hinder the rate of full RCL insertion. Interestingly, aromatic P14 side chains that exhibited the greatest decreases in thermal stability had the greatest effects on SI in the absence of heparin, consistent with the insertion of these side chains being most disruptive of native state structure and thus slowing the rate of full RCL insertion.
Conclusions
In summary, our studies of a large set of RCL P14 variants of antithrombin support a minimal three-step model of heparin allosteric activation of antithrombin in which native, intermediate, and fully activated states coexist in equilibrium, and these states are differentially populated in the absence and presence of heparin based on the differential stabilization of these states by P14 residue interactions with the core beneath sheet A or on the sheet A surface. The equilibrium favors native and intermediate activated states in the absence of heparin whereas heparin binding shifts the equilibrium in favor of intermediate and fully activated states because it preferentially binds to and stabilizes these states. Small nonpolar side chains provide optimal stabilization of the native state. However, the cost of greater stabilization of the native state is a reduced ability of heparin to fully activate the serpin due to the stabilization of intermediate activated states and a reduced efficiency of protease inhibition. This may explain why the highly conserved wild-type Ser side chain is optimal for antithrombin anticoagulant function. Destabilizing bulky nonpolar, polar, and charged P14 side chains disrupt native state stabilizing interactions and favor intermediate-like activated states in which the P14 residue backbone is inserted into sheet A, but the side chain may be inserted or exposed and engaged in interactions with other surface residues. The finding that destabilizing P14 side chains may activate antithrombin by engaging in surface interactions that disrupt native state interactions suggests that small molecules might bind and activate the serpin in a similar manner and provide new strategies for developing novel nonheparin-based anticoagulants.
Author Contributions
S. T. O. and P. G. W. G. designed the study; R. R. and G. I. engineered and expressed the mutant proteins; R. R., R. S., and S. T. O. collected and analyzed functional data on the proteins; S. C. B. contributed data on one of the mutants; S. T. O. wrote the manuscript, and all authors read and approved the final version of the manuscript.
This work was supported, in whole or in part, by National Institutes of Health Grant R37 HL39888 (to S. T. O.). The authors declare that they have no conflicts of interest with the contents of this article.
This article was selected as a Paper of the Week.
P14 indicates the RCL residue 14 residues N-terminal from the P1–P1′ Arg-Ser reactive bond, based on the nomenclature of Schechter and Berger (40), and equivalent to residue 380 in the human antithrombin sequence.
Heparin bridging rate enhancements of antithrombin-factor Xa reactions are attenuated in buffer lacking calcium ions due to an intramolecular interaction of the calcium-free Gla domain with the heparin-binding site of factor Xa (41).
An equivalent number of ionic interactions was obtained when wild-type antithrombin interactions with heparin pentasaccharide were measured in potassium phosphate buffer, pH 7.4, and ionic strength was increased with KCl, in keeping with model studies of charged oligopeptide interactions with heparin in which ionic strength was varied with potassium acetate (42).
The basal fluorescence properties of the Pro variant suggest native and intermediate states in which the P14-sheet A interaction is perturbed from the normal β-strand secondary structure.
Simulations show that differential perturbation of the native-intermediate and intermediate-fully activated equilibria by the P14 mutations can account for the observed slopes of the log ka, obs/log KD, obs plots of Fig. 5.
- RCL
- reactive center loop
- SI
- stoichiometry of inhibition
- TNS
- 2-p-toluidinylnaphthalene-6-sulfonate
- TAPS
- 3-{[2-hydroxy-1,1-bis(hydroxymethyl)ethyl]amino}-1-propanesulfonic acid.
References
- 1.Olson S. T., Richard B., Izaguirre G., Schedin-Weiss S., and Gettins P. G. W. (2010) Molecular mechanisms of antithrombin-heparin regulation of blood clotting proteinases. A paradigm for understanding proteinase regulation by serpin family protein proteinase inhibitors. Biochimie 92, 1587–1596 [DOI] [PMC free article] [PubMed] [Google Scholar]
- 2.van Boven H. H., and Lane D. A. (1997) Antithrombin and its inherited deficiency states. Semin. Hematol. 34, 188–204 [PubMed] [Google Scholar]
- 3.Ishiguro K., Kojima T., Kadomatsu K., Nakayama Y., Takagi A., Suzuki M., Takeda N., Ito M., Yamamoto K., Matsushita T., Kusugami K., Muramatsu T., and Saito H. (2000) Complete antithrombin deficiency in mice results in embryonic lethality. J. Clin. Invest. 106, 873–878 [DOI] [PMC free article] [PubMed] [Google Scholar]
- 4.Liu Y., Kretz C. A., Maeder M. L., Richter C. E., Tsao P., Vo A. H., Huarng M. C., Rode T., Hu Z., Mehra R., Olson S. T., Joung J. K., and Shavit J. A. (2014) Targeted mutagenesis of zebrafish antithrombin III triggers disseminated intravascular coagulation and thrombosis, revealing insight into function. Blood 124, 142–150 [DOI] [PMC free article] [PubMed] [Google Scholar]
- 5.Olson S. T., Björk I., Sheffer R., Craig P. A., Shore J. D., and Choay J. (1992) Role of the antithrombin-binding pentasaccharide in heparin acceleration of antithrombin-proteinase reactions. Resolution of the antithrombin conformational change contribution to heparin rate enhancement. J. Biol. Chem. 267, 12528–12538 [PubMed] [Google Scholar]
- 6.Bedsted T., Swanson R., Chuang Y.-J., Bock P. E., Björk I., and Olson S. T. (2003) Heparin and calcium ions dramatically enhance antithrombin reactivity with factor IXa by generating new interaction exosites. Biochemistry 42, 8143–8152 [DOI] [PubMed] [Google Scholar]
- 7.Olson S. T., and Björk I. (1991) Predominant contribution of surface approximation to the mechanism of heparin acceleration of the antithrombin-thrombin reaction. Elucidation from salt concentration effects. J. Biol. Chem. 266, 6353–6364 [PubMed] [Google Scholar]
- 8.Izaguirre G., Zhang W., Swanson R., Bedsted T., and Olson S. T. (2003) Localization of an antithrombin exosite that promotes rapid inhibition of factors Xa and IXa dependent on heparin activation of the serpin. J. Biol. Chem. 278, 51433–51440 [DOI] [PubMed] [Google Scholar]
- 9.Izaguirre G., and Olson S. T. (2006) Residues Tyr253 and Glu255 in strand 3 of β-sheet C of antithrombin are key determinants of an exosite made accessible by heparin activation to promote rapid inhibition of factors Xa and IXa. J. Biol. Chem. 281, 13424–13432 [DOI] [PubMed] [Google Scholar]
- 10.Johnson D. J., Li W., Adams T. E., and Huntington J. A. (2006) Antithrombin-S195A factor Xa-heparin structure reveals the mechanism of antithrombin activation. EMBO J. 25, 2029–2037 [DOI] [PMC free article] [PubMed] [Google Scholar]
- 11.Johnson D. J., Langdown J., and Huntington J. A. (2010) Molecular basis of factor IXa recognition by heparin-activated antithrombin revealed by a 1.7 A structure of the ternary complex. Proc. Natl. Acad. Sci. U.S.A. 107, 645–650 [DOI] [PMC free article] [PubMed] [Google Scholar]
- 12.Izaguirre G., Aguila S., Qi L., Swanson R., Roth R., Rezaie A. R., Gettins P. G., and Olson S. T. (2014) Conformational activation of antithrombin by heparin involves an altered exosite interaction with protease. J. Biol. Chem. 289, 34049–34064 [DOI] [PMC free article] [PubMed] [Google Scholar]
- 13.Huntington J. A., Olson S. T., Fan B., and Gettins P. G. (1996) Mechanism of heparin activation of antithrombin. Evidence for reactive center loop preinsertion with expulsion upon heparin binding. Biochemistry 35, 8495–8503 [DOI] [PubMed] [Google Scholar]
- 14.Huntington J. A., and Gettins P. G. (1998) Conformational conversion of antithrombin to a fully activated substrate of factor Xa without need for heparin. Biochemistry 37, 3272–3277 [DOI] [PubMed] [Google Scholar]
- 15.Futamura A., and Gettins P. G. (2000) Serine 380 (P14)→glutamate mutation activates antithrombin as an inhibitor of factor Xa. J. Biol. Chem. 275, 4092–4098 [DOI] [PubMed] [Google Scholar]
- 16.Huntington J. A., McCoy A., Belzar K. J., Pei X. Y., Gettins P. G., and Carrell R. W. (2000) The conformational activation of antithrombin. A 2.85-Å structure of a fluorescein derivative reveals an electrostatic link between the hinge and heparin binding regions. J. Biol. Chem. 275, 15377–15383 [DOI] [PubMed] [Google Scholar]
- 17.Johnson D. J., and Huntington J. A. (2003) Crystal structure of antithrombin in a heparin-bound intermediate state. Biochemistry 42, 8712–8719 [DOI] [PubMed] [Google Scholar]
- 18.Langdown J., Belzar K. J., Savory W. J., Baglin T. P., and Huntington J. A. (2009) The critical role of hinge-region expulsion in the induced-fit heparin binding mechanism of antithrombin. J. Mol. Biol. 386, 1278–1289 [DOI] [PMC free article] [PubMed] [Google Scholar]
- 19.Schedin-Weiss S., Richard B., and Olson S. T. (2010) Kinetic evidence that allosteric activation of antithrombin by heparin is mediated by two sequential conformational changes. Arch. Biochem. Biophys. 504, 169–176 [DOI] [PMC free article] [PubMed] [Google Scholar]
- 20.Gettins P. G., and Olson S. T. (2009) Activation of antithrombin as a factor IXa and Xa inhibitor involves mitigation of repression rather than positive enhancement. FEBS Lett. 583, 3397–3400 [DOI] [PMC free article] [PubMed] [Google Scholar]
- 21.Dementiev A., Swanson R., Roth R., Isetti G., Izaguirre G., Olson S. T., and Gettins P. G. (2013) The allosteric mechanism of activation of antithrombin as an inhibitor of factor IXa and factor Xa. Heparin-independent full activation through mutations adjacent to helix D. J. Biol. Chem. 288, 33611–33619 [DOI] [PMC free article] [PubMed] [Google Scholar]
- 22.Turk B., Brieditis I., Bock S. C., Olson S. T., and Björk I. (1997) The oligosaccharide side chain on Asn-135 of α-antithrombin, absent in β-antithrombin, decreases the heparin affinity of the inhibitor by affecting the heparin-induced conformational change. Biochemistry 36, 6682–6691 [DOI] [PubMed] [Google Scholar]
- 23.Olson S. T., Björk I., and Shore J. D. (1993) Kinetic characterization of heparin-catalyzed and uncatalyzed inhibition of blood coagulation proteinases by antithrombin. Methods Enzymol. 222, 525–559 [DOI] [PubMed] [Google Scholar]
- 24.Nordenman B., Nyström C., and Björk I. (1977) The size and shape of human and bovine antithrombin III. Eur. J. Biochem. 78, 195–203 [DOI] [PubMed] [Google Scholar]
- 25.Pace C. N., Vajdos F., Fee L., Grimsley G., and Gray T. (1995) How to measure and predict the molar absorption coefficient of a protein. Protein Sci. 4, 2411–2423 [DOI] [PMC free article] [PubMed] [Google Scholar]
- 26.Ersdal-Badju E., Lu A., Peng X., Picard V., Zendehrouh P., Turk B., Björk I., Olson S. T., and Bock S. C. (1995) Elimination of glycosylation heterogeneity affecting heparin affinity of recombinant human antithrombin III by expression of a β-like variant in baculovirus-infected insect cells. Biochem. J. 310, 323–330 [DOI] [PMC free article] [PubMed] [Google Scholar]
- 27.Laemmli U. K. (1970) Cleavage of structural proteins during the assembly of the head of bacteriophage T4. Nature 227, 680–685 [DOI] [PubMed] [Google Scholar]
- 28.Sturzebecher J., Kopetzki E., Bode W., and Hopfner K.-P. (1997) Dramatic enhancement of the catalytic activity of coagulation factor IXa by alcohols. FEBS Lett. 412, 295–300 [DOI] [PubMed] [Google Scholar]
- 29.Meagher J. L., Olson S. T., and Gettins P. G. (2000) Critical role of the linker region between helix D and strand 2A in heparin activation of antithrombin. J. Biol. Chem. 275, 2698–2704 [DOI] [PubMed] [Google Scholar]
- 30.Johnson K. A., Simpson Z. B., and Blom T. (2009) Global kinetic explorer: a new computer program for dynamic simulation and fitting of kinetic data. Anal. Biochem. 387, 20–29 [DOI] [PubMed] [Google Scholar]
- 31.Desai U. R., Petitou M., Björk I., and Olson S. T. (1998) Mechanism of heparin activation of antithrombin. Role of individual residues of the pentasaccharide activating sequence in the recognition of native and activated states of antithrombin. J. Biol. Chem. 273, 7478–7487 [DOI] [PubMed] [Google Scholar]
- 32.Richard B., Swanson R., Schedin-Weiss S., Ramirez B., Izaguirre G., Gettins P. G., and Olson S. T. (2008) Characterization of the conformational alterations, reduced anticoagulant activity, and enhanced antiangiogenic activity of prelatent antithrombin. J. Biol. Chem. 283, 14417–14429 [DOI] [PMC free article] [PubMed] [Google Scholar]
- 33.Lawrence D. A., Olson S. T., Palaniappan S., and Ginsburg D. (1994) Engineering plasminogen activator inhibitor-1 mutants with increased functional stability. Biochemistry 33, 3643–3648 [DOI] [PubMed] [Google Scholar]
- 34.Becktel W. J., and Schellman J. A. (1987) Protein stability curves. Biopolymers 26, 1859–1877 [DOI] [PubMed] [Google Scholar]
- 35.Gettins P. (2002) Serpin structure, mechanism, and function. Chem. Rev. 102, 4751–4804 [DOI] [PubMed] [Google Scholar]
- 36.Record M. T. Jr., Lohman M. L., and De Haseth P. (1976) Ion effects on ligand-nucleic acid interactions. J. Mol. Biol. 107, 145–158 [DOI] [PubMed] [Google Scholar]
- 37.Olson S. T., Srinivasan K. R., Björk I., and Shore J. D. (1981) Binding of high affinity heparin to antithrombin III. Stopped flow kinetic studies of the binding interaction. J. Biol. Chem. 256, 11073–11079 [PubMed] [Google Scholar]
- 38.Hopfner K. P., Brandstetter H., Karcher A., Kopetzki E., Huber R., Engh R. A., and Bode W. (1997) Converting blood coagulation factor IXa into factor Xa: dramatic increase in amidolytic activity identifies important active site determinants. EMBO J. 16, 6626–6635 [DOI] [PMC free article] [PubMed] [Google Scholar]
- 39.Lawrence D. A., Olson S. T., Muhammad S., Day D. E., Kvassman J.-O., Ginsburg D., and Shore J. D. (2000) Partitioning of serpin-proteinase reactions between stable inhibition and substrate cleavage is regulated by the rate of serpin reactive center loop insertion into β-sheet A. J. Biol. Chem. 275, 5839–5844 [DOI] [PubMed] [Google Scholar]
- 40.Schechter I., and Berger A. (1967) On the size of the active site in proteases. I. Papain. Biochem. Biophys. Res. Commun. 27, 157–162 [DOI] [PubMed] [Google Scholar]
- 41.Rezaie A. R. (1998) Calcium enhances heparin catalysis of the antithrombin-factor Xa reaction by a template mechanism: evidence that calcium alleviates Gla domain antagonism of heparin binding to factor Xa. J. Biol. Chem. 273, 16824–16827 [DOI] [PubMed] [Google Scholar]
- 42.Mascotti D. P., and Lohman T. M. (1995) Thermodynamics of charged oligopeptide-heparin interactions. Biochemistry 34, 2908–2915 [DOI] [PubMed] [Google Scholar]