

Background: Long non-coding RNAs function as competing endogenous RNAs (ceRNAs). Whether growth arrest-specific transcript 5 (GAS5) acts as a ceRNA for microRNA-222 in liver fibrosis remains undefined.
Results: GAS5 increases p27 expression as a ceRNA for microRNA-222, thereby inhibiting liver fibrosis progression.
Conclusion: The GAS5/microRNA-222/p27 axis underlies the pathogenesis of liver fibrosis.
Significance: The ceRNA network helps to understand liver fibrogenesis.
Keywords: fibrosis; hepatic stellate cell (HSC); long non-coding RNA (long ncRNA, lncRNA); microRNA (miRNA); RNA interference (RNAi); competing endogenous RNA; growth arrest-specific transcript 5; liver fibrosis; microRNA-222
Abstract
Effective control of hepatic stellate cell (HSC) activation and proliferation is critical to the treatment of liver fibrosis. Long non-coding RNAs have been shown to play a pivotal role in the regulation of cellular processes. It has been reported that growth arrest-specific transcript 5 (GAS5) acts as a crucial mediator in the control of cell proliferation and growth. However, little is known about the role and underlying mechanism of GAS5 in liver fibrosis. In this study, our results indicated that GAS5 expression was reduced in mouse, rat, and human fibrotic liver samples and in activated HSCs. Overexpression of GAS5 suppressed the activation of primary HSCs in vitro and alleviated the accumulation of collagen in fibrotic liver tissues in vivo. We identified GAS5 as a target of microRNA-222 (miR-222) and showed that miR-222 could inhibit the expression of GAS5. Interestingly, GAS5 could also repress miR-222 expression. A pulldown assay further validated that GAS5 could directly bind to miR-222. As a competing endogenous RNAs, GAS5 had no effect on primary miR-222 expression. In addition, GAS5 was mainly localized in the cytoplasm. Quantitative RT-PCR further demonstrated that the copy numbers of GAS5 per cell are higher than those of miR-222. GAS5 increased the level of p27 protein by functioning as a competing endogenous RNA for miR-222, thereby inhibiting the activation and proliferation of HSCs. Taken together, a new regulatory circuitry in liver fibrosis has been identified in which RNAs cross-talk by competing for shared microRNAs. Our findings may provide a new therapeutic strategy for liver fibrosis.
Introduction
Liver fibrosis, characterized by abundant deposition of extracellular matrix and distortion of normal liver architecture, is the common outcome of many chronic liver diseases. The activation of hepatic stellate cells (HSCs)3 is generally considered to be a pivotal step in the initiation, as well as the progression, of liver fibrosis (1). Therefore, the inhibition of HSC activation is regarded as a potential therapeutic target for liver fibrosis.
Over the past decade, high throughput transcriptome analysis has revealed that about 90% of the human genome is actively transcribed with protein-coding genes accounting for only around 2% of the human genome (2). Therefore, plentiful non-coding RNAs are transcribed from the genome. Among these non-coding RNAs are siRNAs, microRNAs (miRNAs), small nucleolar RNAs, PIWI (P-element-induced wimpy testis)-interacting RNAs, natural antisense transcripts, and long non-coding RNAs (lncRNAs). miRNAs are short RNA sequences that negatively manipulate gene expression by pairing with partially or fully complementary target sequences in the 3′-UTRs of mRNAs to prohibit translation or accelerate degradation. miRNAs are involved in various biological processes, such as cell proliferation, development, differentiation, and metabolism (3, 4). Dysregulated miRNA expression has been linked to progression of liver fibrosis (5). It has been reported that microRNA-21 (miR-21), miR-222, miR-221, miR-199a, and miR-17-5p are up-regulated upon HSC activation (6–9). In contrast, miR-19b, miR-15b, miR-16, miR-150, and miR-29a/b expression levels decrease during the progression of liver fibrosis (10–13). The expression of miR-222, one of the most studied miRNAs, increases with the progression of liver fibrosis, and this significantly correlates with the expression of collagen 1a1 (Col1A1) and smooth muscle α-actin (α-SMA) mRNA during liver fibrosis (7). It is known that nuclear factor κB can regulate the expression of miR-222, but whether there is another regulatory mechanism for this miRNA has yet to be elucidated.
lncRNAs of between 200 bp and 100 kb in length play a crucial role in the regulation of gene expression by affecting chromatin modification, transcription, or post-transcriptional processing (14–16). Growth arrest-specific transcript 5 (GAS5) was initially isolated from mouse NIH 3T3 cells using subtraction hybridization (17). GAS5 is thought to play a role in the progression of some types of cancer and has been shown to be down-regulated in breast cancer and gastric cancer (18, 19). It is therefore a therapeutic target for gastric cancer and has been proposed as a potential biomarker for poor prognosis (19). GAS5 has also been shown to promote the apoptosis of prostate cancer cells, and decreased expression of GAS5 may lower the effectiveness of chemotherapeutic drugs in prostate cancer patients (20, 21). GAS5 expression is both essential and sufficient for normal growth arrest in T cell lines and human peripheral blood T cells (22). However, the role of GAS5 in liver fibrosis remains elusive. There is evidence that some lncRNAs can function as competing endogenous RNAs (ceRNAs) for miRNAs (23, 24). Whether GAS5 can act as a ceRNA for miR-222 in mouse liver fibrosis needs to be addressed.
In this study, we showed that the expression of GAS5 is down-regulated in fibrotic liver tissues and in activated HSCs. Importantly, overexpression of GAS5 alleviated the activation of primary HSCs in vitro and reduced the accumulation of collagen in vivo. In addition, we discovered that GAS5 increases the level of p27 protein by functioning as a ceRNA for miR-222, thereby inhibiting the activation and proliferation of HSCs.
Experimental Procedures
Carbon Tetrachloride (CCl4) Liver Injury Model
Eight-week-old male C57BL/6J mice were given a biweekly intraperitoneal dose of a 10% solution of CCl4 (Sigma-Aldrich) in olive oil (7 μl/g/mouse) for 8 weeks. Control mice were treated intraperitoneally with the same volume of olive oil at the same time intervals. Sprague-Dawley (180–220 g) rats were injected intraperitoneally with a 0.5 ml/kg mixture of CCl4 and olive oil (1:1 (v/v)) twice a week for 8 weeks. Bile duct ligation was performed as described previously (25). Briefly, mice or rats were anesthetized with isoflurane, and the abdomen was opened by a midline incision. The common bile duct was identified and cut between ligatures of non-resorbable thread. Sham-operated mice or rats were used as the control. Partial livers were fixed, embedded in paraffin, and processed for histology. Partial liver samples were stained by H&E staining, Masson staining, and Sirius Red staining. The Masson stain-positive areas were analyzed in sections from all mice (at least 10 independent fields from each section) by histomorphometry using Olympus Cell (Olympus Soft Imaging Solutions GmbH, Münster, Germany) and ImageJ software, respectively. The other liver tissues were immediately snap frozen in liquid nitrogen and stored at −80 °C for later analysis. Experiments were conducted in accordance with the principles outlined in the Animal Experimentation Ethics Committee Guide for the Care and Use of Laboratory Animals and were approved by the Institutional Animal Care and Use Committee of Fudan University.
Human Specimens
Twenty patients with liver cirrhosis and 15 control patients were enrolled for the study from patients undergoing partial liver resection or liver biopsy in the First Affiliated Hospital of Wenzhou Medical University and Ningbo Yinzhou Second Hospital. Informed consent was obtained from all patients. This study was performed in accordance with the Helsinki Declaration of 1975 (2008 revision) and approved by the Ethics Committee of the First Affiliated Hospital of Wenzhou Medical University and Ningbo Yinzhou Second Hospital Ethics Committee. The characteristics of the patients are listed in Table 1.
TABLE 1.
Human subjects
HBV, hepatitis B virus; HCV, hepatitis C virus; ALT, alanine aminotransferase; AST, aspartate aminotransferase.
| Parameters | Patients | Controls |
|---|---|---|
| Cases (n) | 20 | 15 |
| Sex (n (%)) | ||
| Male | 16 (80) | 11 (73.3) |
| Female | 4 (20) | 4 (26.7) |
| Age ± S.D. (years) | 46.6 ± 4.8 | 45.1 ± 7.8 |
| Etiology (n (%)) | ||
| Alcoholic | 1 (5) | |
| HBV | 18 (90) | |
| HCV | 1 (5) | |
| Serum ALT (units/liter) | 96.8 ± 38.7 | 33.4 ± 8.8 |
| Serum AST (units/liter) | 106.0 ± 22.7 | 25.3 ± 4.9 |
Isolation of Primary HSCs
Liver was sequentially in situ perfused with EGTA, Pronase, and collagenase NB4G at 37 °C for 30 min. After centrifugation of the resulting cell suspension at 25 × g for 5 min, the supernatant was collected and further centrifuged at 400 × g for 10 min. HSCs were isolated from non-parenchymal cells using density gradient centrifugation (OptiPrep, Axis-Shield PoC AS, Oslo, Norway) at 1400 × g for 20 min. HSCs were maintained in DMEM containing 10% FBS, 100 units/ml penicillin, and 100 μg/ml streptomycin. The cells were incubated at 37 °C with 5% CO2, and culture medium was replaced every 48 h unless otherwise stated.
Overexpression of GAS5 in Vitro and in Vivo
HSCs were transduced with lentiviral vector expressing GAS5 (Lenti-GAS5) or empty vector (Lenti-NC) (Shanghai Shinegene Molecular Biotechnology Co., Ltd., Shanghai, China). HSCs were transduced by Lenti-GAS5 at a multiplicity of infection (m.o.i.) of 10, 20, 40, 60, 80, and 100, respectively. After 48 h, the optimal m.o.i. was 60 according to transfection efficiency. Therefore, the next experiments were conducted using am m.o.i. of 60 unless otherwise indicated. In a dose dependence experiment, HSCs were transduced by Lenti-GAS5 at an m.o.i. of 20, 40, and 60, respectively. The miRNA negative control (miR-NC), miRNA mimics, or miRNA inhibitors (Shanghai GenePharma Co., Ltd., Shanghai, China) were transfected using Lipofectamine 2000 reagent (Life Technologies) following the manufacturers' protocols. After 48 h, cells were harvested for further analysis. Twenty-four mice were randomly divided into four groups as follows: olive oil (control; n = 6), model (CCl4; n = 6), CCl4 combined with Lenti-NC (Lenti-NC; n = 6), and CCl4 combined with Lenti-GAS5 (Lenti-GAS5; n = 6). Lenti-GAS5 (1 × 10⁹ transducing units/100 μl) or Lenti-NC was injected once 1 day before CCl4 injection via the tail vein. These mice were euthanized 4 weeks after CCl4 treatment.
RNAi Assay
RNA interference experiments were performed following the manufacturer's protocols. p27 siRNA1 (sense, 5′-CGAGUCAGCGCAAGUGGAdTdT-3′; antisense, 5′-UCCACUUGCGCUGACUCGCdTdT-3′), p27 siRNA2 (sense, 5′-AGCAUUGGAUGUAGCAUUGdTdT-3′; antisense, 5′-CAAUGCUACAUCCAAUGCUdTdT-3′), p27 siRNA3 (sense, 5′-CAGCUCCGAAUUAAGAAUAdTdT-3′; antisense, 5′-UAUUCUUAAUUCGGAGCUGdTdT-3′), and scrambled siRNA (negative control) were designed and synthesized by Shanghai GenePharma Co., Ltd. The siRNAs were transfected into cells using Lipofectamine 2000.
Cell Proliferation Assay
Cell proliferation was measured as active DNA synthesis using the Click-iT ethynyl deoxyuridine (EdU) cell proliferation assay kit (Life Technologies). Freshly isolated mouse HSCs were plated in the presence of PDGF-bb (20 ng/ml; Prospec, Ness-Ziona, Israel). About 48 h after EdU labeling, cells were formalin-fixed. Visualization of EdU incorporation was performed according to the manufacturer's instructions. The ratio of EdU-incorporated cells to total cells was calculated.
Luciferase Activity Assay
The interaction between GAS5 or the p27 3′-UTR with miR-222 was analyzed as described previously (26). Approximately 400-bp fragments including the putative target region were obtained by PCR. To analyze the interaction between GAS5 and miR-222, the following oligonucleotides were used: forward, 5′-GCTCTAGAGCGGAGGGGCATGACTAGAACA-3′, and reverse, 5′-CGAGCTCGGTGGCACTGTCCTTTCAACC-3′. To analyze the interaction between the p27 3′-UTR and miR-222, the following oligonucleotides were used: forward, 5′-GCTCTAGAGCTGTTACTCTAGTGTCTTCTCCCT-3′, and reverse, 5′-CGAGCTCGTGACTCCTCAGCCCCACC-3′. To generate mutated constructs, approximately 400-bp fragments including the mutated target region were synthesized by Shanghai GenePharma Co., Ltd. These constructs were subcloned into pmirGLO plasmids (Promega, Madison, WI) following the manufacturer's instructions. The resulting plasmids were named pmirGLO-GAS5, pmirGLO-GAS5-mut, pmirGLO-p27, and pmirGLO-p27-mut. Empty vector pmirGLO, lacking the inserts, was used as a negative control. The 293T cells were cultured in 24-well plates and transfected with pmirGLO-GAS5 or pmirGLO-p27 together with miR-222 mimics or miR-NC. Lipofectamine 2000 reagent was used for the transfection. About 48 h after transfection, the Dual-Glo Luciferase Assay System (Promega) was used to analyze luciferase expression according to the manufacturer's instructions.
Pulldown Assay with Biotinylated miR-222 (Bio-miR-222)
Biotin pulldown was performed as previously described (27). Briefly, after 48 h of primary activated HSCs transfected with Bio-miR-222-WT, Bio-miR-222-mut, or Bio-miRNA negative control (Bio-miR-NC), they were washed with PBS followed by incubation in a lysis buffer for 10 min. To exclude RNA and protein complexes, the beads were blocked in lysis buffer including RNase-free bovine serum albumin (BSA) and yeast tRNA (Sigma). After the lysates were incubated with streptavidin-coated magnetic beads (Life Technologies) at 4 °C for 4 h, they were washed twice with lysis buffer, three times with a low salt buffer, and once with a high salt buffer. The bound RNAs were isolated using TRIzol reagent (Life Technologies). GAS5 expression was determined by quantitative real time PCR (qRT-PCR).
Immunofluorescence and Immunohistochemistry
Cells were sequentially fixed with 4% paraformaldehyde, permeabilized in 0.3% Triton X-100 (Sigma), blocked with 5% BSA, and then incubated with mouse α-SMA antibody (ab7817, Abcam, Cambridge, MA) overnight at 4 °C. Antibody binding was visualized using Alexa Fluor 568-labeled rabbit anti-mouse IgG (A-11061, Life Technologies). Images were taken using a Carl Zeiss LSM710 confocal microscope (Carl Zeiss AG, Jena, Germany). Liver tissues were sequentially fixed in 10% formalin solution, embedded in paraffin, and sectioned. Slides were sequentially dewaxed, dehydrated, and subjected to antigen retrieval. The sections were then treated with 0.3% hydrogen peroxide. After blocking with BSA, the sections were incubated with primary antibody against α-SMA (Abcam) overnight at 4 °C and then biotinylated secondary antibody for 60 min at room temperature. 3,3′-Diaminobenzidine staining was performed to visualize α-SMA expression. The expression of α-SMA protein was analyzed by histomorphometry using Olympus Cell. A minimum of 15 fields per sample was quantified.
Hepatic Hydroxyproline Assay
Hepatic collagen was analyzed according to the manufacturer's protocols. Briefly, after liver samples were hydrolyzed with HCl at 110 °C for 16 h, the supernatants were sequentially evaporated by a vacuum concentrator, dissolved in distilled water, filtered, and treated with chloramine T/citrate-acetate buffer. Then samples were incubated with Ehrlich's reagent. Samples were detected at 561 nm, and the liver hydroxyproline content was analyzed using the Hydroxyproline Colorimetric Assay kit (Sigma).
qRT-PCR
Total RNA was extracted from cells or liver tissues using TRIzol reagent (Life Technologies). To detect GAS5 expression, complementary DNA (cDNA) was generated with random primers. Cytoplasmic and nuclear GAS5 was isolated from HSCs using cytoplasmic and nuclear RNA purification kits (Norgen, Thorold, Canada) as detailed previously (28). Briefly, cells were incubated with lysis buffer and then centrifuged. The supernatant and pellet were mixed with 1.6 mol/liter sucrose solution and layered on the top of two sucrose solutions in two respective tubes. After both fractions were centrifuged, the cytoplasmic fraction and the nuclear pellet were collected and purified according to the manufacturer's instructions. GAPDH was used as an internal control for validation of the nuclear and cytoplasmic RNA results. To detect mRNA expression, the cDNA was reverse transcribed using the PrimeScriptTM 1st Strand cDNA Synthesis kit (TaKaRa Biotechnology, Dalian, China) according to the manufacturer's instructions. To detect miRNA expression, total RNA was extracted using an miRNeasy Mini kit (Qiagen, Valencia, CA) in accordance with the manufacturer's instructions. Gene expression was determined by RT-PCR using cDNA, KAPA SYBR FAST qPCR kit Universal Master Mix (2×) (KapaBiosystems, Boston, MA), and a set of gene-specific primers. The primer sequences are shown in Table 2. All procedures were performed using the 7900HT Fast Real-Time PCR system (Applied Biosystems, Foster City, CA). The GAPDH and U6 small nuclear RNA levels were used to normalize the relative abundance of mRNAs and miRNAs, respectively. Relative gene expression was calculated using the 2−ΔΔCt method. To detect the absolute amounts of GAS5 and miR-222, absolute quantification by qRT-PCR was performed as described previously (29). Briefly, GAS5-expressing vector and reverse transcribed miR-222 cDNA were used as standard templates to establish standard curves with limit dilution methods. The exact number of gene copies of GAS5 and miR-222 per cell were calculated using their molecular weights and cell counts.
TABLE 2.
List of primer sequences
| Gene | Sequence (5′–3′) |
|---|---|
| Mouse GAPDH | |
| Forward | TGCACCACCAACTGCTTAG |
| Reverse | GGATGCAGGGATGATGTTC |
| Mouse Col1A1 | |
| Forward | CCTGGCAAAGACGGACTCAAC |
| Reverse | GCTGAAGTCATAACCGCCACTG |
| Mouse α-SMA | |
| Forward | TCCCTGGAGAAGAGCTACGAACT |
| Reverse | AAGCGTTCGTTTCCAATGGT |
| Mouse GAS5 | |
| Forward | GGATAACAGAGCGAGCGCAAT |
| Reverse | CCAGCCAAATGAACAAGCATG |
| Mouse p27 | |
| Forward | AAGCACTGCCGGGATATG |
| Reverse | GTAGTAGAACTCGGGCAAGCTG |
| Mouse miR-222 | |
| Forward | ACACTCCAGCTGGGAGCTACATCTGGCTA |
| Reverse | TGGTGTCGTGGAGTCG |
| RT | CTCAACTGGTGTCGTGGAGTCGGCAATT |
| CAGTTGAGACCCAG | |
| Mouse pri-miR-222 | |
| Forward | CACAACGAGATGTCTTTC |
| Reverse | GAAGTCTTCCGATGTTTAACAG |
| Mouse U6 | |
| Forward | CTCGCTTCGGCAGCACA |
| Reverse | AACGCTTCACGAATTTGCGT |
| Rat GAPDH | |
| Forward | TTCAACGGCACAGTCAAG |
| Reverse | GTAGACTCCACGACATACTCAG |
| Rat GAS5 | |
| Forward | TCTCACAGGCAGTTCTGTGG |
| Reverse | ATCCATCCAGTCACCTCTGG |
| Human GAPDH | |
| Forward | GCACCGTCAAGGCTGAGAAC |
| Reverse | TGGTGAAGACGCCAGTGGA |
| Human GAS5 | |
| Forward | CTTCTGGGCTCAAGTGATCCT |
| Reverse | TTGTGCCATGAGACTCCATCAG |
Western Blot Analysis
Total proteins were prepared by standard procedures and quantified using a bicinchoninic acid protein assay kit (Beyotime Biotechnology, Jiangsu, China). Protein was loaded onto an SDS-polyacrylamide gel. After electrophoresis, the protein was transferred onto a PVDF membrane (Millipore, Billerica, MA). The membrane was incubated with primary antibodies overnight at 4 °C and then with secondary IRDye800-conjugated goat anti-mouse IgG or goat anti-rabbit IgG at 37 °C for 1 h. The antibodies are listed in Table 3. Antibody binding was detected using an Odyssey infrared scanner (LI-COR Biosciences Inc., Lincoln, NE).
TABLE 3.
Antibodies used in Western blotting
| Antigens | Poly/monoclonal | Manufacturer | Dilution |
|---|---|---|---|
| β-Actin | Monoclonal | Abcam, Cambridge, MA (ab6276) | 1:4000 |
| Col1A1 | Monoclonal | Abcam (ab6308) | 1:1500 |
| α-SMA | Monoclonal | Abcam (ab7817) | 1:3000 |
| p27 | Polyclonal | Abcam (ab7961) | 1:1500 |
| IRDye800-conjugated rabbit anti-mouse IgG | Polyclonal | Rockland, Limerick, PA (610-431-002) | 1:2000 |
| IRDye800-conjugated goat anti-rabbit IgG | Polyclonal | Rockland (611-131-002) | 1:2000 |
Statistical Analysis
The experimental data were evaluated by calculating the mean ± S.D. Differences between multiple groups were evaluated using one-way analysis of variance. Differences between two groups were compared using a Student's t test. The significance level was set at p < 0.05 with p < 0.01 indicating a strongly significant difference. All statistical analyses were calculated using SPSS 13.0 (IBM, Armonk, NY).
Results
GAS5 Is Down-regulated in Liver Fibrosis and in Activated HSCs
To determine whether GAS5 expression is altered during liver fibrosis, the degree of liver fibrosis was evaluated by staining with Sirius Red (Fig. 1A). qRT-PCR results demonstrated that the levels of Col1A1 and α-SMA in CCl4 mice were increased compared with those in control mice (Fig. 1F). However, GAS5 expression was down-regulated in CCl4 mice (Fig. 1G). The reduction of GAS5 during fibrosis progression was also observed in another mouse liver fibrosis model of bile duct ligation (Fig. 1, B and H). Interestingly, the decrease in GAS5 in liver fibrosis was not limited to mice. Our results indicated that the level of GAS5 was also reduced in two kinds of Sprague-Dawley rat liver fibrosis models (Fig. 1, C, D, I, and J) and human cirrhotic liver tissues (Fig. 1, E and K). The results obtained suggested that the reduction of GAS5 is a common phenomenon during tissue repair in different species.
FIGURE 1.

The level of GAS5 in fibrotic liver tissues and primary activated HSCs. A and G, CCl4-induced mouse liver fibrosis model was evaluated by Sirius Red staining, and the level of GAS5 was analyzed by qRT-PCR. n = 9 mice per group. Scale bars, 100 μm. B and H, bile duct ligation-induced mouse liver fibrosis model was evaluated by Masson staining, and the level of GAS5 was analyzed by qRT-PCR. n = 9 mice per group. Scale bars, 100 μm. C and I, CCl4-induced rat liver fibrosis model was evaluated by Masson staining, and the level of GAS5 was analyzed by qRT-PCR. n = 9 mice per group. Scale bars, 100 μm. D and J, bile duct ligation-induced rat liver fibrosis model was evaluated by H&E staining, and the level of GAS5 was analyzed by qRT-PCR. n = 9 mice per group. Scale bars, 100 μm. E and K, human normal (n = 15) and cirrhotic liver tissues (n = 20) were evaluated by Masson staining, and the level of GAS5 was analyzed by qRT-PCR. Scale bars, 100 μm. F, the mRNA levels of Col1A1 and α-SMA in mouse normal liver tissues and fibrotic liver tissues were measured by qRT-PCR. n = 9 mice per group. L and M, the levels of Col1A1, α-SMA, and GAS5 in primary HSCs at day 10 and day 2. N, the level of GAS5 in HSCs isolated from olive oil/CCl4-treated mice. n = 3 mice per group. The data are expressed as the means ± S.D. (error bars). **, p < 0.01. Ctrl, control.
Based on the data obtained from fibrotic liver tissues, we inferred that HSCs may account for the reduction in GAS5. Primary HSCs isolated from normal male C57BL/6J mice that mimicked the in vivo activation process were cultured. Our results indicated that the mRNA expression of Col1A1 and α-SMA was increased by 6.9- and 9.7-fold, respectively, at day 10 relative to day 2 (Fig. 1L). By contrast, GAS5 expression at day 10 was decreased by 65% compared with that at day 2 (Fig. 1M). In addition, we further analyzed the level of GAS5 in isolated HSCs from mice after 8-week CCl4 treatment. In comparison with oil-treated mice, the level of GAS5 was remarkably decreased in isolated HSCs from CCl4-treated mice (Fig. 1N). These results indicated that the reduction of GAS5 expression is related to HSC activation during the progression of liver fibrosis.
GAS5 Inhibits the Activation of HSCs in Vitro
Next, we investigated the effect of GAS5 on the activation of HSCs. Compared with the control, primary HSCs transduced with Lenti-GAS5 showed decreased mRNA levels of Col1A1 and α-SMA (Fig. 2A). The protein levels of type I collagen and α-SMA were also markedly decreased by Lenti-GAS5 transduction (Fig. 2, B and C). Immunocytochemical analysis of α-SMA protein (as a marker of activated HSCs) validated the reduced levels of red fluorescence and actin fibers (Fig. 2D). These results demonstrated that GAS5 can inhibit the activation of HSCs.
FIGURE 2.

GAS5 represses HSC activation in vitro. A, the mRNA levels of Col1A1 and α-SMA were analyzed by qRT-PCR in primary HSCs 48 h after transduction with Lenti-GAS5. B and C, the protein levels of type I collagen and α-SMA were analyzed by Western blotting in primary HSCs 48 h after transduction with Lenti-GAS5. Western blot analysis was conducted three times with similar results. D, representative images of fluorescence immunocytochemical analysis of α-SMA protein (red) in primary HSCs 48 h after transduction with Lenti-GAS5; DAPI staining (blue) was used to indicate cell nuclei. Scale bars, 50 μm. The data are expressed as the means ± S.D. (error bars) of at least three independent experiments. **, p < 0.01. Ctrl, control.
GAS5 Functions as a Potential Liver Fibrosis Suppressor in Vivo
To better understand the role of GAS5 in the progression of liver fibrosis, Lenti-GAS5 was intravenously injected into mice 1 day before the first injection of CCl4. After 4 weeks of CCl4 treatment, delivery of Lenti-GAS5 effectively increased the expression of GAS5 compared with the CCl4 group (Fig. 3A). Quantification of liver hydroxyproline content indicated the reduction of liver fibrosis in Lenti-GAS5-treated mice (Fig. 3B). In addition, overexpression of GAS5 resulted in lower mRNA and protein expression of Col1A1 and α-SMA compared with the CCl4 group (Fig. 3, C and D). The increased expression of GAS5 also reduced the accumulation of collagen as measured by Masson staining (Fig. 3, E and G). Immunohistochemistry results indicated that the expression of α-SMA in Lenti-GAS5-treated mice was reduced compared with the CCl4 group (Fig. 3, F and H). Taken together, these results demonstrated that the progression of liver fibrosis can be inhibited by GAS5 overexpression in vivo.
FIGURE 3.

Repressive role of GAS5 in the progression of liver fibrosis in vivo. A, hepatic GAS5 expression was analyzed by qRT-PCR. B, the level of hepatic hydroxyproline content was expressed as hydroxyproline (μg)/liver, wet weight (g). n = 6 mice per group. C, the mRNA expression of Col1A1 and α-SMA was determined by qRT-PCR. D, the protein expression of type 1 collagen and α-SMA was determined by Western blotting. Western blot analysis was repeated twice with a similar trend. E and G, accumulation of collagen was assessed by Masson staining. Scale bars, 100 μm. F and H, hepatic α-SMA protein expression was determined by an immunohistochemical assay. n = 6 mice per group. The data are expressed as the means ± S.D. (error bars). ** and ##, p < 0.01. Ctrl, control.
GAS5 Is a Target of miR-222
Bioinformatics analysis (RNA22) for miRNA recognition sequences on GAS5 revealed the presence of a putative miR-222 site (Fig. 4D). The potential relationship between GAS5 and miR-222 was examined in fibrotic and normal liver tissues. As shown in Fig. 4A, the expression of miR-222 was up-regulated in liver fibrosis. In addition, the expression of miR-222 was increased in HSCs at day 10 compared with day 2 (Fig. 4B). Then we further investigated the possible role of miR-222 in the deregulation of GAS5. Compared with the control, miR-222 mimics down-regulated the expression of GAS5 (Fig. 4C). To validate whether miR-222 directly inhibits GAS5 expression and whether this inhibition operates via the putative miR-222 binding site, the GAS5 target region was cloned into the pmirGLO plasmid. The construct was transfected into 293T cells alongside miR-222 mimics and an miR-NC. In pmirGLO-GAS5, luciferase expression was reduced by 54% with the miR-222 mimics relative to the miR-NC (Fig. 4E). In pmirGLO-GAS5-mut, miR-222 mimics resulted in no inhibition of luciferase activity compared with the miR-NC. To summarize, miR-222 decreased the expression of GAS5 through the miR-222 binding site.
FIGURE 4.

Effect of miR-222 on the level of GAS5. A, relative gene expression of miR-222 in normal liver tissues (n = 9) and fibrotic liver tissues (n = 9). B, the levels of miR-222 in primary HSCs at day 10 and day 2. C, effect of miR-222 on the level of GAS5. D, schematic representation of the miRNA binding sites in the GAS5 sequence based on RNA22 software. E, reporter gene assay to validate the interaction between GAS5 and miR-222 in 293T cells. F, effect of miR-21 on the level of GAS5. G, effect of miR-221 on the level of GAS5. H, effect of miR-199a on the level of GAS5. I, effect of miR-200b on the level of GAS5. J, effect of miR-181b on the level of GAS5. K, schematic diagram of the wild type and mutated form of the miR-222 sequence. L, pulldown assay to validate the direct interaction between GAS5 and miR-222. Bio-miR-NC is not complementary to GAS5. The data are expressed as the means ± S.D. (error bars) of at least three independent experiments. **, p < 0.01; NS, not significant. Ctrl, control.
Next we investigated whether other up-regulated miRNAs in liver fibrosis can also inhibit the level of GAS5. Prior studies (30–33) indicate that miR-21, miR-221, miR-199a, miR-200b, and miR-181b are the five most common up-regulated miRNAs in liver fibrosis. Bioinformatics analysis demonstrated that GAS5 was not the target of the above miRNAs (data not shown). Then we transfected the above miRNAs into HSCs using Lipofectamine 2000. As expected, miR-21, miR-221, miR-199a, miR-200b, and miR-181b did not suppress the level of GAS5 compared with the control (Fig. 4, F, G, H, I, and J).
To further confirm the interaction between miR-222 and GAS5, we applied a Bio-miR-222 pulldown assay to detect whether miR-222 can pull down GAS5. Our results indicated that Bio-miR-222 could pull down GAS5 compared with the Bio-miR-NC. However, Bio-miR-222-mut resulted in the inability to pull down GAS5 because mutations disrupted their base pairing (Fig. 4, K and L), indicating that there is a direct interaction between miR-222 and GAS5. Taken together, our data indicated that miR-222 is able to directly bind to GAS5.
GAS5 Controls miR-222 and Its Target
miRNAs can target lncRNAs as well as protein-coding genes (13, 34). Among the many predicted targets of miR-222, we focused on p27, a key inhibitor of the cell cycle, that may decrease activation and proliferation of HSCs. Our results showed that luciferase activity of pmirGLO-p27 was inhibited by miR-222 mimics, whereas luciferase activity of pmirGLO-p27-mut was not decreased (Fig. 5, A and B). These findings indicated that p27 is a target of miR-222, confirming the previous reports (7, 35).
FIGURE 5.

Effect of GAS5 on the levels of miR-222 and p27. A, schematic of the miRNA binding sites in the 3′-UTR of p27 mRNA determined using Targetscan software. B, reporter gene assay to validate the interaction between the 3′-UTR of p27 mRNA and miR-222 in 293T cells. C, effect of GAS5 on the level of miR-222. D and E, the effect of GAS5 on the protein level of p27 was regulated by miR-222 mimics or miR-222 inhibitor. Western blot analysis was conducted three times with similar results. F, the levels of pri-miR-222 and miR-222 in the cytoplasmic and nuclear fractions by qRT-PCR. G, the subcellular location of GAS5 in HSCs by qRT-PCR. H, effect of GAS5 on the level of pri-miR-222. I, copy numbers of GAS5 and miR-222 per cell in primary HSCs were quantified with qRT-PCR. J, dose-dependent up-regulation of p27 protein by GAS5 overexpression. Western blot analysis was conducted three times with similar results. The data are expressed as the means ± S.D. (error bars) of at least three independent experiments. ** and ##, p < 0.01; NS, not significant. Ctrl, control.
Because miR-222 can regulate GAS5, we deduced that GAS5 may also mediate miR-222 and its target in the same way. As shown in Fig. 5C, overexpression of GAS5 reduced the expression of miR-222 compared with the control. The effect of GAS5 on the expression of p27 protein was then investigated (as shown in Fig. 5, D and E). Cells were transfected with Lenti-GAS5 only, Lenti-GAS5 and miR-222 mimics, or Lenti-GAS5 and miR-222 inhibitor. Our results indicated that the level of p27 protein in Lenti-GAS5-transduced cells was increased compared with control cells. Compared with Lenti-GAS5 alone, cells transfected with miR-222 mimics showed decreased levels of p27 protein, whereas cells transfected with miR-222 inhibitor showed increased levels of p27 protein. These data indicated the existence of specific cross-talk between GAS5 and p27 through competition for miR-222 binding.
Next we further validated whether GAS5 can serve as a ceRNA. Han et al. (36) indicated that the ceRNA network occurs preferentially in the cytoplasm. Therefore, we examined the subcellular location of GAS5 in activated HSCs by qRT-PCR. Given that pri-miRNA is located in the nucleus and mature miRNA is located in the cytoplasm, we determined the purity of the cytoplasmic and nuclear fractions obtained through detection of pri-miR-222 and miR-222. Our results revealed that the level of pri-miR-222 in the cytoplasm was about 2.3% of that in the nucleus. In contrast, the level of miR-222 in the nucleus was about 2.1% of that in the cytoplasm (Fig. 5F). Then we analyzed the expression of GAS5 in the highly purified cytoplasmic and nuclear fractions. Our results indicated that the expression of GAS5 in the cytoplasm was higher than that in the nucleus (Fig. 5G) in line with previous reports (34, 37, 38). If GAS5 indeed acts as a ceRNA, then it should regulate the expression of miR-222 at the post-transcriptional level. Then we examined the effect of GAS5 on the level of pri-miR-222. As expected, overexpression of GAS5 had no effect on the level of pri-miR-222 (Fig. 5H). Additionally, Wang et al. (29) showed that the abundance of lncRNA must be comparable with or higher than miRNA if lncRNA serves as a ceRNA. Accordingly, we investigated the copy numbers of GAS5 and miR-222 per cell. As shown in Fig. 5I, in 2-day-old HSCs, miR-222 expression was about nine copies per cell, whereas GAS5 expression was 473 copies per cell. In 10-day-old HSCs, miR-222 expression was increased to 138 copies per cell, whereas GAS5 expression was reduced to 189 copies per cell. However, GAS5 expression was still higher than miR-222 expression. Our results provided further evidence that GAS5 may become a ceRNA for miR-222. Finally, it is reasonable that the relative concentration of GAS5 will affect expression of the target protein. As indicated in Fig. 5J, at the same concentration of miR-222 mimics, there was a gradual increase in the level of p27 protein as we increased the dose of GAS5 from 20 m.o.i. to 60 m.o.i., revealing that the elevated effect of GAS5 on the level of p27 protein exhibits a dose-dependent relationship. In summary, these data indicated that GAS5, by binding to miR-222, influences the level of p27 protein.
GAS5 Inhibits Activation and Proliferation of HSCs through Regulation of miR-222 and p27
We successfully constructed p27 siRNAs. Of these, p27 siRNA1 exhibited the strongest inhibitory effect on p27 mRNA expression and was therefore selected for further experiments (Fig. 6A). We demonstrated that miR-222 inhibitor suppressed the expression of α-SMA protein, and this suppression was attenuated by p27 siRNA1 (Fig. 6B). We then investigated whether miR-222 and p27 are involved in the inhibition of HSC activation by Lenti-GAS5. Our results indicated that the decreased α-SMA level observed during GAS5 overexpression was reversed in the presence of p27 siRNA1, miR-222 mimics, or p27 siRNA1 in combination with miR-222 mimics (Fig. 6C). Next, we explored whether miR-222 and p27 are required for the inhibition of cell proliferation by Lenti-GAS5 by an EdU incorporation assay using primary HSCs. In the presence of PDGF-bb, the EdU assay showed that overexpression of GAS5 induced a remarkable decrease in HSC proliferation. This phenotype was partially rescued by the addition of p27 siRNA1, miR-222 mimics, or p27 siRNA1 combined with miR-222 mimics (Fig. 6D). Thus, we concluded that GAS5 inhibits the activation and proliferation of primary HSCs through regulation of miR-222 and p27.
FIGURE 6.

Overexpression of GAS5 inhibits activation and proliferation of HSCs in vitro. A, the silencing effect of p27 siRNAs was evaluated by qRT-PCR. B, decreased α-SMA protein levels by miR-222 inhibitor were ameliorated by p27 siRNA1. Western blot analysis was conducted three times with similar results. C, reduction of α-SMA protein by GAS5 overexpression was alleviated by miR-222 mimics and/or p27 siRNA1. Western blot analysis was conducted three times with similar results. D, inhibition of HSC proliferation by GAS5 overexpression was alleviated by miR-222 mimics and/or p27 siRNA1 as determined by an EdU incorporation assay. The data are expressed as the means ± S.D. (error bars) of at least three independent experiments. #, p < 0.05; ** and ##, p < 0.01. Ctrl, control.
Discussion
In this study, we confirmed that the level of miR-222 is elevated in liver fibrosis and that miR-222 inhibitor can impede the activation of HSCs, which is consistent with a previous report (7). However, here we propose a new notion that miR-222 targets not only protein-coding gene p27 but also lncRNAs such as GAS5. Traditionally, miRNAs play a pivotal role in gene regulation mainly by targeting abundant protein-coding genes. Our results expand the repertoire of miRNA targets, implying that miRNAs can also perform their function by targeting lncRNAs. It has been reported that GAS5 and miR-21 can inhibit each other in human breast cancer (34). In human osteoarthritis, GAS5 can contribute to the pathogenesis of osteoarthritis by serving as a negative mediator of miR-21 (39). However, bioinformatics analysis and our experimental results revealed that GAS5 is not the target of miR-21 in mice. Accordingly, GAS5 maybe perform its function through another regulatory mechanism in mice. Our results indicated that GAS5 expression is decreased in mouse liver fibrosis samples, which exhibited the opposite direction of miR-222 expression. Interestingly, miR-222 could inhibit the expression of GAS5, and GAS5 could also suppress the expression of miR-222, thus forming a reciprocal repression regulatory loop (Fig. 7). Our findings laid a theoretical foundation for further analysis of a potential ceRNA regulatory network.
FIGURE 7.
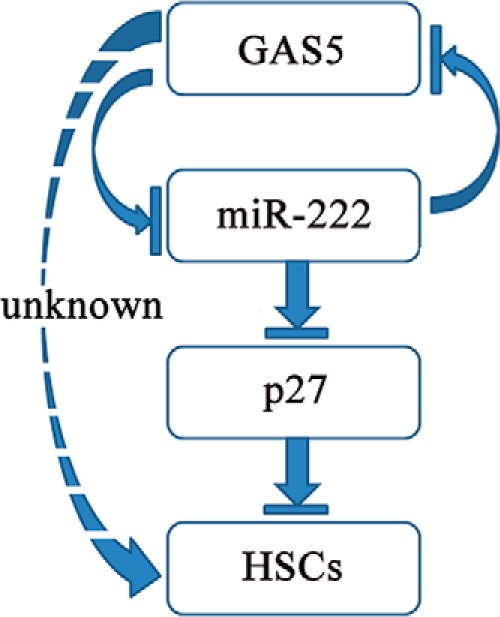
Schematic representative of the possible negative feedback loop controlling the progression of liver fibrosis.
Recently, numerous studies have indicated that GAS5 is down-regulated during cancer (19, 22, 40, 41). Similarly, our results showed that GAS5 expression is decreased in mouse liver fibrosis and in activated HSCs. Reduced GAS5 levels were also found in rat and human liver fibrosis. Unlike miRNAs, lncRNAs show little homology between different species. However, our results appear to indicate that the functions of GAS5 are conserved.
It has been reported that GAS5 functions as a tumor suppressor (21, 42). In our study, overexpression of GAS5 significantly lowered the mRNA and protein levels of Col1A1 and α-SMA. The increased expression of GAS5 through lentivirus-mediated transduction reduced the accumulation of collagen in the liver tissues. These data suggested that GAS5 plays a pivotal role in liver fibrogenesis. To our knowledge, this is the first report to identify GAS5 as a suppressive factor in liver fibrosis.
Recent data suggest that coding genes and non-coding RNAs can regulate each other through their competition for miRNA binding (23, 43). These RNAs, which sequester miRNAs, thereby releasing their target RNAs, have been defined asceRNAs (44). Based on the ceRNA hypothesis, lncRNAs may exert their influence on the targets through serving as decoys for miRNAs (27, 44, 45). In this study, we showed that GAS5 can bind to miR-222 using the luciferase reporter assay and pulldown assay.
The copy numbers of GAS5 per cell are higher than those of miR-222. Additionally, miR-222 was post-transcriptionally regulated by GAS5, which was mainly localized in the cytoplasm. These findings support that GAS5 can act as a ceRNA. Among the many different putative targets for miR-222, we investigated the p27 protein further because of its critical role in liver fibrosis. In line with the ceRNA hypothesis, our results showed that overexpression of GAS5 elevated the level of p27 protein. The level of p27 protein gradually increased with increasing levels of GAS5. In addition, the increased level of p27 protein could be inhibited by miR-222 mimics and reinforced by miR-222 inhibitor. These results revealed the direct competition for miR-222 binding between GAS5 and p27. Taken together, our results showed that lncRNAs can act as mediators of gene expression through miRNA binding.
Protein p27 has been proposed as a critical determinant of tumor aggressiveness (46). Reduced levels of p27 have been linked with poor prognosis in tumor patients (47). Li et al. (48) reported that p27 silencing significantly attenuates the suppressive effect of arctigenin on the proliferation of HSCs. In this study, our results revealed that decreased cell activation and proliferation by GAS5 overexpression were partially rescued by miR-222 mimics, p27 siRNA1, or p27 siRNA1 in combination with miR-222 mimics. We conclude that GAS5 increases the level of p27 protein through miR-222 binding, thereby inhibiting the activation and proliferation of HSCs (Fig. 7).
There are some limitations in this study. Lenti-GAS5 was not HSC-specific. The lentivirus vector may target hepatocytes and HSCs simultaneously. Therefore, the antifibrotic effects of Lenti-GAS5 may be caused by these two types of cells. In addition, because the partial rescue of GAS5 overexpression was fulfilled by miR-222 mimics and/or p27 siRNA1, whether there are other factors involved is still unclear, and further studies are warranted.
Collectively, our findings indicate GAS5 as a crucial regulator in liver fibrogenesis by functioning as a ceRNA. A better understanding of the miRNA-lncRNA interaction and the regulatory mechanisms involved may lead to novel therapeutic targets for liver fibrosis.
Author Contributions
X. F. designed and instructed the study. F. Y. and J. Z. carried out the majority of the experiments. Y. M. performed the cell culture. P. D. performed the siRNA transfections. Z. Lu conducted the cell proliferation assay and collected human liver samples. G. L. generated the animal models and collected human liver samples. C. G. and Z. Liu performed the isolation of primary HSCs. All authors discussed the results and approved the final manuscript.
This work was supported by Science and Technology Commission of Shanghai Municipality Grant 11ZR1405700; Key Clinical Disciplines Construction of Shanghai Municipality Grant ZK2012B20; National Natural Science Foundation of China Grants 81000176/H0317, 81100292/H0317, and 81500458/H0317; Zhejiang Provincial Natural Science Foundation of China Grants Y2090326, Y2110634, and LY16H030012; Wenzhou Municipal Science and Technology Bureau Grants Y20110033 and Y20120127; Wang Bao-En Liver Fibrosis Foundation Grant 20120127; and the Key Disciplines in Colleges and Universities of Zhejiang Province. The authors declare that they have no conflicts of interest with the contents of this article.
- HSC
- hepatic stellate cell
- miRNA
- microRNA
- lncRNA
- long non-coding RNA
- miR
- microRNA
- Col1A1
- collagen 1a1
- α-SMA
- smooth muscle α-actin
- GAS5
- growth arrest-specific 5
- ceRNA
- competing endogenous RNA
- CCl4
- carbon tetrachloride
- Lenti-GAS5
- lentiviral vector expressing GAS5
- Lenti-NC
- empty vector
- m.o.i.
- multiplicity of infection
- EdU
- ethynyl deoxyuridine
- Bio-miR-222
- biotinylated miR-222
- NC
- negative control
- qRT-PCR
- quantitative real time PCR
- pri-miR
- primary miR.
References
- 1.Seki E., and Schwabe R. F. (2015) Hepatic inflammation and fibrosis: functional links and key pathways. Hepatology 61, 1066–1079 [DOI] [PMC free article] [PubMed] [Google Scholar]
- 2.Qiu M. T., Hu J. W., Yin R., and Xu L. (2013) Long noncoding RNA: an emerging paradigm of cancer research. Tumour Biol. 34, 613–620 [DOI] [PubMed] [Google Scholar]
- 3.Piccoli M. T., Gupta S. K., and Thum T. (2015) Noncoding RNAs as regulators of cardiomyocyte proliferation and death. J. Mol. Cell. Cardiol. 10.1016/j.yjmcc.2015.02.002 [DOI] [PubMed] [Google Scholar]
- 4.Lemoinne S., Thabut D., Housset C., Moreau R., Valla D., Boulanger C. M., and Rautou P. E. (2014) The emerging roles of microvesicles in liver diseases. Nat. Rev. Gastroenterol. Hepatol. 11, 350–361 [DOI] [PubMed] [Google Scholar]
- 5.Mormone E., George J., and Nieto N. (2011) Molecular pathogenesis of hepatic fibrosis and current therapeutic approaches. Chem. Biol. Interact. 193, 225–231 [DOI] [PMC free article] [PubMed] [Google Scholar]
- 6.Zhang Z., Zha Y., Hu W., Huang Z., Gao Z., Zang Y., Chen J., Dong L., and Zhang J. (2013) The autoregulatory feedback loop of microRNA-21/programmed cell death protein 4/activation protein-1 (MiR-21/PDCD4/AP-1) as a driving force for hepatic fibrosis development. J. Biol. Chem. 288, 37082–37093 [DOI] [PMC free article] [PubMed] [Google Scholar]
- 7.Ogawa T., Enomoto M., Fujii H., Sekiya Y., Yoshizato K., Ikeda K., and Kawada N. (2012) MicroRNA-221/222 upregulation indicates the activation of stellate cells and the progression of liver fibrosis. Gut 61, 1600–1609 [DOI] [PubMed] [Google Scholar]
- 8.Lino Cardenas C. L., Henaoui I. S., Courcot E., Roderburg C., Cauffiez C., Aubert S., Copin M. C., Wallaert B., Glowacki F., Dewaeles E., Milosevic J., Maurizio J., Tedrow J., Marcet B., Lo-Guidice J. M., Kaminski N., Barbry P., Luedde T., Perrais M., Mari B., and Pottier N. (2013) miR-199a-5p Is upregulated during fibrogenic response to tissue injury and mediates TGFβ-induced lung fibroblast activation by targeting caveolin-1. PLoS Genet. 9, e1003291. [DOI] [PMC free article] [PubMed] [Google Scholar]
- 9.Yu F., Guo Y., Chen B., Dong P., and Zheng J. (2015) MicroRNA-17-5p activates hepatic stellate cells through targeting of Smad7. Lab. Invest. 95, 781–789 [DOI] [PubMed] [Google Scholar]
- 10.Lakner A. M., Steuerwald N. M., Walling T. L., Ghosh S., Li T., McKillop I. H., Russo M. W., Bonkovsky H. L., and Schrum L. W. (2012) Inhibitory effects of microRNA 19b in hepatic stellate cell-mediated fibrogenesis. Hepatology 56, 300–310 [DOI] [PMC free article] [PubMed] [Google Scholar]
- 11.Guo C. J., Pan Q., Li D. G., Sun H., and Liu B. W. (2009) miR-15b and miR-16 are implicated in activation of the rat hepatic stellate cell: an essential role for apoptosis. J. Hepatol. 50, 766–778 [DOI] [PubMed] [Google Scholar]
- 12.Estep M., Armistead D., Hossain N., Elarainy H., Goodman Z., Baranova A., Chandhoke V., and Younossi Z. M. (2010) Differential expression of miRNAs in the visceral adipose tissue of patients with non-alcoholic fatty liver disease. Aliment. Pharmacol. Ther. 32, 487–497 [DOI] [PubMed] [Google Scholar]
- 13.Zheng J., Wu C., Lin Z., Guo Y., Shi L., Dong P., Lu Z., Gao S., Liao Y., Chen B., and Yu F. (2014) Curcumin up-regulates phosphatase and tensin homologue deleted on chromosome 10 through microRNA-mediated control of DNA methylation—a novel mechanism suppressing liver fibrosis. FEBS J. 281, 88–103 [DOI] [PubMed] [Google Scholar]
- 14.Greco S., Gorospe M., and Martelli F. (2015) Noncoding RNA in age-related cardiovascular diseases. J. Mol. Cell. Cardiol. 83, 142–155 [DOI] [PMC free article] [PubMed] [Google Scholar]
- 15.Wu Z., Liu X., Liu L., Deng H., Zhang J., Xu Q., Cen B., and Ji A. (2014) Regulation of lncRNA expression. Cell. Mol. Biol. Lett. 19, 561–575 [DOI] [PMC free article] [PubMed] [Google Scholar]
- 16.Zhang A., Xu M., and Mo Y. Y. (2014) Role of the lncRNA-p53 regulatory network in cancer. J. Mol. Cell. Biol. 6, 181–191 [DOI] [PMC free article] [PubMed] [Google Scholar]
- 17.Smith C. M., and Steitz J. A. (1998) Classification of gas5 as a multi-small-nucleolar-RNA (snoRNA) host gene and a member of the 5′-terminal oligopyrimidine gene family reveals common features of snoRNA host genes. Mol. Cell. Biol. 18, 6897–6909 [DOI] [PMC free article] [PubMed] [Google Scholar]
- 18.Mourtada-Maarabouni M., Pickard M. R., Hedge V. L., Farzaneh F., and Williams G. T. (2009) GAS5, a non-protein-coding RNA, controls apoptosis and is downregulated in breast cancer. Oncogene 28, 195–208 [DOI] [PubMed] [Google Scholar]
- 19.Sun M., Jin F. Y., Xia R., Kong R., Li J. H., Xu T. P., Liu Y. W., Zhang E. B., Liu X. H., and De W. (2014) Decreased expression of long noncoding RNA GAS5 indicates a poor prognosis and promotes cell proliferation in gastric cancer. BMC Cancer 14, 319. [DOI] [PMC free article] [PubMed] [Google Scholar]
- 20.Yacqub-Usman K., Pickard M. R., and Williams G. T. (2015) Reciprocal regulation of GAS5 lncRNA levels and mTOR inhibitor action in prostate cancer cells. Prostate 75, 693–705 [DOI] [PubMed] [Google Scholar]
- 21.Pickard M. R., Mourtada-Maarabouni M., and Williams G. T. (2013) Long non-coding RNA GAS5 regulates apoptosis in prostate cancer cell lines. Biochim. Biophys. Acta 1832, 1613–1623 [DOI] [PubMed] [Google Scholar]
- 22.Mourtada-Maarabouni M., Hedge V. L., Kirkham L., Farzaneh F., and Williams G. T. (2008) Growth arrest in human T-cells is controlled by the non-coding RNA growth-arrest-specific transcript 5 (GAS5). J. Cell Sci. 121, 939–946 [DOI] [PubMed] [Google Scholar]
- 23.Legnini I., Morlando M., Mangiavacchi A., Fatica A., and Bozzoni I. (2014) A feedforward regulatory loop between HuR and the long noncoding RNA linc-MD1 controls early phases of myogenesis. Mol. Cell 53, 506–514 [DOI] [PMC free article] [PubMed] [Google Scholar]
- 24.Gao Y., Wu F., Zhou J., Yan L., Jurczak M. J., Lee H. Y., Yang L., Mueller M., Zhou X. B., Dandolo L., Szendroedi J., Roden M., Flannery C., Taylor H., Carmichael G. G., Shulman G. I., and Huang Y. (2014) The H19/let-7 double-negative feedback loop contributes to glucose metabolism in muscle cells. Nucleic Acids Res. 42, 13799–13811 [DOI] [PMC free article] [PubMed] [Google Scholar]
- 25.Hsu S. J., Lee F. Y., Wang S. S., Hsin I. F., Lin T. Y., Huang H. C., Chang C. C., Chuang C. L., Ho H. L., Lin H. C., and Lee S. D. (2015) Caffeine ameliorates hemodynamic derangements and portosystemic collaterals in cirrhotic rats. Hepatology 61, 1672–1684 [DOI] [PubMed] [Google Scholar]
- 26.Orabi A. I., Sah S., Javed T. A., Lemon K. L., Good M. L., Guo P., Xiao X., Prasadan K., Gittes G. K., Jin S., and Husain S. Z. (2015) Dynamic imaging of pancreatic NF-κB activation in live mice using AAV infusion and bioluminescence. J. Biol. Chem. 290, 11309–11320 [DOI] [PMC free article] [PubMed] [Google Scholar]
- 27.Wang K., Liu F., Zhou L. Y., Long B., Yuan S. M., Wang Y., Liu C. Y., Sun T., Zhang X. J., and Li P. F. (2014) The long noncoding RNA CHRF regulates cardiac hypertrophy by targeting miR-489. Circ. Res. 114, 1377–1388 [DOI] [PubMed] [Google Scholar]
- 28.Zaghlool A., Ameur A., Nyberg L., Halvardson J., Grabherr M., Cavelier L., and Feuk L. (2013) Efficient cellular fractionation improves RNA sequencing analysis of mature and nascent transcripts from human tissues. BMC Biotechnol. 13, 99. [DOI] [PMC free article] [PubMed] [Google Scholar]
- 29.Wang Y., Xu Z., Jiang J., Xu C., Kang J., Xiao L., Wu M., Xiong J., Guo X., and Liu H. (2013) Endogenous miRNA sponge lincRNA-RoR regulates Oct4, Nanog, and Sox2 in human embryonic stem cell self-renewal. Dev. Cell 25, 69–80 [DOI] [PubMed] [Google Scholar]
- 30.Sarkar N., and Chakravarty R. (2015) Hepatitis B virus infection, microRNAs and liver disease. Int. J. Mol. Sci. 16, 17746–17762 [DOI] [PMC free article] [PubMed] [Google Scholar]
- 31.Lambrecht J., Mannaerts I., and van Grunsven L. A. (2015) The role of miRNAs in stress-responsive hepatic stellate cells during liver fibrosis. Front. Physiol. 6, 209. [DOI] [PMC free article] [PubMed] [Google Scholar]
- 32.Roy S., Benz F., Luedde T., and Roderburg C. (2015) The role of miRNAs in the regulation of inflammatory processes during hepatofibrogenesis. Hepatobiliary Surg. Nutr. 4, 24–33 [DOI] [PMC free article] [PubMed] [Google Scholar]
- 33.Xiao Y., Wang J., Chen Y., Zhou K., Wen J., Wang Y., Zhou Y., Pan W., and Cai W. (2014) Up-regulation of miR-200b in biliary atresia patients accelerates proliferation and migration of hepatic stallate cells by activating PI3K/Akt signaling. Cell. Signal. 26, 925–932 [DOI] [PubMed] [Google Scholar]
- 34.Zhang Z., Zhu Z., Watabe K., Zhang X., Bai C., Xu M., Wu F., and Mo Y. Y. (2013) Negative regulation of lncRNA GAS5 by miR-21. Cell Death Differ. 20, 1558–1568 [DOI] [PMC free article] [PubMed] [Google Scholar]
- 35.le Sage C., Nagel R., Egan D. A., Schrier M., Mesman E., Mangiola A., Anile C., Maira G., Mercatelli N., Ciafrè S. A., Farace M. G., and Agami R. (2007) Regulation of the p27(Kip1) tumor suppressor by miR-221 and miR-222 promotes cancer cell proliferation. EMBO J. 26, 3699–3708 [DOI] [PMC free article] [PubMed] [Google Scholar]
- 36.Han X., Yang F., Cao H., and Liang Z. (2015) Malat1 regulates serum response factor through miR-133 as a competing endogenous RNA in myogenesis. FASEB J. 29, 3054–3064 [DOI] [PubMed] [Google Scholar]
- 37.Kino T., Hurt D. E., Ichijo T., Nader N., and Chrousos G. P. (2010) Noncoding RNA gas5 is a growth arrest- and starvation-associated repressor of the glucocorticoid receptor. Sci. Signal. 3, ra8. [DOI] [PMC free article] [PubMed] [Google Scholar]
- 38.Coccia E. M., Cicala C., Charlesworth A., Ciccarelli C., Rossi G. B., Philipson L., and Sorrentino V. (1992) Regulation and expression of a growth arrest-specific gene (gas5) during growth, differentiation, and development. Mol. Cell. Biol. 12, 3514–3521 [DOI] [PMC free article] [PubMed] [Google Scholar]
- 39.Song J., Ahn C., Chun C. H., and Jin E. J. (2014) A long non-coding RNA, GAS5, plays a critical role in the regulation of miR-21 during osteoarthritis. J. Orthop. Res. 32, 1628–1635 [DOI] [PubMed] [Google Scholar]
- 40.Qiao H. P., Gao W. S., Huo J. X., and Yang Z. S. (2013) Long non-coding RNA GAS5 functions as a tumor suppressor in renal cell carcinoma. Asian Pac. J. Cancer Prev. 14, 1077–1082 [DOI] [PubMed] [Google Scholar]
- 41.Renganathan A., Kresoja-Rakic J., Echeverry N., Ziltener G., Vrugt B., Opitz I., Stahel R. A., and Felley-Bosco E. (2014) GAS5 long non-coding RNA in malignant pleural mesothelioma. Mol. Cancer 13, 119. [DOI] [PMC free article] [PubMed] [Google Scholar]
- 42.Yin D., He X., Zhang E., Kong R., De W., and Zhang Z. (2014) Long noncoding RNA GAS5 affects cell proliferation and predicts a poor prognosis in patients with colorectal cancer. Med. Oncol. 31, 253. [DOI] [PubMed] [Google Scholar]
- 43.Tay Y., Rinn J., and Pandolfi P. P. (2014) The multilayered complexity of ceRNA crosstalk and competition. Nature 505, 344–352 [DOI] [PMC free article] [PubMed] [Google Scholar]
- 44.Salmena L., Poliseno L., Tay Y., Kats L., and Pandolfi P. P. (2011) A ceRNA hypothesis: the Rosetta Stone of a hidden RNA language? Cell 146, 353–358 [DOI] [PMC free article] [PubMed] [Google Scholar]
- 45.Gao Y., Meng H., Liu S., Hu J., Zhang Y., Jiao T., Liu Y., Ou J., Wang D., Yao L., Liu S., and Hui N. (2015) LncRNA-HOST2 regulates cell biological behaviors in epithelial ovarian cancer through a mechanism involving microRNA let-7b. Hum. Mol. Genet. 24, 841–852 [DOI] [PubMed] [Google Scholar]
- 46.Pippa R., Espinosa L., Gundem G., García-Escudero R., Dominguez A., Orlando S., Gallastegui E., Saiz C., Besson A., Pujol M. J., López-Bigas N., Paramio J. M., Bigas A., and Bachs O. (2012) p27Kip1 represses transcription by direct interaction with p130/E2F4 at the promoters of target genes. Oncogene 31, 4207–4220 [DOI] [PubMed] [Google Scholar]
- 47.Zhu L., Chiao C. Y., Enzer K. G., Stankiewicz A. J., Faller D. V., and Dai Y. (2015) SIRT1 inactivation evokes antitumor activities in NSCLC through the tumor suppressor p27. Mol. Cancer Res. 13, 41–49 [DOI] [PMC free article] [PubMed] [Google Scholar]
- 48.Li A., Wang J., Wu M., Zhang X., and Zhang H. (2015) The inhibition of activated hepatic stellate cells proliferation by arctigenin through G0/G1 phase cell cycle arrest: persistent p27(Kip1) induction by interfering with PI3K/Akt/FOXO3a signaling pathway. Eur. J. Pharmacol. 747, 71–87 [DOI] [PubMed] [Google Scholar]