

Abstract
Delayed reconstitution of the T cell compartment in recipients of allogeneic stem cell grafts is associated with an increase of reactivation of latent viruses. Thereby, the transplanted T cell repertoire appears to be one of the factors that affect T cell reconstitution. Therefore, we studied the T cell receptor beta (TCRβ) gene rearrangements of flow cytometry–sorted CD4+ and CD8+ T cells from the peripheral blood of 23 allogeneic donors before G-CSF administration and on the day of apheresis. For this purpose, TCRβ rearrangements were amplified by multiplex PCR followed by high-throughput amplicon sequencing. Overall, CD4+ T cells displayed a significantly higher TCRβ diversity compared to CD8+ T cells irrespective of G-CSF administration. In line, no significant impact of G-CSF treatment on the TCR Vβ repertoire usage was found. However, correlation of the donor T cell repertoire with clinical outcomes of the recipient revealed that a higher CD4+ TCRβ diversity after G-CSF treatment is associated with lower reactivation of cytomegalovirus and Epstein–Barr virus. By contrast, no protecting correlation was observed for CD8+ T cells. In essence, our deep TCRβ analysis identifies the importance of the CD4+ T cell compartment for the control of latent viruses after allogeneic stem cell transplantation.
Keywords: Bone marrow, cytomegalovirus (CMV), donors and donation, Epstein–Barr virus (EBV), hematopoietic stem cell transplantation, infection and infectious agents, infectious disease, molecular biology, science, T cell biology, translational research
Introduction
Allogeneic hematopoietic stem cell transplantation (aHSCT) represents a curative treatment option for patients with hematological malignancies. Today, G-CSF mobilized peripheral blood stem cell (PBSC) products, rather than bone marrow, are the predominant source of stem cells used in transplantation. Both stem cell sources differ in their cellular composition. In particular, PBSC grafts contain approximately 10 times more T cells than those derived from bone marrow (1). Despite the higher number of T cells transfused along with PBSCs, the incidence of acute graft-versus-host disease (aGvHD) after transplantation is not significantly higher with PBSC grafts compared to bone marrow transplants. This fact has been explained by a Th2 polarization of T cells in the graft induced by G-CSF (2). However, the influence of G-CSF on the donor T cell repertoire remains unknown.
The success of aHSCT is, however, compromised by two additional factors, namely, relapse of the underlying malignancy and infectious complications. While aGvHD can be eliminated by T cell depletion of the graft, the incidence of relapse and infectious complication increases dramatically due to delayed recovery of the donor T cell compartment. Even if the PBSC graft is not T cell depleted, quantitative and qualitative reconstitution of the T cell compartment in the host requires several months and tends to remain incomplete (3,4). Delayed T cell reconstitution and restricted T cell receptor (TCR) diversity after transplantation are associated with increased reactivation of latent viruses such as cytomegalovirus (CMV) and Epstein–Barr virus (EBV) (5–8). Once full donor chimerism in recipients is achieved and donor hematopoiesis is the only source for T cells, the donor T cell repertoire is solely responsible for controlling latent viruses. Therefore, we hypothesized that the T cell repertoire diversity of the donor after G-CSF mobilization determines later clinical outcome of recipients.
The high diversity of the human T cell repertoire is mainly generated by somatic recombination among the variable (V), diversity (D), and joining (J) TCRβ gene segments and the addition of random nontemplated bases at recombination junctions. The hypervariable complementarity-determining region 3 (CDR3) of the rearranged TCRβ represents the antigen-binding site and can generate more than 106 unique TCRβ receptor rearrangements (9).
Several strategies have been developed over the last two decades to study the composition and diversity of the T cell repertoire, including flow cytometry and spectratyping (10–13). However, none of these attempts has managed to generate individual sequences or frequencies of unique TCRβ rearrangements. This has changed with technical advances in high-throughput sequencing (HTS), which now allow the analysis of T cell repertoires based on sequence analysis of TCRβ rearrangements (14–16).
To test our hypothesis that T cell diversity of stem cell donors is important for the clinical course of recipients, we employed an approach that combines multiplex TCRβ PCR employing DNA extracted from flow cytometry–sorted CD4+ and CD8+ T cells with HTS. To this end, we analyzed peripheral blood samples of 23 donors obtained before G-CSF–induced stem cell mobilization and at the day of stem cell apheresis. By correlation with clinical outcomes of the stem cell recipients, we demonstrated that reduced TCRβ diversity of the CD4+ T cell compartment after G-CSF mobilization of the donor is associated with reactivation of CMV and EBV in the recipients.
Materials and Methods
Samples acquisition and recipient data
Peripheral blood samples of six healthy volunteers were used after informed consent to determine the robustness and reliability of our HTS-based TCRβ analysis (Table 1).
Table 1.
Characteristics of healthy control individuals
| Control individual | Age | No. of clonotypes CD4+ cells | No. of clonotypes CD8+ cells | |
|---|---|---|---|---|
| 1 | 24 | 2555 | 2566 | |
| 2 | 29 | 2529 | 2513 | |
| 3 | 38 | 2464 | 1800 | |
| 4 | 22 | 2383 | 2547 | |
| 5 | A | 44 | 3002 | 1904 |
| B | 2937 | 1338 | ||
| 6 | A | 29 | 2830 | 1734 |
| B | 2943 | 2376 | ||
Number of different clonotypes in the CD4+ and CD8+ T cell compartments measured by HTS as well as the age of six healthy control individuals. A and B represent two different flow cytometry sorts of the same blood sample.
To study T cell diversity in donors before and after G-CSF induced stem cell mobilization, peripheral blood samples of 23 allogeneic, HLA-matched (10/10) donors were analyzed before G-CSF mobilization and on the day of apheresis. Gender, age, donor type, virus (CMV, EBV) status of stem cell donors and recipient outcomes were assessed (Table 2). Recipients (see also Table S1) were transplanted and monitored at the Department of Hematology and Oncology (University of Erlangen) after aHSCT.
Table 2.
Characteristics of 23 stem cell donors and corresponding recipients
| Donor |
Recipient |
||||||||||
|---|---|---|---|---|---|---|---|---|---|---|---|
| Serostatus (IgG) |
No. of clonotypes CD4+ cells preMOB | No. of clonotypes CD4+ cells postMOB | No. of clonotypes CD8+ cells preMOB | No. of clonotypes CD8+ cells postMOB | Virus reactivation |
||||||
| No. | Gender | Age | Donor type | CMV | EBV | CMV | EBV | ||||
| 1 | M | 57 | SIB | neg. | pos. | 2454 | 2288 | 887 | 840 | No | Yes |
| 2 | M | 30 | MUD | neg. | pos. | 3034 | 3110 | 2350 | 2369 | No | No |
| 3 | M | 20 | MUD | neg. | pos. | 2198 | 2604 | 1938 | 2231 | Yes | No |
| 4 | M | 33 | SIB | neg. | neg. | 2786 | 2825 | 1984 | 1254 | No | No |
| 5 | F | 51 | SIB | neg. | pos. | 2562 | 2596 | 1871 | 2140 | No | No |
| 6 | M | 23 | MUD | pos. | pos. | 2380 | 1542 | 1489 | 1400 | Yes | Yes |
| 7 | M | 58 | SIB | neg. | pos. | 2410 | 3061 | NA | NA | No | No |
| 8 | M | 50 | MUD | pos. | pos. | 2617 | 2674 | 1503 | 1295 | No | No |
| 9 | M | 44 | MUD | pos. | pos. | NA | NA | 995 | 1085 | Yes | No |
| 10 | F | 61 | SIB | neg. | pos. | 2020 | 2629 | 1433 | 1577 | No | No |
| 11 | F | 51 | SIB | neg. | pos. | 2773 | 2810 | 2592 | 1519 | No | No |
| 12 | M | 45 | MUD | pos. | pos. | 2655 | 2552 | 1903 | 2027 | Yes | Yes |
| 13 | M | 30 | MUD | neg. | pos. | 2575 | 2687 | 2296 | 2427 | Yes | Yes |
| 14 | M | 51 | MUD | neg. | pos. | 2403 | 2143 | 941 | 1520 | Yes | No |
| 15 | M | 48 | SIB | neg. | pos. | 2493 | 2065 | 508 | 1088 | Yes | No |
| 16 | M | 20 | MUD | pos. | neg. | 2373 | 2084 | 2054 | 1729 | Yes | No |
| 17 | M | 32 | MUD | pos. | pos. | 2859 | 2503 | 1642 | 1666 | Yes | No |
| 18 | M | 48 | MUD | pos. | pos. | 2189 | 2292 | 941 | 1380 | Yes | Yes |
| 19 | M | 40 | MUD | neg. | neg. | 2674 | 2602 | 2141 | 1668 | No | No |
| 20 | M | 41 | MUD | neg. | neg. | 2054 | 2795 | 1764 | 2381 | No | No |
| 21 | M | 49 | MUD | neg. | pos. | 2853 | 2577 | 1813 | 1508 | No | No |
| 22 | M | 40 | SIB | pos. | pos. | 2245 | 1866 | 2400 | 2021 | No | Yes |
| 23 | M | 45 | MUD | pos. | pos. | 2294 | 2477 | 1434 | 1414 | Yes | Yes |
Gender, age, donor type, virus (CMV and EBV) status, and number of clonotypes of the CD4+ and CD8+ T cell compartments of stem cell donors before and after G-CSF mobilization as well as clinical data (CMV and EBV reactivation) of corresponding recipients.
CMV, cytomegalovirus; EBV, Epstein–Barr virus; F, femal; G-CSF, granulocyte colony-stimulating factor; MUD, matched unrelated donor; M, male; NA, not available; SIB, sibling donor.
Virus reactivation was monitored by specific quantitative real-time PCR (for details see Supplementary Methods in Supporting Information). Ethical approval for this study was given by the local ethics review board of the University of Erlangen (Re. No. 4224).
Cell sorting
Whole blood samples were processed by density gradient centrifugation (Ficoll, GE Healthcare, UK) to obtain mononuclear blood cells (PBMCs). For flow cytometric sorting, PBMCs were stained with CD4, CD8, CD14 and TCRαβ antibodies (for details see Supplementary Methods in Supporting Information). Cells were gated on (i) vital lymphocytes in forward/side scatter, (ii) exclusion of doublets and (iii) TCRαβ+ CD14negative T cells. CD4+ and CD8+ T cells were sorted into separate tubes. A purity of >98.0% was achieved.
DNA isolation
DNA was extracted from CD4+ and CD8+ flow cytometry–sorted T cells using Qiagen AllPrep DNA/RNA Mini Kit (Qiagen, Hilden, Germany). Quantification of the extracted DNA was done employing Qubit® 1.0 Fluorometer (Invitrogen, Carlsbad, CA).
Amplification and sequencing of TCRβ gene rearrangements
TCRβ gene rearrangements were amplified by a multiplex PCR approach, which includes 58 primers initially described by Robins et al (14), but was redesigned for our purpose: (i) all primer sequences were re-evaluated and modified in order to allow a more homogeneous amplification of the various TCRβ rearrangements (Table S3); (ii) employing a two-step PCR strategy, the TCRβ amplicons were tagged with universal Illumina adapter sequences, including an additional barcode during a second amplification step, allowing parallel sequencing of several samples on Illumina HiSeq2000 (Illumina, San Diego, CA); and (iii) using the Illumina paired-end technology (2 × 100 bp) our amplicon sequences covered the entire CDR3 length and Vβ and Jβ segments in parts providing higher sequence accuracy.
The multiplex primers used contain a universal adapter sequence as a tail at the 5′ end complementary to the 3′ ends of second amplification adaptor primers. The adaptor PCR primers contained universal sequences that permitted solid-phase PCR on the Illumina Genome Analyzer (HiSeq2000 Sequencing System).
Primary amplification (final volume: 50 µL) was processed, including 100 ng DNA, 1.0 µM equimolar Vβ and Jβ primer pools, 1× PCR buffer, 3 mM MgCl2, 0.2 mM of each dNTP and 1 U AmpliTaq Gold DNA Polymerase (Applied Biosystems, Foster City, CA). The amplification was performed on a DNA thermal cycler (GeneAmp® PCR System 9700, Applied Biosystems) for 34 cycles at 62°C annealing temperature.
All PCR products were purified using the QIAquick PCR Purification Kit (Qiagen) and diluted (final amount: 500 pg) for further amplifications. Adapter PCRs were set up with 1× Phusion HF Buffer, 1.0 µM forward and reverse adapter primers, 0.05 mM of each dNTP and 1 U Phusion High-Fidelity DNA Polymerase (Finnzymes, Espoo, Finland). Secondary amplification was performed for 12 cycles at 58°C annealing temperature. Products were isolated from a 2% agarose gel using the Wizard® SV Gel and PCR Clean-Up System (Promega, Mannheim, Germany). DNA concentration was determined via the Qubit® 1.0 Fluorometer (Invitrogen).
Generated Illumina libraries were sequenced on a HiSeq2000 analyzer using paired-end modus with 2 × 100 bp read length and joining of read-pairs was performed by an in-house developed algorithm. Paired-end amplicon sequencing resulted in highly accurate sequence reads due to the overlap of related single sequence reads which is of great advantage over single-read-based clustering approaches. After read-pair joining, all identical and related sequence reads that deviated up to 1 bp mismatch were clustered and designated as unique TCRβ clonotypes. Clonotypes below a cut-off of 0.01% of all reads were regarded as background signals and neglected. According to the ImMunoGeneTics information system (http://www.imgt.org), the clonotype-specific Vβ and Jβ segments were assigned and the TCRβ CDR3 sequence was translated to in silico protein sequence. The TCRβ CDR3 sequence was defined as all amino acids (AAs) starting from the conserved 5′ cysteine in the Vβ segment and ending at the conserved 3′ phenylalanine in the Jβ segment.
Statistical analyses
Nonparametric analysis between data groups was performed by the Mann–Whitney U-test using GraphPad PRISM 6 software. Linear correlations between T cell diversity and patient age were tested by calculation of the Pearson's correlation coefficient. Contingency tables estimating Pearson's Chi square were generated using IBM SPSS Statistics software (version 22). A p-value < 0.05 was considered significant.
The TCRβ repertoire diversity was validated by employing the Shannon entropy for which a maximum entropy of 14 500 clonotypes per sample (equal to the number of T cells in 100 ng DNA) was assumed (17).
Results
Validation of the TCRβ composition in healthy control individuals
To demonstrate the reliability and robustness of our approach, we amplified the TCRβ gene rearrangements of flow cytometry–sorted CD4+ and CD8+ T cells derived from six healthy control volunteers (designated as “controls”; Table 1). For comparability, the same amount of DNA (100 ng DNA extracted from sorted T cells) representing the same number of T cells (approximately 14 500 T cells) was employed in each TCRβ PCR multiplex assay. After Illumina sequencing of the PCR products, a mean of approximately 4 610 000 joined sequence reads were generated per sample. In a first step, reads with identical TCRβ gene rearrangements were clustered leading to a mean of 2705 (range: 2383–3002) rearrangements for the CD4+ T cells and 2097 (range: 1338–2566) rearrangements for the CD8+ T cells. Clusters of identical TCRβ gene rearrangements were designated as clonotypes. The comparison of these clonotypes with germline Vβ and Jβ segments revealed very similar Vβ and Jβ usage in all samples (Figure 1A), which is in harmony with published data (18). Additional proof for the robustness of our data was given by the CDR3 size distribution (Figure 1B), which revealed a Gaussian-like curve almost identical to size distribution generated by conventional capillary electrophoresis (GeneScan) (19). Individual CDR3 length distribution graphs are given in Figure S2.
Figure 1.
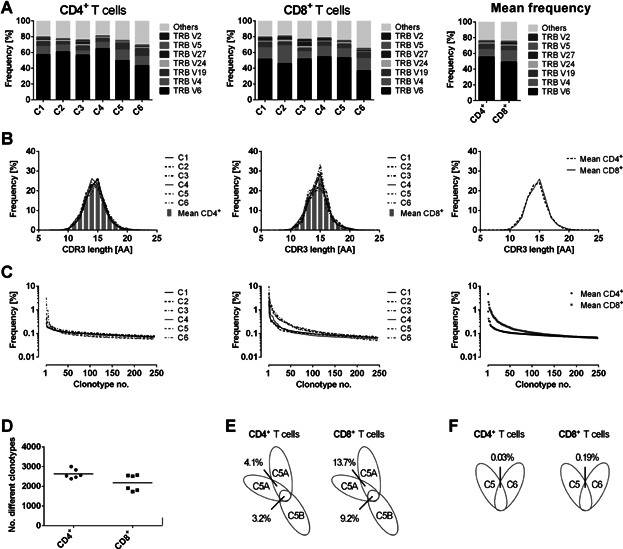
TCRβ analysis in healthy control individuals. (A) Vβ subgroup usage of TCRs from CD4+ (left panel) or CD8+ (middle panel) T cells of six untreated healthy control individuals (designated as “C1” to “C6”). Seven of the most frequent Vβ subgroups were illustrated individually. The remaining subgroups were compiled. The nomenclature according to the international ImMunoGeneTics information system (IMGT) was used. The right panel shows mean frequencies of all six controls for CD4+ and CD8+ T cells. (B) HTS-derived CDR3 length distribution of CD4+ (left panel) or CD8+ (right panel) TCRβ sequences for each control donor. The right panel shows mean frequencies of all donors. TCRβ CDR3 size was defined as all amino acids (AAs) from the conserved cysteine in the Vβ segment to the conserved phenylalanine in the Jβ segment. (C) The left and middle panels show the individual clonotype frequency distribution of CD4+ or CD8+ T cells of each control donor. The right panel shows the mean values of CD4+ and CD8+ T cells of all control donors. Each dot represents the occurrence (percentage) of a distinct TCRβ clonotype. Only the clonotype frequencies for the first 250 clonotypes were illustrated. (D) Diversity dot plot of CD4+ and CD8+ T cells for six healthy control individuals. Each dot shows the number of unique clonotypes detected in one donor. The bars illustrate the mean value of the groups. (E) Overlaps of individual clonotypes in CD4+ or CD8+ T cells of one control donor sequenced twice out of one T cell preparation (5A) and of two separate cell sorts (5A/B). (F) Overlaps of individual clonotypes in CD4+ or CD8+ T cells of distinct control individuals.
Although the Vβ and Jβ usage was highly similar in the two different T cell populations, the frequency and number of clonotypes (designated as diversity) in CD4+ and CD8+ T cells in our control samples revealed a statistically significant difference. In the CD4+ T cell fractions, the most frequent clonotype comprised 0.8% of all sequence reads (mean), whereas in the CD8+ T cell compartments the mean of the most common clonotype was 4.7% of all reads (Figure 1C). In consequence, a higher number of different clonotypes could be demonstrated in the CD4+ T cell fraction (Figure 1D). Taken together, CD4+ T cells showed a significantly higher diversity in their TCRβ repertoire compared to the CD8+ T cell compartment.
In order to determine the re-occurrence of identical clonotypes within individual control donors, we analyzed aliquots of the same DNA preparations of the same CD4+ and CD8+ sorted T cells in duplicate. In addition, we employed DNA preparations derived from different flow cytometry sorts of the same peripheral blood sample. The analysis of two different aliquots of the same DNA preparation revealed an overlap of 4.1% identical clonotypes for CD4+ T cells and an overlap of 13.7% for CD8+ T cells (Figure 1E). Comparing the different flow cytometry sorts of the same peripheral blood sample, the overlap was marginally lower leading to 3.2% identical clonotypes in CD4+ T cells and 9.2% in CD8+ T cells, respectively. Strikingly, the overlap of clonotypes between two different individuals in our study was less than 0.2% in CD4+ and CD8+ T cells (Figure 1D). Whereas the extremely rare coincidence of identical TCRβ rearrangements in different individuals is expected, the low overlap within the same DNA preparation or same T cell sort of the same individual implies that the T cells analyzed are composed to a large extent of unique TCRβ rearrangements. This is in line with the results of Warren et al (16), who demonstrated a similar low overlap between the TCRβ repertoires of different whole peripheral blood samples from one individual.
Analysis of TCRβ repertoire in stem cell donors before and after G-CSF mobilization
To monitor changes in the TCRβ repertoire during stem cell mobilization, we investigated the presence and frequency of TCRβ gene rearrangements in CD4+ and CD8+ T cells of 23 stem cell donors before G-CSF administration (pre) and on the days of stem cell apheresis (post) consisting of 88 samples in total (Table 2).
Analysis of the Vβ segment usage showed neither in CD4+ nor in CD8+ T cells a significant modification after G-CSF administration (Figure 2A) and the CDR3 length distribution remained unaffected (Figure S3).
Figure 2.
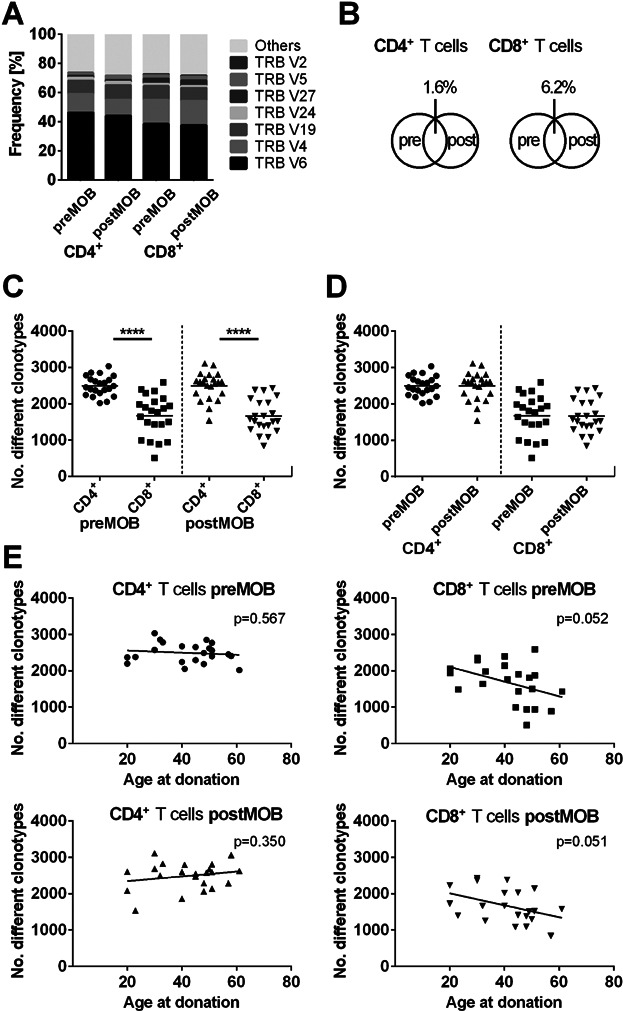
TCR analysis in stem cell donors before and after G-CSF induced mobilization. (A) Mean Vβ subgroup usage of TCRs from CD4+ or CD8+ T cells of 23 donors before (pre) and after (post) G-CSF induced stem cell mobilization. The seven most frequent Vβ subgroups were illustrated individually; the remaining subgroups were grouped together. The nomenclature according to the international ImMunoGeneTics information system (IMGT) was used. (B) Mean percentage of overlaps of individual clonotypes in CD4+ or CD8+ T cells of the 23 donors pre– and post–G-CSF–induced stem cell mobilization. (C and D) Diversity dot plots of CD4+ and CD8+ T cells pre– and post–G-CSF mobilization. Each dot represents the number of unique clonotypes detected in individual donors. (C) The number of clonotypes in CD4+ T cells differs significantly before and after G-CSF mobilization from the number of clonotypes in the CD8+ compartment (****p < 0.0001; n = 44). Bars show mean values. (D) The number of clonotypes in CD4+ and CD8+ T cells is not affected by G-CSF administration. (E) Scatter plots of CD4+ and CD8+ clonotype numbers and the age for stem cell donors pre– and post–G-CSF mobilization. The number of individual CD8+ clonotypes decreases with increasing donor age irrespective of G-CSF mobilization (preMOB: r = −0.42; p = 0.052; postMOB: r = −0.42; p = 0.051; n = 22). For CD4+ T cells, no negative correlation was found.  CD4+ T cells preMOB;
  CD4+ T cells postMOB;
  CD8+ T cells preMOB;
  CD8+ T cells postMOB.
The pairwise comparison of individual T cell repertoires before and after G-CSF mobilization in the 23 donors revealed a mean overlap of 1.6% for CD4+ and 6.2% for CD8+ T cells (Figure 2B), which is in harmony with the results of our six control individuals. The lower percentage is most likely explained by the fact that the samples of the controls were taken at the same time, whereas the samples of the stem cell donors were drawn at different time points before and after G-CSF mobilization. Regarding the number of different TCRβ clonotypes in CD4+ and CD8+ T cells, we found a significantly higher diversity of TCRβ gene rearrangements in CD4+ T cells compared to CD8+ T cells (Figure 2C; q < 0.0001; n = 44). However, the overall diversity of CD4+ and CD8+ T cells remained unaffected during G-CSF mobilization (Figure 2D) and was independent of the increased number of T cells in the peripheral blood after G-CSF administration (Figures S4 and S5).
Interestingly, in CD8+ T cells the TCRβ diversity correlated negatively with increasing donor age independent of mobilization state (Figure 2E; preMOB: r = −0.42; p = 0.052; postMOB: r = −0.42; p = 0.051; n = 22). Thus, our data confirm the notion that the TCRβ repertoire in CD8+ T cells is decreasing as a function of age (20).
Impact of the donor's viral status on TCR diversity during G-CSF induced mobilization
Since a preceding infection with herpes viruses (Table 2) may impact TCRβ diversity, we analyzed the repertoire of CMV-seropositive and CMV-seronegative donors separately (Figure 3A). As a result, we could demonstrate a significantly higher number of clonotypes in the CD4+ T cell compartment after G-CSF mobilization of CMV-seronegative donors compared to CMV-seropositive donors (p = 0.0158). On average, G-CSF per se does not influence the TCR repertoire in both T cell subsets irrespective of the virus status of the donors (Figure S6).
Figure 3.
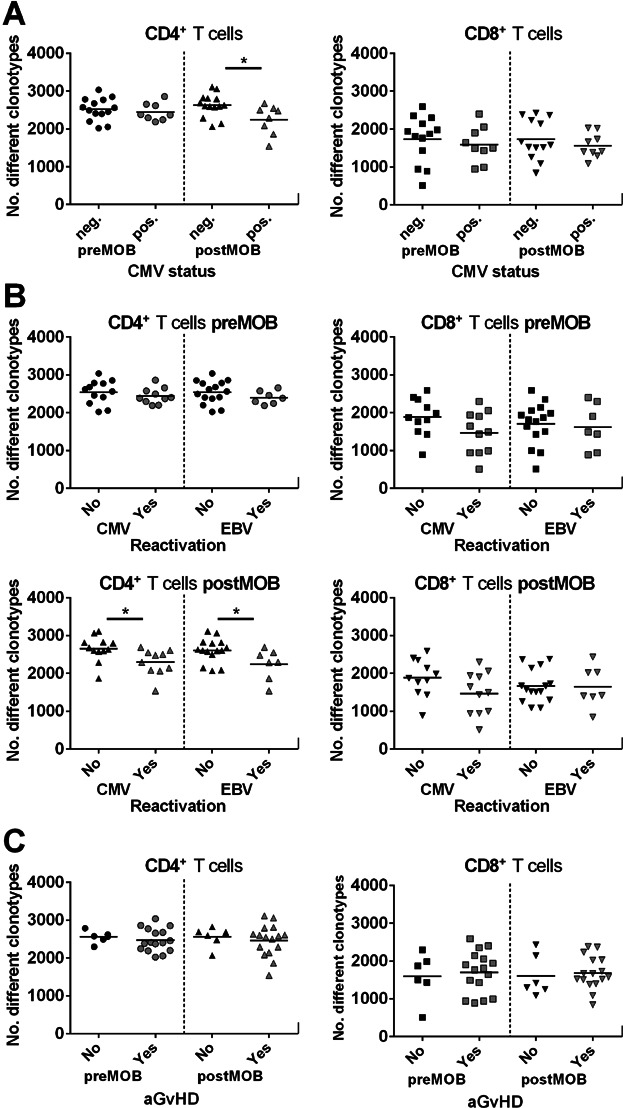
Donor TCRβ diversity and clinical correlation. (A) Diversity dot plots of CD4+ and CD8+ T cells of cytomegalovirus (CMV)-seropositive or -seronegative donors before (pre) and after (post) G-CSF mobilization. Only for the CD4+ T cell compartment postmobilization a significant difference could be displayed between CMV-seropositive and -seronegative donors (*p < 0.05; neg. n = 14; pos. n = 8). (B) Diversity dot plots of CD4+ and CD8+ TCRβ rearrangements of G-CSF–mobilized donors premobilization and postmobilization according to patients either reactivated (“Yes”) or not (“No”) with CMV (“Yes”: CD4+ n = 10; CD8+ n = 11) or Epstein–Barr virus (EBV; “Yes”: CD4+ n = 7; CD8+ n = 7). Cases with CMV and/or EBV reactivation presented significantly lower numbers of unique clonotypes in CD4+ T cells post–G-CSF mobilization (*p < 0.05). In CD8+ T cells, no significant difference could be detected for virus reactivation. (C) Diversity dot plots of CD4+ and CD8+ T cells of donor T cells premobilization and postmobilization according to patients who either exhibited acute graft-versus-host disease (aGvHD; “Yes”) or not (“No”). No significant correlation could be detected between donor T cell diversity and aGvHD appearance in patients. CD4+ T cells preMOB; CD4+ T cells postMOB; CD8+ T cells preMOB; CD8+ T cells postMOB.
However, four donors were EBV-seronegative. Interestingly, three of these donors were double negative for CMV and EBV and therefore presented higher numbers of clonotypes in their CD4+ T cells as shown above. In line, the only EBV-seronegative but CMV-seropositive donor displayed a reduced number of clonotypes in the CD4+ T cell compartment after G-CSF administration.
Correlation of clinical outcomes after stem cell transplantation with TCRβ diversity of the stem cell donors
Next we correlated the CD4+ and CD8+ T cell repertoires before and after G-CSF mobilization with various clinical outcomes of the patients after aHSCT. Remarkably, a reduced diversity of the TCRβ repertoire of the donors CD4+ T cell compartment after G-CSF mobilization was significantly correlated with EBV and CMV reactivation (Figure 3B; CMV: p = 0.0137; EBV: p = 0.0377). Employing the cumulative incidence of viral reactivation revealed that significantly more patients receiving grafts with lower TCRβ diversity reactivated CMV and EBV, although the serostatus of patients and donors for both viruses was different (Figure S1). In contrast, the diversity of the CD8+ T cell compartment has no impact on the viral reactivation irrespective of G-CSF mobilization. In addition, we could not identify a correlation between the development of aGvHD and the transferred TCRβ repertoire diversity at any mobilization stage (Figure 3C). These observations remained stable despite the inclusion of the donor age in our analyses (data not shown). Furthermore, neither the correlation of the Vβ segment usage of donor T cells nor the reactivation of CMV and/or EBV showed any association with the development of aGvHD in the corresponding recipients (Figure S7; Table S2).
In order to verify our observations, we generated contingency tables using the donor TCRβ diversity in the CD4+ and CD8+ T cell compartment after G-CSF mobilization and various clinical outcomes of the stem cell recipients. The T cell diversity was categorized into high and low based on its deviation from the mean value. According to this classification, the correlation between lower donor CD4+ TCRβ diversity and virus reactivation (CMV and EBV) was again significant (Table 3; CMV: χ2-test, p = 0.035; EBV: χ2-test, p = 0.020). In addition, a significant difference between lower CD8+ TCRβ diversity and the age of the donor (χ2-test, p = 0.035) could be demonstrated. Thus, our observation of a negative correlation between donor CD4+ T cell repertoire diversity and virus reactivation in stem cell–transplanted patients as well as a restricted CD8+ TCRβ repertoire in elderly donors was confirmed via contingency tables (Table 3).
Table 3.
TCRβ repertoire diversity and clinical correlation
| CD4+ T cells |
CD8+ T cells |
||||||||
|---|---|---|---|---|---|---|---|---|---|
| Donor TCRβ repertoire | >Mean | <Mean | Total | p-value χ2-test | >Mean | <Mean | Total | p-value χ2-test | |
| Donor type | MUD | 9 | 5 | 14 | 8 | 7 | 15 | ||
| SIB | 5 | 3 | 8 | 0.933 | 2 | 5 | 7 | 0.277 | |
| Donor age | <40 | 5 | 2 | 7 | 5 | 2 | 7 | ||
| >40 | 8 | 5 | 13 | 0.658 | 3 | 10 | 14 | 0.035 | |
| Patient | |||||||||
| Survival | Alive | 9 | 7 | 16 | 8 | 9 | 17 | ||
| Dead | 5 | 1 | 6 | 0.240 | 2 | 3 | 5 | 0.781 | |
| TRM | Alive | 11 | 7 | 18 | 9 | 10 | 19 | ||
| Dead | 3 | 1 | 4 | 0.601 | 1 | 2 | 3 | 0.650 | |
| Relapse | No | 10 | 6 | 16 | 6 | 10 | 16 | ||
| Yes | 4 | 2 | 6 | 0.856 | 4 | 2 | 6 | 0.221 | |
| EBV reactivation | No | 12 | 3 | 15 | 7 | 8 | 15 | ||
| Yes | 2 | 5 | 7 | 0.020 | 3 | 4 | 7 | 0.867 | |
| CMV reactivation | No | 10 | 2 | 12 | 5 | 6 | 11 | ||
| Yes | 4 | 6 | 10 | 0.035 | 5 | 6 | 11 | 1.000 | |
| aGvHD | No | 4 | 2 | 6 | 2 | 4 | 6 | ||
| Yes | 10 | 6 | 16 | 0.856 | 8 | 8 | 16 | 0.484 | |
Contingency table of donor CD4+ and CD8+ T cell diversity post–G-CSF mobilization in correlation with clinical parameters of the recipients. Groups were divided according to their clonotype numbers above or below the compartment mean (CD4+ mean = 2490 clonotypes; CD8+ mean = 1661 clonotypes). According to this classification, a correlation between lower donor CD4+ TCRβ diversity and virus reactivation (CMV and EBV) was significant. In addition, a significant correlation could be demonstrated between lower CD8+ TCRβ diversity and the age of the donor.
aGvHD, acute graft-versus-host disease; χ2-test, chi-squared test; TRM, transplant-related mortality.
Finally, to independently validate the diversity of the TCRβ repertoires, we employed the Shannon entropy for each sample. Thereby, it could be confirmed that a higher CD4+ T cell repertoire in donors after G-CSF–induced stem cell mobilization is associated with a lower virus reactivation in the related recipients (Figure S8A; Mann–Whitney U-test: CMV: p = 0.034; EBV: p = 0.003) and that the CD8+ TCRβ repertoire is restricted in elderly donors (Figure S8B; Pearson's correlation: preMOB: r = −0.55; p = 0.008; postMOB: r = −0.52; p = 0.013; n = 22).
Discussion
After aHSCT, delayed reconstitution of the donor T cell compartment with respect to cell number but also T cell repertoire is regarded as a risk factor for relapse and infectious complications (3,5,7,21). So far, previous studies focused on the impact of T cell development in the recipients after aHSCT not considering the T cell repertoire of the donors. However, the donor-derived repertoire—especially after G-CSF mobilization—lays the basis for T cell composition in the stem cell recipient and therefore may have great impact for the clinical course after transplantation. Hence, we analyzed the T cell composition of the stem cell donors before G-CSF mobilization and on the day of apheresis. Thanks to the advances in HTS techniques, we were able to assess the TCR beta (TCRβ) repertoire diversity of the donors and correlated the results with the clinical outcome of the corresponding stem cell recipients.
For a more adequate interpretation of the data generated from the stem cell donors, we additionally analyzed flow cytometry–sorted CD4+ and CD8+ T cells isolated from a control cohort of six healthy volunteers. Consistent with published findings, we demonstrated a very similar usage of the Vβ and Jβ gene segments and a Gaussian-like distribution of the CDR3 length in all six individuals (Figure 1A and B) (18). Furthermore, our analysis led to the identification of more dominant clonotypes in CD8+ T cells in comparison to CD4+ T cells (Figure 1C) (22). In consequence, the analyzed CD4+ T cell compartment displayed a higher T cell diversity (Figure 1D). This observation is also in perfect harmony with published data and confirms the reliability of our approach (23). Of special interest are the results derived from the comparison of the T cell composition of (i) different DNA aliquots from the same DNA preparation of the same T cell sort, (ii) different T cell sorts of the same individual at the same time point and (iii) sorted T cells of different individuals. Merely 4.1% and 3.2% of the TCRβ rearrangements were found to be identical after bioinformatics analysis of the HTS data when the two DNA aliquots of the same CD4+ T cell sort or the different CD4+ T cell sorts of the same individual, respectively, were compared. Consistent with the lower diversity of the CD8+ T cell compartment, the percentage of overlapping TCRβ rearrangements was higher in the two DNA aliquots and in both CD8+ T cell sorts of the same individual (13.7% and 9.2%; Figure 1E). In contrast, there was almost no overlap in the TCR repertoires of the CD4+ or CD8+ T cell compartment of different individuals (0.03% and 0.19%; Figure 1F). Much higher overlaps might be anticipated in repeated analysis of samples derived from same individuals. However, the low percentage of identical T cell rearrangements in the same DNA preparation or in identical cell sorts is very logical in light of the enormous T cell heterogeneity in healthy individuals (9). This implies that the DNA aliquots (100 ng equivalent to approx. 14 500 T cells) subjected to multiplex TCRβ PCR and HTS largely consist of individual TCRβ rearrangements not present in the second DNA aliquot or parallel T cell sorts. Only those rearrangements that occur at higher frequencies will be identified in two independent PCRs. This is precisely the reason as to why in CD8+ T cells the overlap is higher in the two DNA aliquots or in the same T cell sort of the same individual as compared to the CD4+ T cells. We are well aware of the fact that we analyzed only a very small fraction of the entire T cell repertoire of a given individual, but we are very much convinced that our HTS approach is representative enough to reliably reflect T cell composition and T cell diversity.
Our TCR analysis approach was then applied to monitor the T cell diversity of the CD4+ and CD8+ T cells of 23 allogeneic stem cell donors before G-CSF administration and on the day of apheresis. These analyses confirmed the higher diversity in the CD4+ T cell compartment, which was in line with our control experiments and indicated no significant changes in the Vβ and Jβ usage, the CDR3 length distribution and the diversity of the CD4+ and CD8+ T cell compartment under G-CSF administration (Figures 2A and D and S2). Furthermore, we neither observed a correlation of diversity with the increase of T cell numbers after G-CSF mobilization in the peripheral blood nor with T cell numbers in the graft as a large randomly drawn sample of the peripheral blood (Figure S5), indicating that G-CSF indiscriminately mobilizes T cells into the peripheral blood. Moreover, we were able to illustrate that the TCRβ repertoire in CD8+ T cells is reduced as a function of age (Figure 2E; Table 3). This observation is supported on a molecular level by previous data showing that CD8+ T cells lose their naïve T cell compartment more rapidly than CD4+ T cells during mid-adulthood and most recently published data confirmed age-related decreases in TCRβ repertoire diversity by HTS (24,25).
The idea of our study is based on the assumption that the T cell composition of the donor after G-CSF mobilization is of crucial importance for the clinical outcome of the stem cell recipient. To this end, we compared the TCRβ rearrangements of the CD4+ and CD8+ T cells of 23 donors after stem cell mobilization with various clinical outcomes of the recipients. Those comparisons revealed no statistically significant correlations with one striking exception: We found that a lower CD4+ T cell diversity in donors after G-CSF mobilization was associated with reactivation of CMV and EBV in the stem cell recipients (Figure 3B; Table 3). These results complement very nicely a previously described association of CMV or EBV infection with lower TCR diversity, which was only analyzed in recipients and not in donors (23). However, it remains unclear to which extent the observed association between lower CD4+ T cell diversity and EBV reactivation could be a side effect of CMV reactivation.
Our data clearly demonstrate that HTS of the amplicons generated by TCRβ multiplex PCR provides a tool of crucial importance to study T cell repertoire and T cell diversity at the level of individual TCRβ gene rearrangements. This is also valid for small sample sizes with limited numbers of T cells. Thus, our approach is also applicable in clinical situations where merely specimens with low T cell counts are available.
In summary, the concept that the T cell repertoire before stem cell transplantation impacts the clinical outcome of recipients after aHSCT could be confirmed by our data. Reduced T cell diversity in the CD4+ T cell compartment of the donors after G-CSF mobilization and, in consequence, limited T cell diversity in the patient after transplantation is associated with viral reactivation. This notion supports concepts that would allow for rapid and early increase of the donor T cell repertoire by adoptive T cell therapy (26–28). Finally, since reduced TCRβ repertoires in donors correlate with an increased likelihood of viral reactivation in stem cell recipients, our TCRβ approach might pave the way for risk assessment of virus reactivation in patients.
Acknowledgments
The authors would like to thank Dr. Uwe Appelt for excellent cell sorting service and Dr. Christoph König for supporting the initial setup of experiments. Many thanks go to the staff of the BMT outpatient clinic of the University Hospital Erlangen. This work was supported by the BayImmuNet fund of the Government of Bavaria, by the German Research Foundation (DFG SFB643) and by a grant from the “Zentrales Innovationsprogramm Mittelstand” (KF 2766401FRO).
Glossary
- aGvHD
acute graft-versus-host disease
- aHSCT
allogeneic hematopoietic stem cell transplantation
- CDR3
hypervariable complementarity-determining region 3
- CMV
cytomegalovirus
- EBV
Epstein–Barr virus
- G-CSF
granulocyte colony-stimulating factor
- HTS
high-throughput sequencing
- TCRβ
T cell receptor beta
Disclosure
The authors of this manuscript have conflicts of interest to disclose as described by the American Journal of Transplantation. S.H. is CEO as well as cofounder of HS Diagnomics and V.S. is shareholder of HS Diagnomics. All other authors of this manuscript have no conflicts of interest to disclose.
Supporting Information
Additional Supporting Information may be found in the online version of this article.
Supplementary Methods
Figure S1: Cumulative incidence of viral reactivation after allogeneic stem cell transplantation. Reactivation was monitored weekly by PCR method. Number of clonotypes in donors after G-CSF mobilization was grouped in below and above mean value.
Figure S2: CDR3 length distribution in healthy control individuals. HTS-derived CDR3 length distribution of (A) CD4+ or (B) CD8+ TCRβ sequences for every control donor (C1–C6).
Figure S3: HTS-derived CDR3 length distribution of TCRβ sequences in G-CSF mobilized stem cell donors. HTS-derived CDR3 length distribution of CD4+ TCRβ sequences before (pre, A) or after (post, B) G-CSF–induced stem cell mobilization as well as the HTS-derived CDR3 length distribution of CD8+ TCRβ sequences pre–(C) or post–(D) G-CSF administration for every stem cell donor.
Figure S4: Cell counts in peripheral blood of donors before and after G-CSF administration. Diversity dot blots of cell counts of peripheral blood lymphocyte subsets before stem cell mobilization (preMOB) via G-CSF and at the day of apheresis (postMOB). Leukocytes were gated as CD45+ and lymphocytes as CD45highCD14− cells. Within the lymphocytic population, T cells were determined as CD3+, B cells as CD19+, NK cells as CD56+ CD3− cell populations. T cell subpopulations were analyzed upon CD4 and CD8 expression. Cell counts per µL whole blood were calculated based on the number of beads and the sample volume in TruCount tubes (BD Biosciences, Franklin Lakes, NJ). The numbers of all lymphocytic subsets increased significantly after G-CSF administration (Mann–Whitney U-test).
Figure S5: TCR diversity in correlation with cell numbers of the donor peripheral blood or the stem cell graft. Scatter plots of CD4+ and CD8+ T cell diversity and (A) absolute T cell counts (CD4+ and CD8+ T cells) in peripheral blood of stem cell donors post–G-CSF mobilization and (B) cell counts of CD3+ cells (per kg recipient bodyweight) in the graft. There was no correlation of TCRβ diversity with peripheral blood cell counts.
Figure S6: CD4+ TCR repertoire diversity of CMV/EBV-seropositive or -seronegative donors before and after G-CSF mobilization. Diversity dot blots of CMV- and/or EBV-seronegative (left panel) and -seropositive donors (right panel). Changes in CD4+ T cell diversity after G-CSF treatment are independent of the serostatus of the donor.
Figure S7: Vβ subgroup usage in donors whose recipients later suffered from GvHD. Mean frequencies of Vβ subgroup usage of TCRs from CD4+ (A) or CD8+ (B) T cells in donors segregated by appearance of aGvHD in recipients. Seven of the most frequent Vβ subgroups were illustrated individually in the bar plot (left panel). The remaining subgroups were compiled. The nomenclature according to the international ImMunoGeneTics information system (IMGT) was used. The right panel shows the individual frequencies of all donors. No significant differences could be shown between these two groups.
Figure S8: Donor TCRβ analyses using Shannon entropy (HS). (A) Diversity dot plots of CD4+ and CD8+ T cell preparation from G-CSF mobilization grouped according to reactivation of CMV or EBV. Donors of patients without CMV and/or EBV reactivation showed significant higher diversity in the CD4+ T cell compartment post–G-CSF mobilization (*p = 0.034; **p = 0.003). In CD8+ T cells, no significant difference could be detected. (B) Scatter plots of CD8+ T cell diversity and the age for stem cell donors pre– and post–G-CSF mobilization. The diversity of CD8+ T cells decreases with increasing donor age irrespective of G-CSF mobilization (preMOB: r = −0.55; p = 0.008; postMOB: r = −0.52; p = 0.013; n = 22).
Table S1: Characteristics of 23 stem cell recipients.
Table S2: Risk factors for aGvHD incidence.
Table S3: Primer sequences.
References
- Theilgaard-Monch K, Raaschou-Jensen K, Andersen H, et al. Single leukapheresis products collected from healthy donors after the administration of granulocyte colony-stimulating factor contain ten-fold higher numbers of long-term reconstituting hematopoietic progenitor cells than conventional bone marrow allografts. Bone Marrow Transplant. 1999;3:243–249. doi: 10.1038/sj.bmt.1701579. [DOI] [PubMed] [Google Scholar]
- Pan L, Delmonte J, Jr, Jalonen CK, Ferrara JL. Pretreatment of donor mice with granulocyte colony-stimulating factor polarizes donor T lymphocytes toward type-2 cytokine production and reduces severity of experimental graft-versus-host disease. Blood. 1995;12:4422–4429. [PubMed] [Google Scholar]
- Seggewiss R, Einsele H. Immune reconstitution after allogeneic transplantation and expanding options for immunomodulation: An update. Blood. 2010;19:3861–3868. doi: 10.1182/blood-2009-12-234096. [DOI] [PubMed] [Google Scholar]
- Fallen PR, McGreavey L, Madrigal JA, et al. Factors affecting reconstitution of the T cell compartment in allogeneic haematopoietic cell transplant recipients. Bone Marrow Transplant. 2003;10:1001–1014. doi: 10.1038/sj.bmt.1704235. [DOI] [PubMed] [Google Scholar]
- Maury S, Mary JY, Rabian C, et al. Prolonged immune deficiency following allogeneic stem cell transplantation: Risk factors and complications in adult patients. Br J Haematol. 2001;3:630–641. doi: 10.1046/j.1365-2141.2001.03135.x. [DOI] [PubMed] [Google Scholar]
- Nikolich-Zugich J, Slifka MK, Messaoudi I. The many important facets of T-cell repertoire diversity. Nat Rev Immunol. 2004;2:123–132. doi: 10.1038/nri1292. [DOI] [PubMed] [Google Scholar]
- Feuchtinger T, Lucke J, Hamprecht K, et al. Detection of adenovirus-specific T cells in children with adenovirus infection after allogeneic stem cell transplantation. Br J Haematol. 2005;4:503–509. doi: 10.1111/j.1365-2141.2004.05331.x. [DOI] [PubMed] [Google Scholar]
- Khan N. The immunological burden of human cytomegalovirus infection. Arch Immunol Ther Exp (Warsz) 2007;5:299–308. doi: 10.1007/s00005-007-0037-3. [DOI] [PubMed] [Google Scholar]
- Arstila TP, Casrouge A, Baron V, Even J, Kanellopoulos J, Kourilsky P. A direct estimate of the human alphabeta T cell receptor diversity. Science. 1999;5441:958–961. doi: 10.1126/science.286.5441.958. [DOI] [PubMed] [Google Scholar]
- Langerak AW, van Den Beemd R, Wolvers-Tettero IL, et al. Molecular and flow cytometric analysis of the Vbeta repertoire for clonality assessment in mature TCRalphabeta T-cell proliferations. Blood. 2001;1:165–173. doi: 10.1182/blood.v98.1.165. [DOI] [PubMed] [Google Scholar]
- van den Beemd R, Boor PP, van Lochem EG, et al. Flow cytometric analysis of the Vbeta repertoire in healthy controls. Cytometry. 2000;4:336–345. doi: 10.1002/1097-0320(20000801)40:4<336::aid-cyto9>3.0.co;2-0. [DOI] [PubMed] [Google Scholar]
- Friedman TM, Goldgirsh K, Berger SA, et al. Overlap between in vitro donor antihost and in vivo posttransplantation TCR Vbeta use: A new paradigm for designer allogeneic blood and marrow transplantation. Blood. 2008;8:3517–3525. doi: 10.1182/blood-2008-03-145391. [DOI] [PMC free article] [PubMed] [Google Scholar]
- Memon SA, Sportes C, Flomerfelt FA, Gress RE, Hakim FT. Quantitative analysis of T cell receptor diversity in clinical samples of human peripheral blood. J Immunol Methods. 2012;1/2:84–92. doi: 10.1016/j.jim.2011.09.012. [DOI] [PMC free article] [PubMed] [Google Scholar]
- Robins HS, Campregher PV, Srivastava SK, et al. Comprehensive assessment of T-cell receptor beta-chain diversity in alphabeta T cells. Blood. 2009;19:4099–4107. doi: 10.1182/blood-2009-04-217604. [DOI] [PMC free article] [PubMed] [Google Scholar]
- Freeman JD, Warren RL, Webb JR, Nelson BH, Holt RA. Profiling the T-cell receptor beta-chain repertoire by massively parallel sequencing. Genome Res. 2009;10:1817–1824. doi: 10.1101/gr.092924.109. [DOI] [PMC free article] [PubMed] [Google Scholar]
- Warren RL, Freeman JD, Zeng T, et al. Exhaustive T-cell repertoire sequencing of human peripheral blood samples reveals signatures of antigen selection and a directly measured repertoire size of at least 1 million clonotypes. Genome Res. 2011;5:790–797. doi: 10.1101/gr.115428.110. [DOI] [PMC free article] [PubMed] [Google Scholar]
- Shannon CE. The mathematical theory of communication. 1963. MD Comput. 1997;4:306–317. [PubMed] [Google Scholar]
- Robins HS, Srivastava SK, Campregher PV, et al. Overlap and effective size of the human CD8+ T cell receptor repertoire. Sci Transl Med. 2010;47:47ra64. doi: 10.1126/scitranslmed.3001442. [DOI] [PMC free article] [PubMed] [Google Scholar]
- van Dongen JJ, Langerak AW, Bruggemann M, et al. Design and standardization of PCR primers and protocols for detection of clonal immunoglobulin and T-cell receptor gene recombinations in suspect lymphoproliferations: Report of the BIOMED-2 Concerted Action BMH4-C T98-3936. Leukemia. 2003;12:2257–2317. doi: 10.1038/sj.leu.2403202. [DOI] [PubMed] [Google Scholar]
- Messaoudi I, Lemaoult J, Guevara-Patino JA, Metzner BM, Nikolich-Zugich J. Age-related CD8 T cell clonal expansions constrict CD8 T cell repertoire and have the potential to impair immune defense. J Exp Med. 2004;10:1347–1358. doi: 10.1084/jem.20040437. [DOI] [PMC free article] [PubMed] [Google Scholar]
- Gottschalk S, Rooney CM, Heslop HE. Post-transplant lymphoproliferative disorders. Annu Rev Med. 2005;56:29–44. doi: 10.1146/annurev.med.56.082103.104727. [DOI] [PubMed] [Google Scholar]
- Klarenbeek PL, Tak PP, van Schaik BD, et al. Human T-cell memory consists mainly of unexpanded clones. Immunol Lett. 2010;1:42–48. doi: 10.1016/j.imlet.2010.06.011. [DOI] [PubMed] [Google Scholar]
- van Heijst JW, Ceberio I, Lipuma LB, et al. Quantitative assessment of T cell repertoire recovery after hematopoietic stem cell transplantation. Nat Med. 2013;3:372–377. doi: 10.1038/nm.3100. [DOI] [PMC free article] [PubMed] [Google Scholar]
- Goronzy JJ, Lee WW, Weyand CM. Aging and T-cell diversity. Exp Gerontol. 2007;5:400–406. doi: 10.1016/j.exger.2006.11.016. [DOI] [PMC free article] [PubMed] [Google Scholar]
- Britanova OV, Putintseva EV, Shugay M, et al. Age-related decrease in TCR repertoire diversity measured with deep and normalized sequence profiling. J Immunol. 2014;6:2689–2698. doi: 10.4049/jimmunol.1302064. [DOI] [PubMed] [Google Scholar]
- Peggs KS, Verfuerth S, Pizzey A, Chow SL, Thomson K, Mackinnon S. Cytomegalovirus-specific T cell immunotherapy promotes restoration of durable functional antiviral immunity following allogeneic stem cell transplantation. Clin Infect Dis. 2009;12:1851–1860. doi: 10.1086/648422. [DOI] [PubMed] [Google Scholar]
- Schmidt-Hieber M, Labopin M, Beelen D, et al. CMV serostatus still has an important prognostic impact in de novo acute leukemia patients after allogeneic stem cell transplantation: A report from the Acute Leukemia Working Party of EBMT. Blood. 2013;19:3359–3364. doi: 10.1182/blood-2013-05-499830. [DOI] [PubMed] [Google Scholar]
- Broers AE, van Der Holt R, van Esser JW, et al. Increased transplant-related morbidity and mortality in CMV-seropositive patients despite highly effective prevention of CMV disease after allogeneic T-cell-depleted stem cell transplantation. Blood. 2000;7:2240–2245. [PubMed] [Google Scholar]
Associated Data
This section collects any data citations, data availability statements, or supplementary materials included in this article.
Supplementary Materials
Supplementary Methods
Figure S1: Cumulative incidence of viral reactivation after allogeneic stem cell transplantation. Reactivation was monitored weekly by PCR method. Number of clonotypes in donors after G-CSF mobilization was grouped in below and above mean value.
Figure S2: CDR3 length distribution in healthy control individuals. HTS-derived CDR3 length distribution of (A) CD4+ or (B) CD8+ TCRβ sequences for every control donor (C1–C6).
Figure S3: HTS-derived CDR3 length distribution of TCRβ sequences in G-CSF mobilized stem cell donors. HTS-derived CDR3 length distribution of CD4+ TCRβ sequences before (pre, A) or after (post, B) G-CSF–induced stem cell mobilization as well as the HTS-derived CDR3 length distribution of CD8+ TCRβ sequences pre–(C) or post–(D) G-CSF administration for every stem cell donor.
Figure S4: Cell counts in peripheral blood of donors before and after G-CSF administration. Diversity dot blots of cell counts of peripheral blood lymphocyte subsets before stem cell mobilization (preMOB) via G-CSF and at the day of apheresis (postMOB). Leukocytes were gated as CD45+ and lymphocytes as CD45highCD14− cells. Within the lymphocytic population, T cells were determined as CD3+, B cells as CD19+, NK cells as CD56+ CD3− cell populations. T cell subpopulations were analyzed upon CD4 and CD8 expression. Cell counts per µL whole blood were calculated based on the number of beads and the sample volume in TruCount tubes (BD Biosciences, Franklin Lakes, NJ). The numbers of all lymphocytic subsets increased significantly after G-CSF administration (Mann–Whitney U-test).
Figure S5: TCR diversity in correlation with cell numbers of the donor peripheral blood or the stem cell graft. Scatter plots of CD4+ and CD8+ T cell diversity and (A) absolute T cell counts (CD4+ and CD8+ T cells) in peripheral blood of stem cell donors post–G-CSF mobilization and (B) cell counts of CD3+ cells (per kg recipient bodyweight) in the graft. There was no correlation of TCRβ diversity with peripheral blood cell counts.
Figure S6: CD4+ TCR repertoire diversity of CMV/EBV-seropositive or -seronegative donors before and after G-CSF mobilization. Diversity dot blots of CMV- and/or EBV-seronegative (left panel) and -seropositive donors (right panel). Changes in CD4+ T cell diversity after G-CSF treatment are independent of the serostatus of the donor.
Figure S7: Vβ subgroup usage in donors whose recipients later suffered from GvHD. Mean frequencies of Vβ subgroup usage of TCRs from CD4+ (A) or CD8+ (B) T cells in donors segregated by appearance of aGvHD in recipients. Seven of the most frequent Vβ subgroups were illustrated individually in the bar plot (left panel). The remaining subgroups were compiled. The nomenclature according to the international ImMunoGeneTics information system (IMGT) was used. The right panel shows the individual frequencies of all donors. No significant differences could be shown between these two groups.
Figure S8: Donor TCRβ analyses using Shannon entropy (HS). (A) Diversity dot plots of CD4+ and CD8+ T cell preparation from G-CSF mobilization grouped according to reactivation of CMV or EBV. Donors of patients without CMV and/or EBV reactivation showed significant higher diversity in the CD4+ T cell compartment post–G-CSF mobilization (*p = 0.034; **p = 0.003). In CD8+ T cells, no significant difference could be detected. (B) Scatter plots of CD8+ T cell diversity and the age for stem cell donors pre– and post–G-CSF mobilization. The diversity of CD8+ T cells decreases with increasing donor age irrespective of G-CSF mobilization (preMOB: r = −0.55; p = 0.008; postMOB: r = −0.52; p = 0.013; n = 22).
Table S1: Characteristics of 23 stem cell recipients.
Table S2: Risk factors for aGvHD incidence.
Table S3: Primer sequences.