

Abstract
Vitamin D receptor (VDR) polymorphisms have been studied as potential contributors to multiple sclerosis (MS). However, published studies differ with respect to study design and the significance of the effects detected. The aim of this study was to quantify the magnitude of the risk associated with the TaqI, BsmI, ApaI and FokI VDR polymorphisms in MS using a meta-analysis approach. Following the Preferred Reporting Items for Systematic Reviews and Meta-Analyses guidelines, we conducted a systematic search and meta-analysis of the literature. Subgroup analyses were performed to detect potential sources of heterogeneity from the selected study characteristics. The stability of the summary risk was evaluated using sensitivity analyses. The meta-analysis included a total of 3300 cases and 3194 controls from 13 case–control studies. There were no significant associations found between TaqI and BsmI polymorphisms and MS risk. The association between the ApaI polymorphism and MS risk was significant in the homozygous and codominant models (P=0.013 and P=0.031, respectively), suggesting that the AA ApaI genotype might be a significant MS risk factor. Publication year and age significantly affected the association between TaqI polymorphisms and MS (P=0.014 and P=0.010, respectively), which indicates a protective effect of the major T allele. The AA ApaI and FF FokI genotypes are significant risk factors for MS. The association between the TaqI polymorphism and MS risk is significantly affected by study characteristics.
Keywords: ApaI, BsmI, FokI, meta-analysis, multiple sclerosis, TaqI, VDR polymorphism
Introduction
Multiple sclerosis (MS) is an inflammatory neurodegenerative disorder characterized by autoimmune cell-mediated demyelination of nerve bundles in the central nervous system.1 Both genetic and environmental factors influence disease susceptibility.1 Vitamin D and Vitamin D receptor (VDR) could be considered as environmental and genetic factors in neurodegenerative disorders including MS.2,3 They have anti-inflammatory and anti-proliferative properties and promote the innate immune response.2
Among the genes regulating vitamin D metabolism, VDR gene variants have been the most frequently studied in MS and other diseases. Vitamin D and its analogues exert their actions through the nuclear VDR.4 The VDR is a ligand-dependent transcription factor that forms a complex with hormonally active vitamin D and regulates the expression of genes associated with inflammation and immune modulation.5,6 The complex is expressed in immune cells, neuronal cells and glial cells.7
The most studied polymorphisms in the VDR gene are BsmI,8 ApaI,9 TaqI10 and FokI.11 BsmI and ApaI polymorphisms are located in intron 8 of the VDR gene and TaqI is located in exon 9. cette information est à vérifié.12 The FokI polymorphism is located in exon 2 and leads to a protein with a different size. The shorter form of the protein (424 amino acids) is more active than the long form (427 amino acids).13 Genetic alterations of the VDR gene and poor vitamin status could lead to the initiation and propagation of a range of autoimmune diseases including MS.14,15,16,17
The association of VDR polymorphisms with MS have been investigated in many countries, but results are still uncertain.3,18,19,20,21,22,23,24,25,26,27,28,29,30,31,32,33 Steckely et al.34 found no evidence for linkage or association of VDR [12q14] loci with MS in a Canadian population. Recently, a meta-analysis of VDR polymorphisms and MS showed that ApaI, BsmI, FokI and TaqI VDR polymorphisms are not associated with MS risk.35 The objective of the current study was to investigate the association of VDR polymorphisms with MS risk and to assess the influence of study characteristics using a meta-analysis.
Materials and methods
Identification of eligible studies
The review process followed the Preferred Reporting Items for Systematic Reviews and Meta-Analyses guidelines.36 We performed a literature search using MEDLINE and EMBASE to identify articles that examined the associations between TaqI, BsmI, ApaI and FokI polymorphisms and MS. Combinations of keywords, such as ‘VDR polymorphism' and ‘multiple sclerosis' were entered as medical subject headings (MeSH) and text words. The reference lists of the articles retrieved were also reviewed to identify publications on the same topic. The literature searches were performed in duplicate by two independent reviewers.
Inclusion criteria and data extraction
The meta-analysis included case–control studies that reported the number of individual genotypes and/or alleles for VDR polymorphisms in cases and in controls. Each study had disease outcome definitions that followed accepted diagnostic guidelines.37,38 The following information was extracted from each study: author, publication year, ethnicity, country, gender, age, haplotypes and vitamin D serum level analyses for each VDR polymorphism.
Statistical analyses
The data from studies were combined to produce a summary odds ratio (OR) and summary ORs was represented as an estimated value and 95% confidence intervals (CIs) on a forest plot. The methodology for meta-analysis of molecular studies was described by Thakkinstian et al.39 The OR1, OR2 and OR3 values were calculated for the following genotypes: (i) TT vs. tt (OR1), Tt vs. tt (OR2) and TT vs. Tt (OR3) for the TaqI polymorphism; (ii) BB vs. bb (OR1), Bb vs. bb (OR2) and BB vs. Bb (OR3) for BsmI polymorphism; (iii) AA vs. aa (OR1), Aa vs. aa (OR2) and AA vs. Aa (OR3) for ApaI polymorphism; and (iv) FF vs. ff (OR1), Ff vs. ff (OR2) and FF vs. Ff (OR3) for the FokI polymorphism. The pairwise differences were used to indicate the most appropriate genetic model as follows: if OR1=OR3≠1 and OR2=1, then a recessive model was suggested; if OR1=OR2≠1 and OR3=1, then a dominant model was suggested; if OR2=1/OR3≠1 and OR1=1, then a complete overdominant model (homozygous) was suggested; if OR1>OR2>1 and OR1>OR3>1 (or OR1<OR2<1 and OR1<OR3<1), then a codominant model was suggested.39 The data heterogeneity was evaluated using the Q-statistic.40 When the significant Q-statistic indicated heterogeneity across studies, then a random effects model was used. I2 values of 25%, 50% and 75% were defined as low, moderate, and high estimates, respectively. An Egger's regression test was used to search for publication bias.41 The subgroup analyses were planned when sufficient information was reported in at least four studies in each subgroup. The stability of the summary risk estimate was evaluated using a sensitivity analysis in which each study was individually removed and the odds ratio was recalculated. A comprehensive meta-analysis version 2 was used to conduct the meta-analysis, sequential analysis and publication bias assessment.
Results
Characteristics of studies
Appropriate diagnostic criteria and proper genotyping methods were used in all included studies. Eighteen studies were identified using the specified search terms. Five studies were ineligible for the following reasons: cross-sectional study,30 sizes of cases and/or controls were not reported.20,22 One study was available as only an abstract.31 Therefore, 13 case–control studies reporting genotypic frequencies in cases and in controls were included in meta-analyses.3,18,19,21,23,24,25,26,27,28,29,32,33
The studies were heterogeneous for population composition and for geographic characteristics. Each study character was subdivided into different subgroups. The publication year was subdivided into four subgroups: ‘<2001',3,18 ‘2001–2005',19,21 ‘2006–2010' 23,24,25,26 and ‘2011–2013'.27,28,29,32,33 The patient ethnicities included Caucasian Europeans for a majority of studies. There were only two populations with Asian patients.3,18 The study region latitude was subdivided into three subgroups: ‘30.1–40°N',23,28,33 ‘40.1–50°N'3,19,25,26,27,32 and ‘22°S'.21 Age was subdivided into two subgroups: ‘20–40 years'3,18,27,28,29 and ‘>40 years'.19,23,24,25,26,32,33 Based on Garland et al.,42 the estimated 25(OH)D serum levels were subdivided into three subgroups: ‘0–24 ng/ml',3,18,19,24,25,26,27 ‘24.1–30.2 ng/ml' 32,33 and ‘30.3–49.9 ng/ml'.21,23 The studies were homogenous for sex ratio (males <50%).
The genotype distributions of all single nucleotide polymorphisms in controls and patients exhibited Hardy–Weinberg equilibrium. Disability was assessed by the Expanded Disability Status Scale (EDSS). The outcome was stratified into mild/moderate (EDSS 0–5.5) or severe (EDSS 6–10) disability. In the included studies, the EDSS was mild/moderate (EDSS 0–5.5) except for a small deviation in the study of Cox et al.29 where 35.8% of MS patients had an EDSS ≥6. The patient stratification according to type of MS was provided in the majority of studies. The MS patients were stratified into relapsing–remitting (RR), secondary progressive (SP) and primary progressive (PP) groups. In the included studies, the frequency of RR varied between 45% and 65%, and the frequency of SP varied between 26% and 45%. The frequency of RR varied between 0.00% and 24% except in the study of Agliardi et al.27 where the ratio between RR and PP was 5∶1. A combined case–control dataset from Australia and UK was studied by Cox et al.29 In the study by Agliardi et al.,27 the experience was replicated in two groups: HLA-DRBE*15-positive and HLA-DRBE*15-negative subjects.
The results of the studies are given in Figure 1, and study characteristics are summarized in Table 1.
Figure 1.
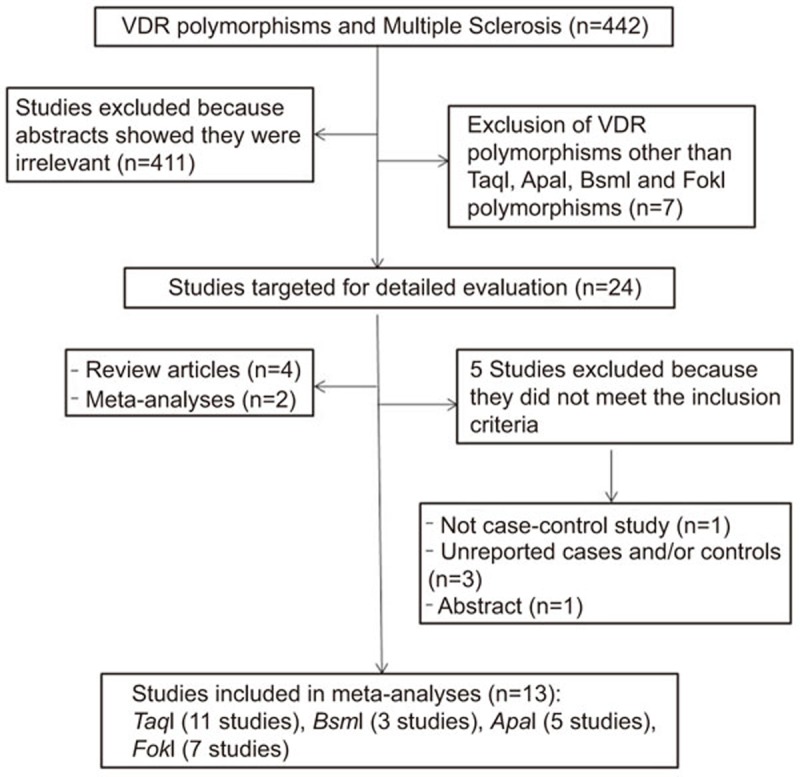
Flow diagram of the systematic review and meta-analysis literature search results. VDR, vitamin D receptor.
Table 1. Characteristics of reviewed studies on TaqI, ApaI, BsmI and FokI VDR polymorphisms and multiple sclerosis disease.
| Reference | VDR polymorphisms | Ethnicity | Country | Latitude | 25(OH)D levels (ng/ml)a | Case | Control |
|---|---|---|---|---|---|---|---|
| Fukazawa 1999 | BsmI | Asians | Japan, Sapporo | 43°N | 0–24 | 77 | 95 |
| Niino 2000 | ApaI, TaqI | Asians | Japan, Sapporo | 43°N | 0–24 | 77 | 95 |
| Partridge 2004 | TaqI, FokI | European Caucasians | United Kingdom, Manchester | 42°N | 0–24 | 406 | 234 |
| Dickinson 2009 | TaqI, FokI | Australian | Australia, Tasmania | 40°N | 30.3–49.9 | 136 | 235 |
| Tajouri 2005 | ApaI,TaqI, FokI | Australian Caucasians | Australia, Queensland | 22°S | 30.3–49.9 | 104 | 100 |
| Smolders 2009 | ApaI, TaqI | Caucasian | Netherlands, Maastricht | 50°N | 0–24 | 212 | 289 |
| Smolders 2009 | FokI | Caucasian | Netherlands, Maastricht | 50°N | 0–24 | 212 | 289 |
| Simon 2010 | BsmI, ApaI, TaqI, FokI | White American | The United States, Boston, CA | 48°N | 0–24 | 101 | 100 |
| Agliardi 2011 | TaqI | European Caucasians | Italy | 44°N | 0–24 | 512 | 249 |
| Sioka 2011 | BsmI, TaqI | European Caucasians | Greece, Ioannina | 39°N | 24.1–30.2 | 69 | 81 |
| Cox 2012 | TaqI, FokI | Caucasians | United Kingdom, Australia | Matched | Matched | 727 | 604 |
| Irizar 2012 | ApaI, TaqI | European Caucasians | Spain, Basque | 42°N | 24.1–30.2 | 364 | 513 |
| Garcıa-Martın 2013 | TaqI, FokI | European Caucasians | Spain, Madrid | 40°N | 24.1–30.2 | 303 | 310 |
| Reference | Genotyping | Age (case/control) | %male (case/control) | χ2 | Haplotype analysis | Serum VD dosage |
|---|---|---|---|---|---|---|
| Fukazawa 1999 | PCR-RFLP | 36.2 | 27.27 | 6.04 | — | — |
| Niino 2000 | PCR-RFLP | 36.2±11.2 | Matched | 9.93 | × | — |
| Partridge 2004 | PCR-RFLP | 43.8±11.2/31.0±9.8 | 25.1 | 1.34, 4.17 | — | — |
| Dickinson 2009 | PCR-RFLP | 43.5/43.6 | 32.35 | 2.17, 1.84 | — | × |
| Tajouri 2005 | PCR-RFLP | Matched | 25 | 4.60, 8.26, 2.68 | — | — |
| Smolders 2009 | PCR-RFLP | 46.7±11.9/34.9±14.3 | 29/50 | 2.31, 0.53 | — | × |
| Smolders 2009 | PCR-RFLP | 46.7±11.9/34.9±14.3 | 29/50 | 0.25 | — | × |
| Simon 2010 | TaqMan assay | 30–55 | Women | 1.50, 0.61, 1.64, 0.81 | — | — |
| Agliardi 2011 | TaqMan assay | 27.8±9.2/29.4±6.5 | 33.33/33.33 | 9.23, 0.58 | — | — |
| Sioka 2011 | Taqman assay | 39±10.5/38.7±10.7 | 33.33/56.79 | 0.16 | — | — |
| Cox 2012 | Taqman assay | 34.16 Aust, 29.17 United Kingdom | Matched | Not mentioned | × | — |
| Irizar 2012 | PCR-RFL P | 44.14±13.02/50.15±13.26 | 38.8/44.4 | 2.93, 1.16 | — | — |
| Garcıa-Martın 2013 | TaqMan assay | 43.9±11.4/43.4±11.7 | 31.1/31.61 | 2.01, 3.08 | × | — |
| Reference | Type of MS (%) | BMI (case/control) (kg/m2) | BMD LS (case/control) | Supplemental vitamin D intake | Administration of corticosteroids | EDSS scoring |
|---|---|---|---|---|---|---|
| Fukazawa 1999 | RR: 55.8, SP: 44.2, PP: 0 | — | — | — | — | 3.4±2.7 |
| Niino 2000 | RR: 55.8, SP: 44.2, PP: 0 | — | — | — | — | 3.4±2.7 |
| Partridge 2004 | — | — | — | — | — | 5.0 |
| Dickinson 2009 | RR: 66.42, SP: 26.12, PP: 7.46 | — | — | — | — | — |
| Tajouri 2005 | RR: 40, SP: 36, PP: 24 | — | — | — | — | — |
| Smolders 2009 | RR: 45.8, SP: 34.0, PP: 17.9 | — | — | — | — | 4.24±2.28 |
| Smolders 2009 | RR: 45.8, SP: 34.0, PP: 17.9 | — | — | — | — | 4.24±2.28 |
| Simon 2010 | — | — | — | + | — | — |
| Agliardi 2011 | RR: 83.33, SP: 0, PP: 16.67 | — | — | — | — | — |
| Sioka 2011 | RR: 68.12, SP: 28.99, PP: 2.99 | 24.8±4.2/25.7±4.8 | 0.98±0.15/1.02 5±0. | None | none | 2.13±2.15 |
| Cox 2012 | RR: 62.85, SP: 23.7, PP: 9.3 | — | — | — | — | <3 (32.15%)3–6 (31.5%)≥6 (35.8%) |
| Irizar 2012 | — | — | — | — | — | — |
| Garcia-Martin 2013 | RR: 54.13, SP: 31.02, PP: 14.85 | — | — | — | — | 4.7±2.2 |
BsmI (rs1544410 G>A), ApaI (rs7975232 A>C), TaqI (rs731236 T>C), FokI(rs2228570 C>T).
Estimated 25(OH)D serum levels (ng/ml) according to Garland et al.42
PCR, polymerase chain reaction; RFLP: restriction fragment length polymorphism; χ2: Hardy–Weinberg equilibrium test; (×), analysis conducted; (—), analysis not conducted.
BMD: Bone Mineral Density; BMI: Body Mass Index; EDSS, Expanded Disability Scale Score; LS, lumbar spine; MS, multiple sclerosis; PP, primary progressive MS; RR, relapsing–remitting MS; SP, secondary progressive MS; (—), not mentioned.
Data analysis
TaqI polymorphism
A total of 3011 cases and 2810 controls in 11 case–control studies were included in this meta-analysis. We assumed diversity among studies and used the random effects model, which is preferable in the presence or anticipation of any between-study heterogeneity. The analyses showed that TaqI polymorphism was not associated with MS in any of the studied models. The estimated OR1, OR2 and OR3 were 1.030, 0.939 and 0.879, respectively. These estimates suggested a homozygous genetic model. The pooled OR1 was 0.903 (95% CI: 0.783–1.042; P=0.163) (Figure 2). The heterogeneity was low (I2=23.26%). There was no evidence of publication bias detected by Egger's test (Egger P=0.14). The sensitivity analysis by removal of each individual study did not meaningfully change the results. The estimated OR based on the allele contrast model was OR=0.925 (95% CI: 0.839–1.02; P=0.119). This result indicated that the major T allele did not have any significant effect on MS (Table 2).
Figure 2.

Forest plot of the association between TaqI polymorphism and multiple sclerosis risk with the random effects model: TT+tt vs. Tt. Forest plot shows the odds ratio and respective 95% confidence intervals for the different studies included in the meta-analysis. For each study in the forest plot, the area of the black square is proportional to study weight and the horizontal bar represents the 95% confidence interval. Z-score: the standardized expression of a value in terms of its relative position in the full distribution of values. CI, confidence interval; MS, multiple sclerosis.
Table 2. Association between TaqI, BsmI, ApaI and FokI VDR polymorphisms and multiple sclerosis risk.
| (n) | Genetic model | OR (95% CI) | P value | I2 (%) | Egger's P | |
|---|---|---|---|---|---|---|
| TaqI (11) | Recessive | TT vs. Tt+tt | 0.887 (0.750–1.049) | 0.163 | 39.837 | 0.23 |
| Homozygous* | TT+tt vs. Tt | 0.903 (0.783–1.042) | 0.163 | 23.261 | 0.14 | |
| Dominant | TT+Tt vs. tt | 0.983 (0.819–1.80) | 0.854 | 6.723 | 0.17 | |
| Codominant (OR1) | TT vs. tt | 1.030 (0.856–1.238) | 0.754 | 0.00 | 0.11 | |
| Codominant (OR2) | Tt vs. tt | 0.939 (0.775–1.139) | 0.522 | 21.342 | 0.47 | |
| Codominant (OR3) | TT vs. Tt | 0.879 (0.739–1.045) | 0.144 | 37.452 | 0.16 | |
| Allele contrast | T vs. t allele | 0.925 (0.839–1.02) | 0.119 | 31.295 | 0.29 | |
| Recessive | BB vs. Bb+bb | 1.256 (0.816–1.935) | 0.300 | 0.00 | 0.13 | |
| BsmI (3) | Homozygous | BB+bb vs. Bb | 1.309 (0.847–2.023) | 0.224 | 0.00 | 0.02 |
| Dominant | BB+Bb vs. bb | 0.818 (0.222–3.012) | 0.762 | 82.43 | — | |
| Codominant (OR1)* | BB vs. bb | 0.845 (0.268–2.663 | 0.774 | 75.69 | — | |
| Codominant (OR2) | Bb vs. bb | 0.845 (0.268–2.663) | 0.817 | 57.76 | — | |
| Codominant (OR3) | BB vs. Bb | 0.770 (0.083–7.117) | 0.407 | 75.69 | 0.21 | |
| Allele contrast | B vs. b allele | 0.916 (0.510–1.645) | 0.771 | 73.36 | 0.11 | |
| ApaI (5) | Recessive | AA vs. Aa+aa | 1.400 (0.972–2.018) | 0.071* | 53.847 | 0.05 |
| Homozygous | AA+aa vs. Aa | 1.302 (1.058–1.603) | 0.013 | 0.00 | 0.36 | |
| Dominant | AA+Aa vs. aa | 0.995 (0.739–1.339) | 0.972 | 31.523 | 0.08 | |
| Codominant (OR1) | AA vs. aa | 0.832 (0.643–1.076) | 0.162 | 0.00 | 0.14 | |
| Codominant (OR2) | Aa vs. aa | 1.388 (0.850–2.267) | 0.190 | 64.206 | 0.16 | |
| Codominant (OR3) | AA vs. Aa | 1.468 (1.035–2.08) | 0.031 | 42.796 | 0.06 | |
| Allele contrast | A vs. a allele | 1.143 (0.911–1.433) | 0.246 | 54.499 | 0.08 | |
| FokI (7) | Recessive* | FF vs. Ff+ff | 1.031 (0.860–1.237) | 0.739 | 16.650 | 0.22 |
| Homozygous | FF+ff vs. Ff | 0.932 (0.794–1.093) | 0.388 | 0.00 | 0.02 | |
| Dominant | FF+Ff vs. ff | 1.245 (0.991–1.564) | 0.059* | 0.00 | 0.08 | |
| Codominant (OR1) | FF vs. ff | 1.255 (0.985–1.60) | 0.065* | 0.00 | 0.00 | |
| Codominant (OR2) | Ff vs. ff | 1.087 (0.829–1.426) | 0.544 | 29.468 | 0.25 | |
| Codominant (OR3) | FF vs. Ff | 0.983 (0.818–1.181) | 0.854 | 9.940 | 0.10 | |
| Allele contrast | F vs. f allele | 1.036 (0.937–1.145) | 0.491 | 8.499 | 0.23 |
Abbreviations: OR, odds ratio; VDR, vitamin D receptor.
Bold: significant P value (<0.05); bold*: marginal association (0.05<P<0.1); n, number of studies; I2, heterogeneity test.
ApaI polymorphism: one study removed25 in the recessive model: OR=1.588 (95% CI: 1.042–2.422; P=0.032).
When sufficient information was reported in at least four studies, then subgroup analyses were performed to examine the influence of each subgroup on the overall estimate. The subgroup analyses have fewer individuals and reduced power compared to the overall analysis. The sub-analyses showed that MS risk was significantly reduced in the ‘2011–2013' publication year group (OR=0.888 (95% CI: 0.808–0.976); P=0.014) in the allele contrast model. The major T allele had a protective effect in the ‘2011–2013' subgroup. Additionally, the >40 years age group was found to have significantly reduced MS risk (OR=0.865 (95% CI: 0.775–0.966); P=0.010) in the allele contrast model. When compared to the t allele, the T allele had a significant protective effect in elderly subjects. The results are summarized in Table 3.
Table 3. Association between TaqI polymorphism and multiple sclerosis: stratification according to study characteristics.
| Genetic model | Study characterestics | n | OR | P value | |
|---|---|---|---|---|---|
| Codominant | Publication year | 5 | 2011–2013 | 0.943 (0.736–1.208) | 0.645 |
| TT vs. tt | Latitude | 6 | 40.1°–50°N | 1.070 (0.860–1.334) | 0.542 |
| 25(OH)D levels | 5 | 0–24 ng/ml | 1.04 (0.827–1.311) | 0.729 | |
| Age | 6 | >40 years | 1.106 (0.823–1.486) | 0.502 | |
| Codominant | Publication year | 5 | 2011–2013 | 0.909 (0.746–1.107) | 0.342 |
| Tt vs. tt | Latitude | 6 | 40.1°–50°N | 0.970 (0.681–1.376) | 0.855 |
| 25(OH)D levels | 5 | 0–24 ng/ml | 0.998 (0.611–1.630) | 0.994 | |
| Age | 6 | >40 years | 0.970 (0.717–1.311) | 0.842 | |
| Codominant | Publication year | 5 | 2011–2013 | 0.874 (0.667–1.147) | 0.333 |
| TT vs. Tt | Latitude | 6 | 40.1°–50°N | 0.848 (0.694–1.036) | 0.106 |
| 25(OH)D levels | 5 | 0–24 ng/ml | 0.845 (0.660–1.081) | 0.180 | |
| Age | 6 | >40 years | 0.974 (0.825–1.149) | 0.754 | |
| Allele contrast | Publication year | 5 | 2011–2013 | 0.888 (0.808–0.976) | 0.014 |
| Latitude | 6 | 40.1°–50°N | 0.940 (0.825–1.071) | 0.354 | |
| 25(OH)D levels | 5 | 0–24 ng/ml | 1.01 (0.904–1.132) | 0.833 | |
| Age | 6 | >40 years | 0.865 (0.775–0.966) | 0.010 | |
| Recessive | Publication year | 5 | 2011–2013 | 0.872 (0.692–1.100) | 0.248 |
| latitude | 6 | 40.1°–50°N | 0.833 (0.732–1.07) | 0.199 | |
| 25(OH)D levels | 5 | 0–24 ng/ml | 0.879 (0.699–1.107) | 0.273 | |
| Age | 6 | >40 years | 0.988 (0.845–1.156) | 0.833 | |
| Homozygous | Publication year | 5 | 2011–2013 | 0.911 (0.712–1.166) | 0.459 |
| Latitude | 6 | 40.1°–50°N | 0.881 (0.735–1.056) | 0.172 | |
| 25(OH)D levels | 5 | 0–24 ng/ml | 0.888 (0.715–1.105) | 0.288 | |
| Age | 6 | >40 years | 0.959 (0.823–1.119) | 0.596 | |
| Dominant | Publication year | 5 | 2011–2013 | 0.899 (0.712–1.136) | 0.375 |
| Latitude | 6 | 40.1°–50°N | 1.102 (0.899–1.364) | 0.375 | |
| 25(OH)D levels | 5 | 0–24 ng/ml | 1.094 (0.860–1.390) | 0.465 | |
| Age | 6 | >40 years | 1.088 (0.833–1.421) | 0.533 |
Abbreviations: n, number of studies; OR, odds ratio.
Bold: significant P value (P<0.05); 25(OH)D levels, ng/ml; age, years.
All studied populations are Europeans Caucasians for TaqI polymorphism.
BsmIpolymorphism
A total of 247 cases and 276 controls in 3 case–control studies were included in this meta-analysis. The analyses showed that the BsmI polymorphism was not associated with MS in any of the studied genetic models. The estimated OR1, OR2 and OR3 were 0.845, 0.845, and 0.770, respectively. These estimates suggest a codominant genetic model. The pooled OR1 was 0.845 (95% CI: 0.268–2.663; P=0.774). The heterogeneity was high in BB vs. bb (I2=75.69%). In the allele contrast model the pooled OR was 0.916 (95% CI: 0.510–1.645; P=0.771) indicating no significant allelic effect on MS risk (Figure 3). We should note that only three studies were available on BsmI polymorphisms and MS. Thus, the results were not robust enough to produce final conclusive estimates. The results are summarized in Table 2.
Figure 3.

Forest plot of the association between BsmI polymorphism and multiple sclerosis risk with the random effects model: B vs. b allele. Forest plot shows the odds ratio and respective 95% confidence intervals for the different studies included in the meta-analysis. For each study in the forest plot, the area of the black square is proportional to study weight and the horizontal bar represents the 95% confidence interval. Z-score: the standardized expression of a value in terms of its relative position in the full distribution of values. CI, confidence interval; MS, multiple sclerosis.
ApaI polymorphism
A total of 858 cases and 1097 controls in five case–control studies were included in this meta-analysis. The analyses showed that the association between ApaI polymorphism and MS was significant in the homozygous (P=0.013) (Figure 4) and codominant (P=0.031) models. The polymorphism was marginally significant in the recessive model (P=0.071). In the recessive model, the exclusion of one study25 changed the results, and the recalculated OR=1.588 (95% CI: 1.042–2.422; P=0.032).
Figure 4.

Forest plot of the association between ApaI polymorphism and multiple sclerosis risk with the random effects model: AA+aa vs. Aa. Forest plot shows the odds ratio and respective 95% confidence intervals for the different studies included in the meta-analysis. For each study in the forest plot, the area of the black square is proportional to study weight and the horizontal bar represents the 95% confidence interval. Z-score: the standardized expression of a value in terms of its relative position in the full distribution of values. CI, confidence interval; MS, multiple sclerosis.
The estimated OR1, OR2 and OR3 were 0.832, 1.388, and 1.468, respectively. These estimates suggest a codominant model, and the pooled OR1=0.832 (95% CI: 0.643–1.076; P=0.162), OR2=1.388 (95% CI: 0.850–2.267; P=0.190) and OR3=1.468 (95% CI: 1.035–2.08; P=0.0311). The AA genotype was a significant MS risk factor. There was no heterogeneity in AA vs. aa (I2=0%). The sensitivity analysis by removal of each individual study did not meaningfully change the results in the codominant model. There was no evidence of publication bias detected by the Egger's test in AA vs. aa (Egger P=0.14) (Table 2).
The subanalyses showed that higher latitudes (40.1°–50°N) significantly reduced MS risk. The AA genotype tended to protect against MS in ‘40.1°–50°N' latitudes (OR=0.761 (95% CI: 0.579–1.000); P=0.050) (Table 4).
Table 4. Association between ApaI polymorphism and multiple sclerosis risk: stratification according to study characteristics.
| Genetic model | Study characteristics | n | OR | P value | |
|---|---|---|---|---|---|
| AA vs. aa | Ethnicity | 4 | Caucasian Europeans | 0.859 (0.624–1.181) | 0.348 |
| Latitude | 4 | 40.1°–50°N | 0.761 (0.579–1.000) | 0.050 | |
| Aa vs. aa | Ethnicity | 4 | Caucasian Europeans | 1.180 (0.747–1.863) | 0.477 |
| Latitude | 4 | 40.1°–50°N | 1.232 (0.734–2.068) | 0.430 | |
| Allele contrast | Ethnicity | 4 | Caucasian Europeans | 1.802 (0.747–1.863) | 0.477 |
| Latitude | 4 | 40.1°–50°N | 1.073 (0.852–1.352) | 0.550 |
Abbreviations: n, number of studies; OR, odds ratio.
Bold: significant P value (<0.05).
FokI polymorphism
A total of 1989 cases and 1872 controls in seven case–control studies were included in this meta-analysis. The analyses showed that the association between FokI polymorphism and MS was marginal under dominant (P=0.059) (Figure 5) and codominant (P=0.065) models. The sensitivity analysis by removal of one study24 changed the results in dominant and FF vs. ff codominant models. The recalculated ORs were 1.311 (95% CI: 1.032–1.666; P=0.027) and 1.314 (95% CI: 1.019–1.694; P=0.035), respectively. These results indicated that the FF genotype was a significant MS risk factor compared to the Ff and ff genotypes.
Figure 5.

Forest plot of the association between FokI polymorphism and multiple sclerosis risk with the random effects model: FF+Ff vs. ff. Forest plot shows odds ratio and respective 95% confidence intervals for the different studies included in the meta-analysis. For each study in the forest plot, the area of the black square is proportional to study weight and the horizontal bar represents the 95% confidence interval. Z-score: the standardized expression of a value in terms of its relative position in the full distribution of values. CI, confidence interval; MS, multiple sclerosis.
The estimated OR1, OR2 and OR3 were 1.255, 1.087 and 0.983, respectively. These estimates suggested a recessive genetic model. The pooled OR was 1.031 (95% CI: 0.860–1.237; P=0.739). The heterogeneity was low (I2=16.65%). There was no evidence of publication bias detected by the Egger's test (Egger P=0.22) (Table 2). The sensitivity analysis by removal of one study did not change the results in the recessive model.
Discussion
The VDR gene is considered a pleiotropic gene and is associated with multiple autoimmune and allergic diseases. However, the effects of VDR gene polymorphisms on immune function are poorly defined and require further investigation. The polymorphisms may affect the vitamin D structure and function in addition to vitamin D serum levels. The association between VDR polymorphisms and multiple sclerosis has been extensively reviewed, but the results obtained are contradictory. The reasons for this disparity may be small sample sizes, low statistical power, differences in ethnicities, extensive geographic variations, interactions with other genetic or environmental factors and/or clinical heterogeneity. Thus, to overcome the limitations of individual studies, we performed a meta-analysis. The meta-analysis increases statistical power and resolution by pooling the results of independent analyses. In this meta-analysis, we combined data from published studies to evaluate the genetic associations between TaqI, BsmI, ApaI and FokI polymorphisms and MS.
The analyses revealed the ApaI polymorphism was significantly associated with MS in the codominant model. This finding suggests that the homozygote AA genotype was a significant MS risk factor. TaqI and BsmI polymorphisms were not implicated in MS. Our results are consistent with a previous meta-analysis showing that BsmI and TaqI polymorphisms are not associated with MS risk35 and a recent meta-analysis reporting similar data for TaqI and FokI polymorphisms.33 In our study, the sensitivity analysis indicated instability of results and showed a significant association between FokI polymorphism and MS risk in the dominant and codominant models. The FF genotype might be a significant MS risk factor. These results suggest that the VDR gene is significantly involved in MS. Additionally, the genetic background was extensively investigated and was found to be associated with MS susceptibility.43,44,45 Prior to 2007, only the human leukocyte antigen (HLA) region had been associated with MS, particularly the HLA DRB1 genotype.44 There is now significant evidence that the effects of HLA-DR15 on MS onset may be modulated by vitamin D. The large genome-wide45 and genetic46 association studies have provided evidence of the involvement of MS-associated genes and vitamin D. MS is widely accepted as a complex trait that develops in genetically susceptible persons exposed to environmental risk factors.47
The etiology of many common complex diseases is derived from permutations and combinations of common variants. DNA sequence variations such as polymorphisms exert modest biological effects.48,49 ApaI, BsmI and TaqI polymorphisms do not affect the VDR protein structure. Their influence may be related to differences in stability and/or translation efficiency of the RNA. However, the FokI polymorphism has consequences for both VDR protein structure and transcriptional activity. The wild-type short isoform is associated with the increased transcriptional activity.49,50 It has been suggested that VDR polymorphisms may not have any functional effect. One potential exception is the FokI variant that has a differential effect on the immune system.51,52 Our results indicated that the ApaI polymorphism a functional effect on MS. Additionally, the TaqI polymorphism was implicated in MS risk. However, its expression was influenced by environmental factors such as age and publication year. Several other factors not investigated in the current study might influence the TaqI expression. Interestingly, the expression and role of VDR in transactivating target genes are determined by genetics, ethnicity and environment because it involves complex interactions.53 Three environmental risk factors of MS have been identified: past Epstein–Barr virus infection, vitamin D insufficiency and cigarette smoking.54,55 Additionally, sun exposure interacts with functional variants of the VDR gene in childhood to influence MS risk.23
Due to the importance of environmental factors in the etiology of MS risk, we stratified our studies according to study characteristics. Study insufficiency is considered a major limitation when evaluating and comparing all interactions between VDR polymorphisms and study characteristics. We found that the association between the TaqI polymorphism and MS risk was dependent on age and publication year. Additionally, latitude affected the association between ApaI polymorphism and MS risk. Previous studies have suggested that an association of VDR gene polymorphisms with MS might only be evident in a population with a sufficient vitamin D status.21,24,26 It has been assumed that vitamin D is location-dependant in populations and follows latitude gradients.54 The interaction between environmental vitamin D and the disease risk has been explored in other diseases, but findings were inconsistent. VDR polymorphisms were associated with prostate cancer risk only among those with lower serum vitamin D.56,57 Latitude gradients of cancer, autoimmune diseases, coronary heart disease and mental disorders correlate with vitamin D latitude gradients.58,59,60 Martinez61 hypothesized that some relationships between genotype and disease will only be observed in conditions of ‘high' exposure to an environmental factor of interest. Conversely, others may only be observed in conditions of ‘low' exposure. Handel and co-workers62 showed a direct correlation between in vivo vitamin D levels and the number of VDR binding sites at the molecular level. The authors suggested that VDR binding in conditions of vitamin D sufficiency may be more directly related to immune cell function. Genetically predisposed individuals with polymorphisms in genes important for vitamin D metabolism, catabolism or function has an increased likelihood of developing vitamin D deficiency.
There are several limitations in this meta-analysis that should be considered. Based on Egger's test, we detected a small publication bias. The bias might be caused by unpublished data. In our meta-analysis, only studies indexed by the selected databases were included. Negative studies were less likely to be published in journals and were not available in a computerized database. This results in a potential overestimation of effect sizes. In addition, the bias might be caused by smaller size because smaller studies are on average conducted and analyzed with less methodological rigor than larger studies.63 Another source of asymmetry arises from differences in methodological quality.41 We detected moderate heterogeneity, which is caused by several factors such as differences in ethnicities. In our study, ethnicities were Caucasians from Europe, Caucasians from Australia and Asians. Heterogeneity may be caused by study periods, which extended between 1999 and 2013. Geographic characteristics including latitude varied widely (22°S–50°N). The number of available studies was moderate for BsmI polymorphism. Therefore, the results could be influenced by factors such as random error.
The findings from the studies reviewed in this analysis should be interpreted with caution for several reasons. Our results indicate that to provide accurate estimates of the association between VDR polymorphisms and disease susceptibility, many factors such as study characteristics should be considered. Only four polymorphisms in the VDR gene have been studied. However, there are several other functional VDR single nucleotide polymorphisms in the complex promoter region of the VDR gene. The interaction of the VDR gene with HLA genes have been shown to be significant in MS.18,27,29,32 Interestingly, environmental factors may interact with VDR polymorphisms to modify MS risk. The current study could not evaluate all interactions between study characteristics and VDR polymorphisms due to insufficient information from the primary publications.
Conclusions
ApaI and FokI VDR polymorphisms are significantly associated with MS pathogenesis. Additionally, the TaqI polymorphism is functional, but its function depends on specific environmental triggers. The contribution was modest because, as a complex disease, MS involves multiple genetic factors interacting with each other and with the environment. Future studies on gene–gene and gene–environment interactions are needed to assess related risk factors and facilitate early identification of patients at high risk for MS.
Acknowledgments
This study was supported by a grant from the Ministry of Higher Education and Scientific Research.
The authors declare no conflicts of interest related to this manuscript.
References
- 1McFarland HF, Martin R. Multiple sclerosis: a complicated picture of autoimmunity. Nat Immunol 2007; 8: 913–919. [DOI] [PubMed] [Google Scholar]
- 2Hewer S, Lucas R, van der Mei I, Taylor BV. Vitamin D and multiple sclerosis. J Clin Neurosci 2013; 20: 634–641. [DOI] [PubMed] [Google Scholar]
- 3Fukazawa T, Yabe I, Kikuchi S, Sasaki H, Hamada T, Miyasaka K et al. Association of vitamin D receptor gene polymorphism with multiple sclerosis in Japanese. J Neurol Sci 1999; 166: 47–52. [DOI] [PubMed] [Google Scholar]
- 4Nagpal S, Rathnachalam R. Non calcemic actions of vitamin D receptor ligands. Endocr Rev 2005; 26: 662–687. [DOI] [PubMed] [Google Scholar]
- 5Kongsbak M, Levring TB, Geisler C, von Essen MR. The vitamin D receptor and T cell function. Front Immunol 2013; 4: 1–10. [DOI] [PMC free article] [PubMed] [Google Scholar]
- 6Wang TT, Tavera-Mendoza LE, Laperriere D, Libby E, MacLeod NB, Nagai Y et al. Large-scale in silico and microarray-based identification of direct 1,25- dihydroxyvitamin D3 target genes. Mol Endocrinol 2005; 19: 2685–2695. [DOI] [PubMed] [Google Scholar]
- 7Norman AW. A vitamin D nutritional cornucopia: new insights concerning the serum 25-hydroxyvitamin D status of the US population. Am J Clin Nutr 2008; 88: 1455–1456. [DOI] [PubMed] [Google Scholar]
- 8Morrison NA, Yeoman R, Kelly PJ, Eisman JA. Contribution of trans-acting factor alleles to normal physiological variability: vitamin D receptor gene polymorphism and circulating osteocalcin. Proc Natl Acad Sci USA 1992; 89: 6665–6669. [DOI] [PMC free article] [PubMed] [Google Scholar]
- 9Faraco JH, Morrison NA, Baker A, Shine J, Frossard PM. ApaI dimorphism at the human vitamin-D receptor gene locus. Nucleic Acids Res 1989; 17: 2150. [DOI] [PMC free article] [PubMed] [Google Scholar]
- 10Morrison NA, Qi JC, Tokita A, Kelly PJ, Crofts L, Nguyen TV et al. Prediction of bone-density from vitamin-D receptor alleles. Nature 1994; 367: 284–287. [DOI] [PubMed] [Google Scholar]
- 11Gross C, Eccleshall TR, Malloy PJ, Villa ML, Marcus R, Feldman D. The presence of a polymorphism at the translation initiation site of the vitamin D receptor gene is associated with low bone mineral density in postmenopausal Mexican-American women. J Bone Miner Res 1996: 11: 1850–1855. [DOI] [PubMed] [Google Scholar]
- 12Uitterlinden AG, Fang Y, Bergink AP, van Meurs JB, Hans PTM, van Leeuwen et al. The role of vitamin D receptor gene polymorphisms in bone biology. Mol Cell Endocrinol 2002; 197: 15–21. [DOI] [PubMed] [Google Scholar]
- 13Whitfield GK, Remus LS, Jurutka PW, Zitzer H, Oza AK, Dang HT et al. Functionally relevant polymorphisms in the human nuclear vitamin D receptor gene. Mol Cell Endocrinol 2001; 177: 145–159. [DOI] [PubMed] [Google Scholar]
- 14Munger KL, Levin LI, Hollis BW, Howard NS, Ascherio A. Serum 25-hydroxyvitamin D levels and risk of multiple sclerosis. J Am Med Assoc 2006; 296: 2832–2838. [DOI] [PubMed] [Google Scholar]
- 15Shoenfeld N, Amital H, Shoenfeld Y. The effect of melanism and vitamin D synthesis on the incidence of autoimmune disease. Nat Clin Pract Rheumatol 2009; 5: 99–105. [DOI] [PubMed] [Google Scholar]
- 16Ben-Zvi I, Aranow C, Mackay M, Stanevsky A, Kamen DL, Marinescu LM et al. The impact of vitamin D on dendritic cell function in patients with systemic lupus erythematosus. PLoS ONE 2010; 5: e9193. [DOI] [PMC free article] [PubMed] [Google Scholar]
- 17Kriegel MA, Manson JE, Costenbader KH. Does vitamin D affect risk of developing autoimmune disease?: a systematic review. Semin Arthritis Rheu 2011; 40: 512–531. [DOI] [PMC free article] [PubMed] [Google Scholar]
- 18Niino M, Fukazawa T, Yabe I, Kikuchi S, Sasaki H, Tashiro K. Vitamin D receptor gene polymorphism in multiple sclerosis and the association with HLA class II alleles. J Neurol Sci 2000; 177: 65–71. [DOI] [PubMed] [Google Scholar]
- 19Partridge JM, Weatherby SJ, Woolmore JA, Highland DJ, Fryer AA, Mann CL et al. Susceptibility and outcome in MS: associations with polymorphisms in pigmentation-related genes. Neurology 2004; 62: 2323–2325. [DOI] [PubMed] [Google Scholar]
- 20Yeo TW, Maranian M, Singlehurst S, Gray J, Compston A, Sawcer S. Four single nucleotide polymorphisms from the vitamin D receptor gene in UK multiple sclerosis. J Neurol 2004; 251: 753–754. [DOI] [PubMed] [Google Scholar]
- 21Tajouri L, Ovcaric M, Curtain R, Johnson MP, Griffiths LR, Csurhes P et al. Variation in the vitamin D receptor gene is associated with multiple sclerosis in an Australian population. J Neurogenet 2005; 19: 25–38. [DOI] [PubMed] [Google Scholar]
- 22Mamutse G, Woolmore J, Pye E, Partridge J, Boggild M, Young C et al. Vitamin D receptor gene polymorphism is associated with reduced disability in multiple sclerosis. Mult Scler 2008; 14: 1280–1283. [DOI] [PubMed] [Google Scholar]
- 23Dickinson JL, Perera DI, van der Mei AF, Ponsonby AL, Polanowski AM, Thomson RJ, et al. Past environmental sun exposure and risk of multiple sclerosis: a role for the Cdx-2 vitamin D receptor variant in this interaction. Mult Scler 2009; 15: 563–570. [DOI] [PubMed] [Google Scholar]
- 24Simon KC, Munger KL, Yang X, Ascherio A. Polymorphisms in vitamin D metabolism related genes and risk of multiple sclerosis. Mult Scler 2010; 16: 133. [DOI] [PMC free article] [PubMed] [Google Scholar]
- 25Smolders J, Damoiseaux J, Menheere P, Tervaert WJ, Hupperts R. Fok-I vitamin D receptor gene polymorphism (rs10735810) and vitamin D metabolism in multiple sclerosis. J Neuroimmunol 2009; 207: 117–121. [DOI] [PubMed] [Google Scholar]
- 26Smolders J, Peelen E, Thewissen M, Menheere P, Tervaert JW, Hupperts R et al. The relevance of vitamin D receptor gene polymorphisms for vitamin D research in multiple sclerosis. Autoimmunity Rev 2009; 8: 621–626. [DOI] [PubMed] [Google Scholar]
- 27Agliardi C, Guerini FR, Saresella M, Caputo D, Leone MA, Zanzottera M et al. Vitamin D receptor (VDR) gene SNPs influence VDR expression and modulate protection from multiple sclerosis in HLA-DRB1*15-positive individuals. Brain Behav Immun 2011; 25: 1460–1467. [DOI] [PubMed] [Google Scholar]
- 28Sioka C, konstantinou SP, Markoula S, Gkartziou F, Georgiou A, Georgiou I et al. Vitamin D receptor gene polymorphisms in multiple sclerosis patients in northwest Greece. J Negat Results Biomed 2011, 10: 3. [DOI] [PMC free article] [PubMed] [Google Scholar]
- 29Cox MB, Ban M, Bowden NA, Baker A, Scott R J, Lechner-Scott J. Potential association of vitamin D receptor polymorphism TaqI with multiple sclerosis. Mult Scler 2012; 18: 16–22. [DOI] [PubMed] [Google Scholar]
- 30Lambrinoudaki I, Patikas E, Kaparos G, Armeni E, Rizos D, Thoda P et al. Vitamin D receptor BsmI polymorphism, calcium metabolism and bone mineral density in patients with multiple sclerosis: a pilot study. Neurol Sci 2012; 12: 59–57. [DOI] [PubMed] [Google Scholar]
- 31Mirzaei K, Ahmadi S, Hossein-Nezhad A, Mokhtari F. Potential role of OPG/RANKL system and FokI genotypes in pathogenesis and clinical manifestations in multiple sclerosis. Minerva Med 2012; 103: 313–321. [PubMed] [Google Scholar]
- 32Irizar H, Muñoz-Culla M, Zuriarrain O, Goyeneche E, Castillo-Triviño T, Prada A et al. HLA-DRB1*15:01 and multiple sclerosis: a female association? Mult Scler 2012; 18: 569–577. [DOI] [PubMed] [Google Scholar]
- 33Garcia-Martin E, Agundez JA, Martinez C, Benito-Leon J, Millan-Pascual J, Calleja P et al. Vitamin D3 receptor (VDR) gene rs2228570 (Fok1) and rs731236 (Taq1) variants are not associated with the risk for multiple sclerosis: results of a new study and a meta-analysis. PLoS ONE 2013; 8: e65487. [DOI] [PMC free article] [PubMed] [Google Scholar]
- 34Steckley JL, Dyment DA, Sadovnick AD, Risch N, Hayes C, Ebers GC. Genetic analysis of vitamin D related genes in Canadian multiple sclerosis patients. Canadian Collaborative Study Group. Neurology 2000; 54: 729–732. [DOI] [PubMed] [Google Scholar]
- 35Huang J, Xie ZF. Polymorphisms in the vitamin D receptor gene and multiple sclerosis risk: a meta-analysis of case–control studies. J Neurol Sci 2012; 313: 79–85. [DOI] [PubMed] [Google Scholar]
- 36Moher D, Liberati A, Tetzlaff J, Altman DG; The PRISMA Group. Preferred reporting items for systematic reviews and meta-analyses: the PRISMA statement. PLoS Med 2009; 6: e1000097. [DOI] [PMC free article] [PubMed] [Google Scholar]
- 37McDonald WI, Compston A, Edan G, Goodkin D, Hartung HP, Lublin FD et al. Recommended diagnostic criteria for multiple sclerosis: guidelines from the International Panel on the Diagnosis of Multiple Sclerosis. Ann Neurol 2001; 50: 121–127. [DOI] [PubMed] [Google Scholar]
- 38Polman CH, Reingold SC, Edan G, Filippi M, Hartung HP, Kappos L et al. Diagnostic criteria for multiple sclerosis: 2005 revisions to the ‘McDonald Criteria'. Ann Neurol 2005; 58: 840–846. [DOI] [PubMed] [Google Scholar]
- 39Thakkinstian A, McElduff P, D'Este C, Duffy D, Attia J. A method for meta-analysis of molecular association studies. Stat Med 2005; 24: 1291–1306. [DOI] [PubMed] [Google Scholar]
- 40Cochran WG. The combination of estimates from different experiments. Biometrics 1954; 10: 101–129. [Google Scholar]
- 41Egger M, Smith GD, Schneider M, Minder C. Bias in meta-analysis detected by a simple, graphical test. BMJ 1997; 315: 624–634. [DOI] [PMC free article] [PubMed] [Google Scholar]
- 42Garland CF, Gorham ED, Mohr SB, Garland FC. Vitamin D for cancer prevention: global perspective. Ann Epidemiol 2009; 19: 468–483. [DOI] [PubMed] [Google Scholar]
- 43Australia and New Zealand Multiple Sclerosis Genetics Consortium (ANZgene). Genome-wide association study identifies new multiple sclerosis susceptibility loci on chromosomes 12 and 20. Nat Genet 2009; 41: 824–828. [DOI] [PubMed] [Google Scholar]
- 44International Multiple Sclerosis Genetics Consortium, Wellcome Trust Case Control Consortium 2. Sawcer S, Hellenthal G, Pirinen M, Spencer CC et al. Genetic risk and a primary role for cell-mediated immune mechanisms in multiple sclerosis. Nature 2011; 476: 214–219. [DOI] [PMC free article] [PubMed] [Google Scholar]
- 45Maider MC, Irizar H, Otaegui D. The genetics of multiple sclerosis: review of current and emerging candidates. Appl Clin Genet 2013; 6: 63–73. [DOI] [PMC free article] [PubMed] [Google Scholar]
- 46Peltonen L. Old suspects found guilty—the first genome profile of multiple sclerosis. N Engl J Med 2007; 357: 927–929. [DOI] [PubMed] [Google Scholar]
- 47Sundqvist E, Baarnhielm M, Alfredsson L, Hillert J, Olsson T, Kockum I. Confirmation of association between multiple sclerosis and CYP27B1. Eur J Hum Genet 2010; 18: 1349–1352. [DOI] [PMC free article] [PubMed] [Google Scholar]
- 48Luonng KV, Nguyen LT. The role of vitamin D in asthma. Pulm Pharmacol Ther 2012; 25: 137–143. [DOI] [PubMed] [Google Scholar]
- 49Uitterlinden AG, Fang Y, van Meurs JB, Pols HA, van Leeuwen JP. Genetics and biology of vitamin D receptor polymorphisms. Gene 2004; 338: 143–156. [DOI] [PubMed] [Google Scholar]
- 50Jurutka PW, Remus LS, Whitfield GK, Thompson PD, Hsieh JC, Zitzer H et al. The polymorphic N terminus in human vitamin D receptor isoforms influences transcriptional activity by modulating interaction with transcription factor IIB. Mol Endocrinol 2000; 14: 401–420. [DOI] [PubMed] [Google Scholar]
- 51van Etten E, Verlinden L, Giulietti A, Ramos-Lopez E, Branisteanu DD, Ferreira GB et al. The vitamin D receptor gene FokI polymorphism: functional impact on the immune system. Eur J Immunol 2007; 37: 395–405. [DOI] [PubMed] [Google Scholar]
- 52O'Neill V, Asani FF, Jeffery TJ, Saccone DS, Bornman L. Vitamin D receptor gene expression and function in a South African population: ethnicity, vitamin D and FokI. PLoS ONE 2013; 8: e67663. [DOI] [PMC free article] [PubMed] [Google Scholar]
- 53O'Gorman C, Lucas R, Taylor B. Environmental risk factors for multiple sclerosis: a review with a focus on molecular mechanisms. Int J Mol Sci 2012; 1: 11718–11752. [DOI] [PMC free article] [PubMed] [Google Scholar]
- 54Pierrot-Deseilligny C, Souberbielle JC. Contribution of vitamin D insufficiency to the pathogenesis of multiple sclerosis. Adv Neurol Disord 2013; 6: 81–116. [DOI] [PMC free article] [PubMed] [Google Scholar]
- 55Kimlin MG, Olds WJ, Moore MR. Location and vitamin D synthesis: is the hypothesis validated by geophysical data? J Photochemist Photobiol B 2007; 86: 234–239. [DOI] [PubMed] [Google Scholar]
- 56Ahn J, Albanes D, Berndt SI, Peters U, Chatterjee N, Freedman ND et al. Vitamin D-related genes, serum vitamin D concentrations and prostate cancer risk. Carcinogenesis 2009; 30: 769–776. [DOI] [PMC free article] [PubMed] [Google Scholar]
- 57Li H, Stampfer MJ, Hollis JB, Mucci LA, Gaziano JM, Hunter D et al. A prospective study of plasma vitamin D metabolites, vitamin D receptor polymorphisms, and prostate cancer. PLoS Med 2007; 4: e103. [DOI] [PMC free article] [PubMed] [Google Scholar]
- 58Holick MF. Vitamin D: the underappreciated D-lightful hormone that is important for skeletal and cellular health. Curr Opin Endocrinol Diabetes 2002; 9: 87–98. [Google Scholar]
- 59Grant WB. Epidemiology of disease risks in relation to vitamin D insufficiency. Prog Biophys Mol Biol 2006; 92: 65–79. [DOI] [PubMed] [Google Scholar]
- 60Kimlin MG. Geographic location and vitamin D synthesis. Mol Aspects Med 2008; 29: 453–461. [DOI] [PubMed] [Google Scholar]
- 61Martinez FD. Gene–environment interaction in complex diseases: asthma as an illustrative case. In: Rutter M (ed.) Genetic Effects on Environmental Vulnerability to Disease: Novartis Foundation Symposium 293. Chichester: John Wiley & Sons, 2008. [DOI] [PubMed] [Google Scholar]
- 62Handel AE, Sandve GK, Disanto G, Berlanga-Taylor AJ, Gallone G, Hanwell H et al. Vitamin D receptor ChIP-seq in primary CD4+ cells: relationship to serum 25-hydroxyvitamin D levels and autoimmune disease. BMC Med 2013; 11: 163. [DOI] [PMC free article] [PubMed] [Google Scholar]
- 63Little J, Higgins JP, Ioannidis JP, Moher D, Gagnon F, von Elm E et al. Strengthening the reporting of genetic association studies (STREGA)—an extension of the STROBE Statement. Hum Genet 2009; 125: 131–151. [DOI] [PubMed] [Google Scholar]