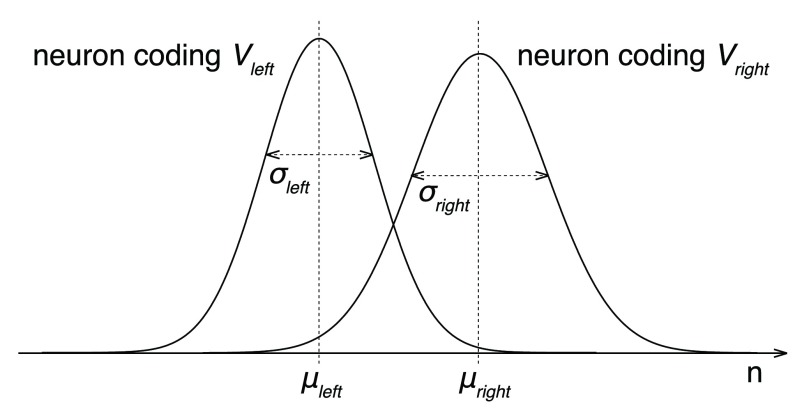
Figure 11. Representation of option values by spiking neurons.
The plots show the distributions of spike counts n for a neuron encoding V right and a neuron encoding V left. The spike counts follow a Poisson distribution. In the Poisson distribution, σ 2 = μ, so the right distribution with the higher σ also has a higher α. For large enough n, the distribution approaches a Gaussian. For simplicity, the illustrated distributions are Gaussian.

