

Abstract
Background
Patients with heart failure and preserved ejection fraction (HFpEF) have a poor prognosis, and no therapies have been proven to improve outcomes. It has been proposed that heart failure, including HFpEF, represents overlapping syndromes that may have different prognoses. We present an exploratory study of patients enrolled in the Irbesartan in Heart Failure with Preserved Ejection Fraction Study (I-PRESERVE) using latent class analysis (LCA) with validation using the Candesartan in Heart failure: Assessment of Reduction in Mortality and morbidity (CHARM)-Preserved study to identify HFpEF subgroups.
Methods and results
In total, 4113 HFpEF patients randomized to irbesartan or placebo were characterized according to 11 clinical features. HFpEF subgroups were identified using LCA. Event-free survival and effect of irbesartan on the composite of all-cause mortality and cardiovascular hospitalization were determined for each subgroup. Subgroup definitions were applied to 3203 patients enrolled in CHARM-Preserved to validate observations regarding prognosis and treatment response. Six subgroups were identified with significant differences in event-free survival (p<0.001). Clinical profiles and prognoses of the 6 subgroups were similar in CHARM-Preserved. The two subgroups with the worst event-free survival in both studies were characterized by a high prevalence of obesity, hyperlipidemia, diabetes mellitus, anemia, and renal insufficiency (Subgroup C) and by female predominance, advanced age, lower body mass index, and high rates of atrial fibrillation, valvular disease, renal insufficiency, and anemia (Subgroup F).
Conclusion
Using a data-driven approach, we identified HFpEF subgroups with significantly different prognoses. Further development of this approach for characterizing HFpEF subgroups is warranted.
Keywords: heart failure with preserved ejection fraction, latent class analysis, outcomes, phenotyping, angiotensin receptor blocker, irbesartan, candesartan
Introduction
Approximately half of heart failure patients have a preserved left ventricular ejection fraction (HFpEF). HFpEF patients have a poor prognosis and are more likely to be older, female, hypertensive, anemic, and to have atrial fibrillation (AF) than heart failure patients with reduced ejection fraction (HFrEF).1 Despite multiple clinical trials, no therapy has been found to improve HFpEF outcomes. The largest HFpEF trial was the Irbesartan in Heart Failure with Preserved Ejection Fraction Study (I-PRESERVE) in which irbesartan therapy failed to affect the composite of death or hospitalization for a cardiovascular cause.2 Similarly, the Candesartan in Heart failure: Assessment of Reduction in Mortality and morbidity (CHARM)-Preserved study showed no reduction in the composite of cardiovascular death or HF hospitalization associated with candesartan therapy.3 Subsequent I-PRESERVE analyses have identified predictors of adverse outcomes including age, body mass index (BMI), NT-proBNP, diabetes mellitus (DM), coronary artery disease (CAD), and renal insufficiency, but only low NT-proBNP has been associated with response to irbesartan.4–6
It has been suggested that both HFrEF and HFpEF patients are comprised of overlapping subgroups with respect to etiology, prognosis and likelihood of treatment response; that characteristics of some HFpEF subgroups may be different than HFrEF; and that some subgroups may be more likely to respond to specific therapies.7 Although HFpEF patients generally more comorbidities than HFrEF,8 HFpEF may not be simply the sum of comorbidities. Instead multisystem processes may act synergistically to cause clinical HFpEF. One hypothesis proposes that in some patients, HFpEF-associated comorbidities produce inflammation that affects endothelial function thereby contributing to progression of HFpEF.9,10 Furthermore, patients with DM and HFpEF may have increased inflammation, vasoconstriction and worse outcomes including functional capacity.11 HFpEF trials with vasoprotective agents (renin-angiotensin system blockade),2,3,12 and anti-inflammatory agents (statins)13 have been negative suggesting that optimal therapeutic targets have not been identified or optimal targets may be different in different HFpEF subgroups.
Latent class analysis (LCA) identifies groups of individuals with similar clinical profiles and has been used for identification, characterization, and validation of disease subtypes in several domains including HF.14,15 Unlike many clustering methods that require continuous variables, LCA is optimized for analysis of categorical variables that are frequently encountered in clinical practice such as gender and presence of comorbidities. LCA assumes the existence of subgroups or ‘latent classes’ within a population that explain patterns of association between clinical features and identifies subgroups according to prevalent patterns of those features. When a population has a shared disease like HFpEF, latent classes may represent disease subgroups identifiable by combinations of several traits rather than a single trait. LCA has been used to develop diagnostic criteria for complex diseases and to identify subgroups of diseases including HFrEF for risk stratification and determining likelihood of treatment response.15–17
In this retrospective, exploratory analysis, LCA was applied to clinical profiles of patients enrolled in I-PRESERVE to identify prevalent HFpEF subgroups and differences in outcomes. We hypothesized HFpEF subgroups identified using LCA would vary in prognosis and response to irbesartan. We performed a limited validation of these observations by applying the same subgroup definitions to HFpEF patients enrolled in CHARM-Preserved. We propose that these subgroups provide a starting point for in-depth characterization of HFpEF patients using LCA, most notably with the addition of cardiac structure, hemodynamics, and biomarkers.
Methods
I-PRESERVE trial design
The design of I-PRESERVE has been described previously.2 The study was conducted according to the Declaration of Helsinki and approved by ethics committees at each center. All patients provided written informed consent. I-PRESERVE enrolled HFpEF (EF>45%) patients ≥60 years old with NYHA class II–IV symptoms and HF hospitalization within the previous 6 months or NYHA class III–IV symptoms and pulmonary congestion by radiograph, left ventricular hypertrophy, left bundle branch block, or left atrial enlargement. Patients were double-blind randomized to irbesartan or placebo. The primary outcome was all-cause mortality or hospitalization for a cardiovascular reason. The secondary outcome was HF hospitalization or death due to either HF or sudden death. Mean follow-up was 49.5 months with an annual mortality of 5.2%, and irbesartan had no effect on the primary endpoint (p=0.35). In total, 4113 randomized patients had sufficient historical data to be included in LCA.
Subgroup identification
Patients were characterized according to 11 prospectively selected clinical features: age, gender, BMI, AF, CAD, DM, hyperlipidemia, valvular disease, alcohol use, estimated glomerular filtration rate (eGFR), and hematocrit.8,18 Age, gender, BMI, AF, CAD, DM, anemia, and eGFR have been studied previously for predicting outcomes and treatment response to irbesartan in I-PRESERVE.2,4–6 Alcohol use was chosen due to the role of angiotensin II receptor 1 in alcoholic cardiomyopathy.19 Valvular disease is an independent risk factor for HFpEF20 and has possible implications for response to renin-angiotensin system blockade.21 BMI was categorized according to World Health Organization Classifications of underweight, normal weight, overweight, and obese. eGFR was estimated using the Chronic Kidney Disease Epidemiology Collaboration equation, and eGFR was categorized using standard definitions for chronic kidney disease stages 1–5.22,23 Patients were classified as having CAD if they had a history of myocardial infarction, angina, or coronary revascularization. Hypertension (88–89%) and race (93–94% white) were excluded from LCA because their homogeneity suggested they were unlikely to discriminate subpopulations of patients. NT-proBNP was excluded because it has been identified as a marker of progression of HFpEF and hemodynamic status rather than a comorbid condition. A separate LCA combining NT-proBNP with cardiac function, hemodynamics, and markers of congestion will be reported separately. All interpretation criteria were encoded and applied to primary data using MySQL Server (version 5.5.24, Oracle Corporation, Redwood Shores, CA).
LCA was performed using the poLCA library in the R statistical package (version 2.15.0, R Foundation for Statistical Computing, Vienna, Austria).24 Latent class definitions were derived using maximum-likelihood estimation to identify the most common patterns of the 11 variables for a range of 2–10 subgroups. The optimal number of subgroups for I-PRESERVE was determined using the first minima of the Bayesian Information Criterion (BIC) and χ2 statistic. Probabilities of membership in each subgroup for every LCA variable were used to determine the most likely subgroup for each patient. Derivation of the latent class model and Bayesian determination of an individual patient’s subgroup is detailed in the Appendix. In this exploratory study we report the results of the primary 11 variables only. Future work will explore strategies for iterative selection of variables to optimize LCA subgroups.
Association between HFpEF subgroup and outcomes
Outcomes were analyzed according to the intention-to-treat principle using Kaplan-Meier estimates and Cox proportional-hazards models to calculate hazard ratios (HR), confidence intervals (CI), and p-values using the stcox function in Stata (StataCorp, College Station, TX). Subgroup was treated as a categorical covariate, and interactions between irbesartan and outcomes were evaluated in each subgroup. Cox regression was repeated with respect to the primary outcome for all categorical LCA components with irbesartan as an interaction term using the Bonferroni correction (11 tests) to identify individual predictors of prognosis and response to irbesartan. Step-forward multivariate analysis was performed using a corrected p-value threshold <0.05. Comprehensive multivariate analysis was repeated using all 11 LCA component variables with the addition of SBP, LVEF, NT-proBNP, and probability of membership in each of the subgroups for each patient as continuous covariates. The likelihood ratio test (LR) and Gonen and Heller’s K statistic of concordance were used to determine whether probability of subgroup membership added prognostic information to the multivariate models. The K statistic was used because it is not sensitive to the degree and patterning of censoring. P-values from the LR tests and K statistics were averaged over 20 multiply-imputed data sets25 because a complete case analysis would have excluded 18% of patients in I-PRESERVE.
External validation (CHARM-Preserved)
The design of CHARM-Preserved has been described elsewhere.3 CHARM-Preserved was conducted according to the Declaration of Helsinki, approved by ethics committees at each center, and all patients provided written informed consent. CHARM-Preserved double-blind randomized adults with an EF >40%, NYHA class II–IV symptoms for ≥4 weeks and a history of HF hospitalization to candesartan or placebo. The primary endpoint was a composite of cardiovascular death or HF hospitalization. Mean follow-up was 36.6 months and candesartan had no effect on the primary endpoint (p=0.12). For validation, I-PRESERVE primary and secondary outcomes for all subjects were derived from primary CHARM-Preserved data.
HFpEF subgroup definitions derived from I-PRESERVE were applied to all 3203 CHARM-Preserved patients (Appendix). Only 1986 (62.0%) of CHARM-Preserved subjects had hematocrit and serum creatinine levels checked. Laboratory values were not imputed for LCA subgroup classification because of the variability in these lab values between subgroups in I-PRESERVE and because LCA makes no assumptions about distributions of missing data. NT-proBNP was not measured systematically in CHARM-Preserved. Associations between subgroup, outcome, and interaction with treatment group were analyzed using Kaplan-Meier estimates and Cox proportional hazards models as in I-PRESERVE. Multivariate analyses, LR test, and K statistics were repeated using 20 multiply-imputed data sets, because 67% of patients in CHARM-Preserved were missing at least one value.
Results
The optimal number of HFpEF LCA subgroups in I-PRESERVE was 6. Distributions of the 11 LCA variables and distributions of baseline LVEF, SBP, and NT-proBNP according to subgroup in I-PRESERVE and CHARM-Preserved are summarized in Table 1a and 1b, respectively. Coefficients required to calculate the most likely subgroup for HFpEF patients are found in Appendix Table C.
Table 1a.
Distributions of latent class analysis variables according to HFpEF subgroup, I-PRESERVE, N (%)
| Variables | Subgroup | ||||||
|---|---|---|---|---|---|---|---|
| A | B | C | D | E | F | All | |
|
| |||||||
| 601 (15) | 701 (17) | 322 (8) | 1248 (30) | 760 (18) | 481 (12) | 4113 | |
| Age, years | |||||||
| 60–70 | 562 (94) | 645 (92) | 143 (44) | 278 (22) | 89 (12) | 21 (4) | 1738 (42) |
| 70–80 | 0 (0) | 22 (3) | 152 (47) | 918 (74) | 583 (77) | 95 (20) | 1770 (43) |
| > 80 | 0 (0) | 0 (0) | 7 (2) | 20 (2) | 71 (9) | 362 (75) | 460 (11) |
| Female | 0 (0) | 673 (96) | 190 (59) | 1248 (100) | 0 (0) | 373 (78) | 2484 (60) |
| Body mass index, kg/m2 | |||||||
| < 18.5 | 4 (1) | 0 (0) | 0 (0) | 0 (0) | 0 (0) | 18 (4) | 22 (1) |
| 18.5–25 | 65 (11) | 79 (11) | 10 (3) | 178 (14) | 157 (21) | 185 (38) | 674 (16) |
| 25–30 | 272 (45) | 318 (45) | 70 (22) | 492 (39) | 422 (56) | 160 (33) | 1734 (42) |
| > 30 | 260 (43) | 304 (43) | 241 (75) | 576 (46) | 178 (23) | 116 (24) | 1675 (41) |
| Atrial fibrillation | 106 (18) | 35 (5) | 106 (33) | 397 (32) | 334 (44) | 246 (51) | 1224 (30) |
| Coronary artery disease | 340 (57) | 365 (52) | 213 (66) | 533 (43) | 468 (62) | 216 (45) | 2135 (52) |
| Diabetes mellitus | 161 (27) | 164 (23) | 321 (100) | 281 (23) | 132 (17) | 73 (15) | 1132 (28) |
| Hyperlipidemia | 284 (47) | 296 (42) | 271 (84) | 533 (43) | 280 (37) | 138 (29) | 1802 (44) |
| Valvular disease | 15 (2) | 10 (1) | 66 (20. | 124 (10) | 92 (12) | 135 (28) | 442 (11) |
| Alcohol use | 122 (20) | 15 (2) | 44 (14) | 65 (5) | 151 (20) | 48 (10) | 445 (11) |
| Est. GFR, ml/min/1.73 m2 | |||||||
| > 90 | 187 (31) | 332 (47) | 40 (12) | 14 (1) | 13 (2) | 5 (1) | 591 (14) |
| 60–90 | 342 (57) | 340 (49) | 71 (22) | 765 (61) | 441 (58) | 90 (19) | 2049 (50) |
| 30–60 | 63 (10) | 21 (3) | 170 (53) | 445 (36) | 296 (39) | 320 (67) | 1315 (32) |
| < 30 | 2 (0) | 0 (0) | 33 (10) | 0 (0) | 0 (0) | 61 (13) | 9c6 (2) |
| Hematocrit, % | |||||||
| > 50 | 61 (10) | 3 (0) | 5 (2) | 33 (3) | 44 (6) | 7 (1) | 153 (4) |
| 40–50 | 522 (87) | 388 (55) | 78 (24) | 823 (66) | 545 (72) | 173 (36) | 2529 (61) |
| 30–40 | 0 (0) | 296 (42) | 226 (70) | 356 (29) | 149 (20) | 279 (58) | 1306 (32) |
| <30 | 0 (0) | 0 (0) | 2 (1) | 1 (0) | 1 (0) | 7 (1) | 11 (0) |
|
| |||||||
| Other variables, median [IQR] | |||||||
| LV ejection fraction, % | 56 [51–62] | 60 [55–67] | 60 [54–65] | 60 [54–66] | 55 [50–63] | 59 [52–65] | 59 [52–65] |
| SBP, mm Hg | 140 [130–145] | 140 [130–145] | 136 [125–147] | 140 [130–147] | 135 [125–145] | 136 [125–147] | 138 [128–145] |
| NT-proBNP, pg/ml | 215 [85–572] | 143 [73–310] | 448 [181–1149] | 321 [144–908] | 556 [237–1238] | 950 [361–1916] | 339 [134–964] |
Est. GFR = Estimated glomerular filtration rate; SBP = systolic blood pressure
Table 1b.
Distributions of latent class analysis variables according to HFpEF subgroup, CHARM-Preserved
| Latent class variable | Subgroup | ||||||
|---|---|---|---|---|---|---|---|
| A | B | C | D | E | F | All | |
|
| |||||||
| 677 (22) | 259 (9) | 288 (10) | 604 (20) | 862 (29) | 333 (11) | 3023 | |
| Age, years* | |||||||
| < 60 | 228 (34) | 48 (19) | 81 (28) | 170 (28) | 303 (35) | 25 (8) | 855 (28) |
| 60–70 | 449 (66) | 211 (81) | 109 (38) | 82 (13) | 65 (8) | 13 (4) | 929 (31) |
| 70–80 | 0 (0) | 0 (0.0) | 95 (33) | 349 (58) | 467 (54) | 64 (19) | 975 (32) |
| >80 | 0 (0) | 0 (0.0) | 3 (1) | 3 (0) | 27 (3) | 231 (69) | 264 (9) |
| Female* | 0 (0) | 244 (94) | 127 (44) | 604 (100) | 0 (0) | 237 (71) | 1212 (40) |
| BMI*, kg/m2 | |||||||
| < 18.5 | 2 (0) | 0 (0) | 0 (0) | 0 (0) | 0 (0) | 21 (6) | 23 (1) |
| 18.5–25 | 100 (15) | 51 (20) | 12 (4) | 122 (20) | 233 (27) | 163 (49) | 681 (23) |
| 25–30 | 258 (38) | 74 (29) | 59 (21) | 228 (38) | 465 (54) | 94 (23) | 1178 (39) |
| > 30 | 315 (47) | 133 (51) | 217 (75) | 252 (42) | 158 (18) | 53 (16) | 1128 (37) |
| NA | 2 (0) | 1 (0) | 0 (0) | 2 (0) | 6 (1) | 2 (1) | 13 (0) |
| Atrial fibrillation* | 57 (8) | 1 (0) | 31 (11) | 121 (20) | 163 (19) | 105 (32) | 478 (16) |
| Coronary artery disease† | 495 (73) | 171 (66) | 244 (85) | 352 (58) | 661 (77) | 180 (54) | 2103 (66) |
| Diabetes mellitus | 188 (28) | 71 (27) | 287 (100) | 136 (23) | 129 (15) | 46 (14) | 857 (28) |
| Hyperlipidemia | 330 (49) | 113 (44) | 229 (80) | 186 (31) | 352 (41) | 52 (16) | 1262 (39) |
| Valvular disease* | 38 (6) | 14 (5) | 88 (31) | 141 (23) | 180 (21) | 146 (44) | 607 (20) |
| Alcohol use* | 47 (7) | 0 (0) | 13 (5) | 2 (0) | 42 (5) | 9 (3) | 113 (4) |
| Est. GFR*, ml/min/1.73 m2 | |||||||
| > 90 | 103 (15) | 80 (31) | 18 (6) | 6 (1) | 4 (0) | 1 (0) | 212 (7) |
| 60–90 | 77 (11) | 25 (10) | 40 (14) | 130 (22) | 133 (15) | 16 (5) | 381 (13) |
| 30–60 | 12 (2) | 6 (2) | 100 (35) | 62 (10) | 94 (11) | 78 (23) | 352 (12) |
| 15–30 | 0 (0.0) | 0 (0) | 23 (8) | 0 (0) | 0 (0) | 29 (9) | 52 (2) |
| NA | 485 (77) | 148 (57) | 107 (37) | 406 (67) | 631 (73) | 209 (63) | 1986 (66) |
| Hematocrit*, % | |||||||
| > 50 | 14 (2) | 0 (0) | 0 (0) | 1 (0) | 10 (1) | 0 (0) | 25 (1) |
| 40–50 | 183 (27) | 49 (19) | 38 (13) | 89 (15) | 154 (18) | 33 (10) | 546 (18) |
| 30–40 | 0 (0) | 65 (25) | 145 (50) | 104 (17) | 81 (9) | 81 (24) | 476 (16) |
| < 30 | 0 (0) | 0 (0) | 9 (3) | 0 (0) | 0 (0) | 12 (4) | 21 (1) |
| NA | 480 (71) | 145 (56) | 96 (33) | 410 (68) | 617 (72) | 207 (62) | 1955 (65) |
|
| |||||||
| Other variables, median [IQR] | |||||||
| LV ejection fraction, % | 50 [45–59] | 56 [50–63] | 54 [47–60] | 55 [48–60] | 50 [45–58] | 56 50–63] | 52 [46–60] |
| SBP, mm Hg | 134 [120–149] | 138 [126–150] | 138 [122–140] | 140 [125–150] | 134 [120–148] | 137 [122–150] | 136 [120–150] |
Lower in all CHARM-Preserved patients vs. all I-PRESERVE patients, p<0.001
Higher in all CHARM-Preserved patients vs. all I-PRESERVE patients, p<0.001
Subgroup characteristics
Subgroup A (median age 65 years) was 100% men and Subgroup B (median 65 years) was 96% women. Subgroups A and B had low rates of AF, renal dysfunction, and valvular disease, although Subgroup A had more alcohol use and Subgroup B had more anemia. Subgroup C (median 70 years) had high rates of obesity, DM, hyperlipidemia, CAD, and anemia with worse renal function than other subgroups. Subgroup D (median 73 years) was 100% women with average rates of DM, hyperlipidemia, and obesity and renal insufficiency. Subgroup E (median 75 years) was 100% men with lower BMI, excess AF, and CAD. Subgroup F was predominantly women (77.5%) of advanced age (median 82 years) with lower BMI and high rates of AF, valvular disease, renal dysfunction, and anemia. Median baseline LVEF and SBP were similar between all subgroups, although median baseline NT-proBNP ranged from 143 (Subgroup B) to 950 pg/mL (Subgroup F).
Relative subgroup profiles were similar between I-PRESERVE and CHARM-Preserved, but the distribution of HFpEF subgroups was different due to differences in overall patient characteristics between the two trials. CHARM-Preserved included younger patients (28.3% < age 60, vs. 100% > age 60), fewer women (40.1% vs. 60.4%, p<0.001), and more CAD (65.7%vs. 43.8%, p<0.001). AF (15.8% vs. 29.8%, p<0.001) and alcohol use (3.7 vs. 10.8%, p<0.001) were reported less frequently in CHARM-Preserved, whereas valvular disease was reported more frequently (20.1% vs.10.7%, p<0.001). The rate of missing laboratory values was different between subgroups in CHARM-Preserved, ranging from ~35% (Subgroup C) to ~75% (Subgroup A). Where available BMI, eGFR, and hematocrit were all significantly lower in CHARM-Preserved than I-PRESERVE (p<0.001 for all).
Outcomes
The primary and secondary outcomes occurred in 1501 (36.5%) and 871 (21.2%) of I-PRESERVE subjects and in in 1220 (40.4%) and 525 (17.4%) CHARM-Preserved patients, respectively. There were significant differences in outcomes between subgroups in both trials (Figures 1 and 2). Probability of the primary and secondary outcomes for each study at 3 years according to treatment group are shown in Tables 2a and 2b. Subgroups C and F had the highest rate of both outcomes in both studies whereas Subgroup B had the lowest. Irbesartan was not associated with a reduction in either outcome overall, but irbesartan was associated with a nominally significant reduction in the primary outcome in Subgroup C (HR 0.72, 95% CI 0.53–0.99, p=0.046). No treatment effects were observed with respect to the secondary outcome in any subgroup, although there were 50% fewer events compared to the primary outcome. There were no significant differences in the outcomes between candesartan and placebo arms in any subgroup in CHARM-Prserved.
Figure 1.
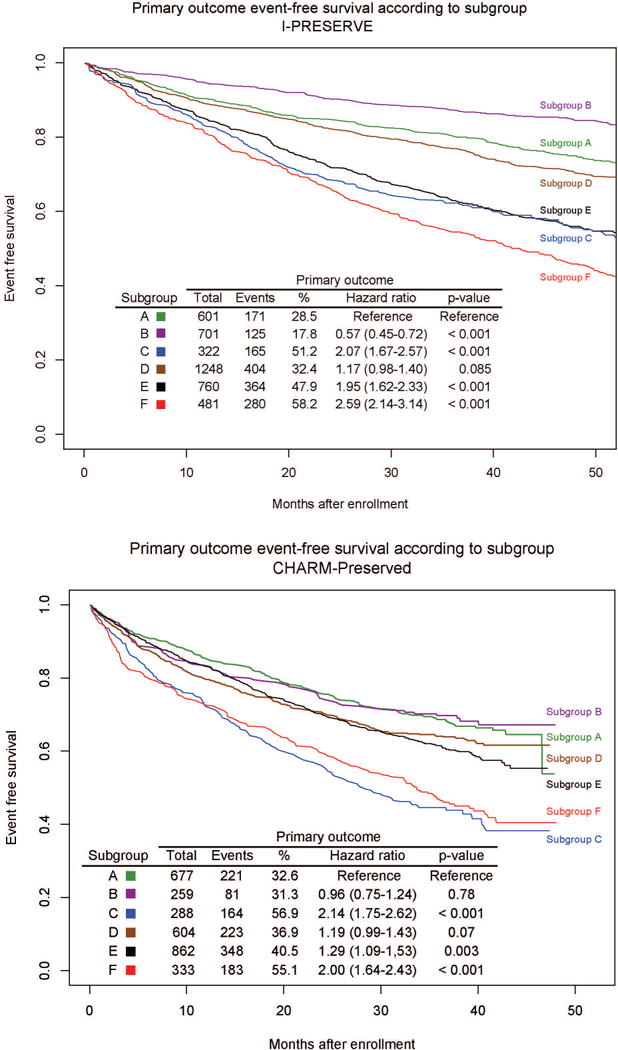
Figure 2.
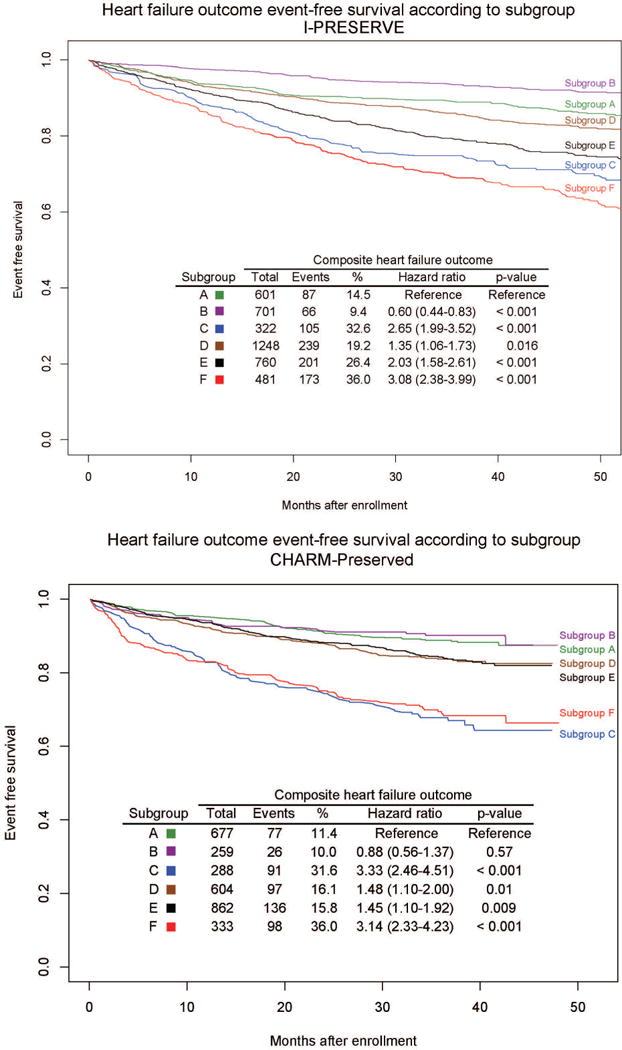
Table 2a.
Probability of primary and secondary outcomes at 3 years according to subgroup in I-PRESERVE, irbesartan vs. placebo, % (95% CI)
| Subgroup | Placebo
|
Irbesartan
|
||||
|---|---|---|---|---|---|---|
| Total | Primary, % | Secondary, % | Total | All events, % | HF events, % | |
| A | 310 | 20 (16–25) | 7 (4–10) | 291 | 20 (16–25) | 9 (6–13) |
| B | 348 | 13 (10–17) | 5 (3–8) | 353 | 12 (9–16) | 5 (4–8) |
| C* | 163 | 44 (37–52) | 26 (20–34) | 159 | 32 (25–39) | 13 (10–16) |
| D | 626 | 22 (19–25) | 13 (10–16) | 622 | 24 (21–28) | 23 (17–30) |
| E | 350 | 40 (35–45) | 20 (16–24) | 410 | 35 (31–40) | 15 (12–19) |
| F | 257 | 49 (43–56) | 30 (24–36) | 224 | 41 (35–48) | 26 (21–33) |
Irbesartan interaction hazard ratio 0.72 (0.53–0.99), p=0.046
Table 2b.
Probability of primary outcome and secondary outcomes at 3 years according to subgroup in CHARM-Preserved, candesartan vs. placebo, % (95% CI)
| Subgroup | Placebo
|
Candesartan
|
||||
|---|---|---|---|---|---|---|
| Total | Primary, % | Secondary, % | Total | Primary, % | Secondary, % | |
| A | 329 | 32 (27–37) | 12 (9–16) | 348 | 31 (26–36) | 11 (8–14) |
| B | 125 | 33 (26–42) | 10 (6–17) | 134 | 28 (21–36) | 10 (6–16) |
| C | 144 | 56 (48–64) | 36 (28–44) | 144 | 55 (47–64) | 29 (22–38) |
| D | 317 | 39 (34–45) | 19 (15–24) | 287 | 33 (28–39) | 13 (10–18) |
| E | 415 | 41 (36–46) | 17 (14–21) | 444 | 38 (34–43) | 15 (12–19) |
| F | 175 | 54 (47–62) | 35 (28–43) | 157 | 53 (46–62) | 28 (22–37) |
Multivariate analysis
Of the 11 LCA categorical variables, 7 (age, gender, AF, CAD, DM, hyperlipidemia, eGFR) were significantly associated with the primary outcome in multivariate analysis corrected for multiple comparisons. No component variables were associated with a treatment effect. Subgroup remained significantly associated with the primary outcome when added to categorical multivariate predictors (LR p=0.001), and differences in HRs between subgroups were attenuated but similar to those when considering subgroup alone. When added to the full multivariate model including all 11 component variables plus NT-proBNP, SBP, and LVEF (Table 3a), probability of membership in each subgroup remained significantly associated with the primary outcome (LR p<0.001), and the K statistic increased (0.660 to 0.670). HRs for multivariate predictors of the primary outcome in I-PRESERVE were similar in CHARM-Preserved, and all were significant with the exception of CAD (p=0.22). Subgroup remained significantly associated with the primary outcome when added to categorical multivariate predictors (excluding eGFR) in all CHARM-Preserved patients (LR p=0.002), although it was not significant when restricted to only patients ≥ age 60 (N=2166, LR p=0.12). When combined with the full multivariate model in all CHARM-Preserved patients including SBP and LVEF (Table 3b), subgroup was no longer significantly associated with the primary outcome (LR p=0.31). As expected, the K (0.628) statistics for the full multivariate model were also lower in CHARM-Preserved than in I-PRESERVE, and the addition of subgroup had a slight effect K statistics (0.629). When restricted to patients age ≥60 (Table 3c), the LR for adding subgroup to the full multivariate model was 0.27 and the K statistic improved from 0.620 to 0.622, although probability of Subgroup C membership remained a significant predictor of the primary outcome (p=0.03).
Table 3a.
Hazard ratios associated with subgroup + full multivariate model and primary outcome, I-PRESERVE, continuous variables
| Predictor | Hazard Ratio (95% CI) | p-value |
|---|---|---|
| Age, year | 1.04 (1.03–1.05) | <0.001 |
| Female | 0.71 (0.64–0.80) | <0.001 |
| Atrial fibrillation | 1.55 (1.38–1.74) | < 0.001 |
| Coronary artery disease | 1.30 (1.17–1.46) | < 0.001 |
| Diabetes mellitus | 1.64 (1.44–1.90) | < 0.001 |
| Hyperlipidemia | 0.78 (0.69–0.87) | < 0.001 |
| Valvular disease | 1.20 (1.03–1.39) | 0.016 |
| Alcohol use | 0.83 (0.70–0.99) | 0.036 |
| Body mass index, kg/m2 | 1.01 (1.00–1.02) | 0.055 |
| eGFR, ml/min/1.73 m2 | 0.992 (0.989–0.995) | <0.001 |
| Hematocrit, % | 0.99 (0.98–1.00) | 0.12 |
| SBP, mm Hg | 1.000 (0.996–1.003) | 0.93 |
| LV ejection fraction | 0.98 (0.98–0.99) | <0.001 |
| NT-proBNP, 100 pg/mL | 1.008 (1.007–1.010) | <0.001 |
|
| ||
| Subgroup*,† | ||
| A | 0.64 (0.40–1.02) | 0.063 |
| B | 0.31 (0.20–0.50) | <0.001 |
| C | 0.83 (0.54–1.27)) | 0.39 |
| D | 0.55 (0.41–0.75) | <0.001 |
| E | 0.80 (0.57–1.13) | 0.20 |
Hazard ratios correspond to probability of membership in given subgroup=1 compared to 0. Subgroup F is not listed because sum of probabilities for all subgroups=1.
Likelihood ratio test p<0.001, K statistic increased from 0.66 to 0.67 when subgroup added to full multivariate model.
Table 3b.
Hazard ratios associated with subgroup + full multivariate model and primary outcome, CHARM-Preserved, continuous variables, all ages
| Predictor | Hazard Ratio (95% CI) | p-value |
|---|---|---|
| Age, year | 1.02 (1.01–1.03) | <0.001 |
| Female | 0.92 (0.69–1.22) | 0.54 |
| Atrial fibrillation | 1.28 (1.09–1.50) | 0.003 |
| Coronary artery disease | 1.11 (0.97–1.28) | 0.14 |
| Diabetes mellitus | 1.42 (1.19–1.70) | <0.001 |
| Hyperlipidemia | 0.82 (0.71–0.93) | 0.003 |
| Valvular disease | 1.15 (1.00–1.34) | 0.054 |
| Alcohol use | 0.89 (0.64–1.24) | 0.51 |
| Body mass index, kg/m2 | 1.00 (0.99–1.01) | 0.91 |
| eGFR, ml/min/1.73 m2 | 0.993 (0.988–0.998) | 0.012 |
| Hematocrit, % | 0.97 (0.95–1.00) | 0.039 |
| SBP, mm Hg | 0.997 (0.994–1.000) | 0.093 |
| LV ejection fraction | 1.14 (0.61–2.14) | 0.67 |
|
| ||
| Subgroup*,† | ||
| A | 0.95 (0.59–1.53) | 0.84 |
| B | 0.83 (0.52–1.30) | 0.41 |
| C | 1.38 (0.84–2.28) | 0.21 |
| D | 0.81 (0.55–1.17) | 0.26 |
| E | 0.96 (0.64–1.44) | 0.85 |
Hazard ratios correspond to probability of membership in given subgroup=1 compared to 0. Subgroup F is not listed because sum of probabilities for all subgroups=1.
Likelihood ratio test p=0.31, K statistic increased from 0.629 to 0.630 when subgroup added to full multivariate model
Table 3c.
Hazard ratios associated with subgroup + full multivariate model and primary outcome, CHARM-Preserved, continuous variables, age ≥60
| Predictor | Hazard Ratio (95% CI) | p-value |
|---|---|---|
| Age, year | 1.03 (1.02–1.05) | <0.001 |
| Female | 0.96 (0.71–1.31) | 0.80 |
| Atrial fibrillation | 1.32 (1.11–1.57) | 0.001 |
| Coronary artery disease | 1.08 (0.93–1.26) | 0.30 |
| Diabetes mellitus | 1.47 (1.21–1.78) | <0.001 |
| Hyperlipidemia | 1.12 (0.96–1.31) | 0.001 |
| Valvular disease | 1.00 (0.98–1.01) | 0.14 |
| Alcohol use | 0.81 (0.53–1.23) | 0.33 |
| Body mass index, kg/m2 | 1.00 (0.98–1.01) | 0.66 |
| eGFR, ml/min/1.73 m2 | 0.995 (0.989–1.000) | 0.04 |
| Hematocrit, % | 0.97 (0.94–0.99) | 0.006 |
| SBP, mm Hg | 0.998 (0.994–1.001) | 0.22 |
| LV ejection fraction | 1.31 (0.66–2.60) | 0.45 |
|
| ||
| Subgroup*,† | ||
| A | 1.41 (0.77–2.60) | 0.27 |
| B | 1.12 (0.61–2.06) | 0.71 |
| C | 1.91 (1.06–3.46) | 0.03 |
| D | 0.97 (0.64–1.48) | 0.91 |
| E | 1.26 (0.79–1.99) | 0.33 |
Hazard ratios correspond to probability of membership in given subgroup=1 compared to 0. Subgroup F is not listed because sum of probabilities for all subgroups=1.
Likelihood ratio test p=0.27, K statistic increased from 0.620 to 0.622 when subgroup added to full multivariate model
As described previously,6 in I-PRESERVE NT-proBNP below the median (339 pg/mL) was associated with favorable response to irbesartan overall (HR 0.74, 95% CI 0.60–0.90, p=0.003), and NT-proBNP above the median was associated with increased risk of the primary outcome (HR 2.14, 95% CI 1.90–2.42, p<0.001). Subgroup C patients with low NT-proBNP had a greater reduction in the primary outcome with irbesartan than others (HR 0.45, 95% CI 0.21–0.95, p=0.037), although all other patients with a low NT-proBNP also showed a treatment effect (HR 0.76, 95% CI 0.62–0.94, p=0.013). Patients with high NT-proBNP had no evidence of treatment effect irrespective of subgroup. NT-proBNP associations could not be validated in CHARM-Preserved.
Discussion
Our study demonstrates that multiple specific phenotypes of HFpEF can be identified using simple and widely available clinical variables and that these phenotypes have significantly different outcome rates. With 7316 patients, this is the largest study of cluster-based phenotyping in HFpEF to date. Unlike prior studies that primarily used continuous variables,26 ours is also the first HFpEF phenotype analysis to use categorical variables commonly available in clinical practice. HFpEF likely represents a spectrum of overlapping syndromes in which biologic traits and comorbidities intersect in varied combinations so that no single trait is unique to any given syndrome.7 It is therefore plausible that several factors in combination may identify syndromes with implications for prognosis as previously suggested in HFrEF patients.17,27 Known syndromes may be studied but must be prespecified, as it is impossible to calculate HRs for all combinations of clinical variables. Furthermore, the huge number of interactions makes it difficult for even the most astute clinician to identify similarly complex clinical patterns during routine patient care. The strategy presented here uses a data-driven approach to identify prevalent constellations of clinical characteristics and focus study on relevant subgroups using realistic sample sizes.16 As expected there is considerable overlap of individual clinical features between subgroups, but our results suggest LCA may be a useful exploratory tool for identifying HFpEF sub-populations with higher rates of adverse events or response to a specific intervention and may serve as a starting point for targeted investigation of interactions between HFpEF and comorbid conditions. Incorporating additional clinical, biomarker, and echocardiographic data will likely refine these phenotype definitions.
Differential prognosis between subgroups
Subgroup C had a higher rate of adverse outcomes in the setting of high rates of DM and renal dysfunction. These conditions along with the high rates of obesity and anemia that also characterize Subgroup C can induce chronic systemic inflammation, and it has been postulated that this inflammation may drive both endothelial dysfunction and cardiac hypertrophy, resulting in worsening of HFpEF.9 A subgroup of HFpEF patients enrolled in the RELAX trial was recently identified who were younger and more obese with a higher prevalence of renal disease, hypertension, peripheral vascular disease and pulmonary disease than other patients.11 This subgroup had worse exercise capacity and a higher incidence of hospitalization for cardiac or renal causes at one year, although a mortality difference was not found likely due to the small sample size (216). In the present analysis Subgroup C may represent a more comprehensive description of this phenotype, which had an excess of hospitalization and mortality in both I-PRESERVE and CHARM-Preserved as might be expected based on the outcomes of the diabetic subgroup in RELAX.11
Subgroup remained a significant predictor of the primary outcome in I-PRESERVE when included in multivariate analysis with both the categorical LCA variables and with the addition of SBP, LVEF, and NT-proBNP in I-PRESERVE by LR with a modest impact on the K statistic. This is somewhat expected, as it has been shown previously that when added to several significant predictors, a novel risk factor must have a relatively large effect size (odds ratio ~3) in order to appreciably affect a c-statistic.28 The significance of adding subgroup to clinical variables was less in CHARM-Preserved, and the predictive models performed slightly less well. Although the addition of subgroup to categorical multivariate predictors of the primary outcome in all patients, it did not remain significant when added to multivariate predictors including LVEF and SBP.
Subgroup C showed evidence of possible benefit from irbesartan with a nominally significant reduction in the primary outcome (HR 0.72, p=0.046). A treatment effect in Subgroup C was not observed with candesartan in CHARM-Preserved. This could represent false discovery, but other factors might also be considered. CHARM-Preserved was underpowered to detect a treatment effect in Subgroup C (61% power to detect a 25% reduction in event rate at p<0.05). Although Subgroup C was underpowered in both trials, the presence of an association in an underpowered sample is suggestive of a significant finding, whereas the absence of effect in an underpowered sample is inconclusive. Relative differences between clinical profiles of LCA subgroups were similar between the studies, but absolute rates of some conditions were different between trials in each subgroup possibly affecting potential for treatment response. Finally, previous comparative studies have shown differences between angiotensin receptor blockers with respect to treating hypertension, proteinuria, and preventing progression of diabetic nephropathy.29–31 Consequently, prospective evaluation is preferable to validate the role of irbesartan in treatment of Subgroup C HFpEF patients.
Use in clinical practice and for clinical trial design
Probabilities of subgroup membership for each clinical variable can be used to classify any HFpEF patient according to the subgroups presented here (Appendix). We include in Online Supplemental Material a spreadsheet tool that calculates the likelihood of membership in each HFpEF subgroup based on the 11 LCA component variables using the Bayesian approach. Alternatively, it is common to develop simplified criteria from latent class definitions by employing methods such as classification trees. Translating latent class definitions to simplified criteria for clinical use will be the subject of future work.
Limitations
This is a retrospective analysis, and all findings must be validated prospectively. Because LCA provides a quantitative method for determining an individual’s subgroup these subgroup definitions can be applied directly to other HFpEF patients. However the coefficients derived in this analysis assume the population of interest is similar to I-PRESERVE. As shown in the CHARM-Preserved analysis, profiles of subgroups created in independent populations using these coefficients may differ from those in I-PRESERVE. Validation of multivariate analysis and model performance in CHARM-Preserved may have been affected by non-random missing laboratory data. Although missing laboratory values were imputed, it is possible that imputation was not accurate on a subgroup-by-subgroup basis. Subgroups identified by LCA represent statistical associations of variables and may not necessarily reflect pathophysiology. Consequently, our findings are hypothesis-generating. The present analysis does not reflect an exhaustive iterative process of refining the latent class model in part because there are few standards for comparing LCA models with different numbers of variables. A systematic approach to selecting LCA variables will be the subject of future work to increase the relevance and validity of subgroups identified by LCA.
Conclusion
Using LCA applied to common clinical features, we identified 6 subgroups of HFpEF patients with significant differences in event-free survival. Refinement of these methods for identifying HFpEF subgroups, expansion of the included variables, and validation of our observations prospectively is warranted.
Supplementary Material
Acknowledgments
Dr. Kao was supported by the NHLBI [T32HL007822-12, L30HL110124] and Jacqueline’s Research Fund from the Jacqueline Marie Leaffer Foundation and the University of Colorado Center for Women’s Health Research. I-PRESERVE was funded by Bristol-Myers Squibb and Sanofi-aventis. CHARM-Preserved was funded by AstraZeneca.
Funding: DPK: NIH [T32HL007822-12, L30HL110124], Jacqueline’s Research Fund from the Jacqueline Marie Leaffer Foundation, University of Colorado Center for Women’s Health Research. I-PRESERVE was funded by Bristol-Myers Squibb and Sanofi-aventis. CHARM-Preserved was funded by AstraZeneca.
Footnotes
Disclosures: ISA, PEC, MK, BMM, RM, JVVM, MZ: consultants with honoraria, Bristol-Meyers Squibb for roles in conducting I-PRESERVE. JoL: consultant. Abbot Pharmaceuticals. DPK, JDL: no disclosures.
References
- 1.Campbell RT, Jhund PS, Castagno D, Hawkins NM, Petrie MC, McMurray JJ. What have we learned about patients with heart failure and preserved ejection fraction from DIG-PEF, CHARM-preserved, and I-PRESERVE? J Am Coll Cardiol. 2012;60:2349–56. doi: 10.1016/j.jacc.2012.04.064. [DOI] [PubMed] [Google Scholar]
- 2.Massie BM, Carson PE, McMurray JJ, Komajda M, McKelvie R, Zile MR, Anderson S, Donovan M, Iverson E, Staiger C, Ptaszynska A, I-PRESERVE Investigators Irbesartan in patients with heart failure and preserved ejection fraction. N Engl J Med. 2008;359:2456–67. doi: 10.1056/NEJMoa0805450. [DOI] [PubMed] [Google Scholar]
- 3.Yusuf S, Pfeffer MA, Swedberg K, Granger CB, Held P, McMurray JJ, Michelson EL, Olofsson B, Ostergren J, CHARM Investigators and Committees Effects of candesartan in patients with chronic heart failure and preserved left-ventricular ejection fraction: the CHARM-Preserved Trial. Lancet. 2003;362:777–81. doi: 10.1016/S0140-6736(03)14285-7. [DOI] [PubMed] [Google Scholar]
- 4.Komajda M, Carson PE, Hetzel S, McKelvie R, McMurray J, Ptaszynska A, Zile MR, Demets D, Massie BM. Factors associated with outcome in heart failure with preserved ejection fraction: findings from the Irbesartan in Heart Failure with Preserved Ejection Fraction Study (I-PRESERVE) Circ Heart Fail. 2011;4:27–35. doi: 10.1161/CIRCHEARTFAILURE.109.932996. [DOI] [PubMed] [Google Scholar]
- 5.Haass M, Kitzman DW, Anand IS, Miller A, Zile MR, Massie BM, Carson PE. Body mass index and adverse cardiovascular outcomes in heart failure patients with preserved ejection fraction: results from the Irbesartan in Heart Failure with Preserved Ejection Fraction (I-PRESERVE) trial. Circ Heart Fail. 2011;4:324–31. doi: 10.1161/CIRCHEARTFAILURE.110.959890. [DOI] [PMC free article] [PubMed] [Google Scholar]
- 6.Anand IS, Rector TS, Cleland JG, Kuskowski M, McKelvie RS, Persson H, McMurray JJ, Zile MR, Komajda M, Massie BM, Carson PE. Prognostic value of baseline plasma amino-terminal pro-brain natriuretic peptide and its interactions with irbesartan treatment effects in patients with heart failure and preserved ejection fraction: findings from the I-PRESERVE trial. Circ Heart Fail. 2011;4:569–77. doi: 10.1161/CIRCHEARTFAILURE.111.962654. [DOI] [PubMed] [Google Scholar]
- 7.De Keulenaer GW, Brutsaert DL. Systolic and diastolic heart failure are overlapping phenotypes within the heart failure spectrum. Circulation. 2011;123:1996–2004. doi: 10.1161/CIRCULATIONAHA.110.981431. discussion 2005. [DOI] [PubMed] [Google Scholar]
- 8.Ather S, Chan W, Bozkurt B, Aguilar D, Ramasubbu K, Zachariah AA, Wehrens XH, Deswal A. Impact of noncardiac comorbidities on morbidity and mortality in a predominantly male population with heart failure and preserved versus reduced ejection fraction. J Am Coll Cardiol. 2012;59:998–1005. doi: 10.1016/j.jacc.2011.11.040. [DOI] [PMC free article] [PubMed] [Google Scholar]
- 9.Paulus WJ, Tschöpe C. A Novel Paradigm for Heart Failure with Preserved Ejection Fraction: Comorbidities Drive Myocardial Dysfunction and Remodeling Through Coronary Microvascular Endothelial Inflammation. J Am Coll Cardiol. 2013;62:263–71. doi: 10.1016/j.jacc.2013.02.092. [DOI] [PubMed] [Google Scholar]
- 10.Lam CS, Brutsaert DL. Endothelial dysfunction: a pathophysiologic factor in heart failure with preserved ejection fraction. J Am Coll Cardiol. 2012;60:1787–9. doi: 10.1016/j.jacc.2012.08.004. [DOI] [PubMed] [Google Scholar]
- 11.Lindman BR, Dávila-Román VG, Mann DL, McNulty S, Semigran MJ, Lewis GD, de Las Fuentes L, Joseph SM, Vader J, Hernandez AF, Redfield MM. Cardiovascular Phenotype in HFpEF Patients With or Without Diabetes: A RELAX Trial Ancillary Study. J Am Coll Cardiol. 2014;64:541–9. doi: 10.1016/j.jacc.2014.05.030. [DOI] [PMC free article] [PubMed] [Google Scholar]
- 12.Cleland JG, Tendera M, Adamus J, Freemantle N, Polonski L, Taylor J, PEP-CHF Investigators The perindopril in elderly people with chronic heart failure (PEP-CHF) study. Eur Heart J. 2006;27:2338–45. doi: 10.1093/eurheartj/ehl250. [DOI] [PubMed] [Google Scholar]
- 13.Tavazzi L, Maggioni AP, Marchioli R, Barlera S, Franzosi MG, Latini R, Lucci D, Nicolosi GL, Porcu M, Tognoni G. Effect of rosuvastatin in patients with chronic heart failure (the GISSI-HF trial): a randomised, double-blind, placebo-controlled trial. Lancet. 2008;372:1231–9. doi: 10.1016/S0140-6736(08)61240-4. [DOI] [PubMed] [Google Scholar]
- 14.Rindskopf D. The use of latent class analysis in medical diagnosis. Proceedings of the Survey Research Methods Section. 2002:2912–6. http://www.amstat.org/sections/srms/Proceedings/y2002/files/JSM2002-000332.pdf(Retrieval date: 7 Jun 2011)
- 15.Kim J, Jacobs DR, Luepker RV, Shahar E, Margolis KL, Becker MP. Prognostic value of a novel classification scheme for heart failure: the Minnesota Heart Failure Criteria. Am J Epidemiol. 2006;164:184–93. doi: 10.1093/aje/kwj168. [DOI] [PubMed] [Google Scholar]
- 16.Lanza ST, Rhoades BL. Latent Class Analysis: An Alternative Perspective on Subgroup Analysis in Prevention and Treatment. Prev Sci. 2013;14:157–168. doi: 10.1007/s11121-011-0201-1. [DOI] [PMC free article] [PubMed] [Google Scholar]
- 17.Kao DP, Wagner BD, Robertson AD, Bristow MR, Lowes BD. A Personalized BEST: Characterization of Latent Clinical Classes of Nonischemic Heart Failure That Predict Outcomes and Response to Bucindolol. PLoS One. 2012;7:e48184. doi: 10.1371/journal.pone.0048184. [DOI] [PMC free article] [PubMed] [Google Scholar]
- 18.Lam CS, Donal E, Kraigher-Krainer E, Vasan RS. Epidemiology and clinical course of heart failure with preserved ejection fraction. Eur J Heart Fail. 2011;13:18–28. doi: 10.1093/eurjhf/hfq121. [DOI] [PMC free article] [PubMed] [Google Scholar]
- 19.Cheng CP, Cheng HJ, Cunningham C, Shihabi ZK, Sane DC, Wannenburg T, Little WC. Angiotensin II type 1 receptor blockade prevents alcoholic cardiomyopathy. Circulation. 2006;114:226–36. doi: 10.1161/CIRCULATIONAHA.105.596494. [DOI] [PubMed] [Google Scholar]
- 20.Ho JE, Lyass A, Lee DS, Vasan RS, Kannel WB, Larson MG, Levy D. Predictors of New-Onset Heart Failure: Differences in Preserved Versus Reduced Ejection Fraction. Circ Heart Fail. 2012;6:279–86. doi: 10.1161/CIRCHEARTFAILURE.112.972828. [DOI] [PMC free article] [PubMed] [Google Scholar]
- 21.Chambers J. The left ventricle in aortic stenosis: evidence for the use of ACE inhibitors. Heart. 2006;92:420–3. doi: 10.1136/hrt.2005.074112. [DOI] [PMC free article] [PubMed] [Google Scholar]
- 22.National Kidney Foundation. K/DOQI clinical practice guidelines for chronic kidney disease: evaluation, classification, and stratification. Am J Kidney Dis. 2002;39:S1–266. [PubMed] [Google Scholar]
- 23.Levey AS, Stevens LA, Schmid CH, Zhang YL, Castro AF, Feldman HI, Kusek JW, Eggers P, Van Lente F, Greene T. A new equation to estimate glomerular filtration rate. Ann Intern Med. 2009;150:604–612. doi: 10.7326/0003-4819-150-9-200905050-00006. [DOI] [PMC free article] [PubMed] [Google Scholar]
- 24.Linzer D, Jeffrey J. poLCA: Polytomous variable Latent Class Analysis R package version 1.2. 2010 http://userwww.service.emory.edu/~dlinzer/poLCA.
- 25.White IR, Royston P, Wood AM. Multiple imputation using chained equations: Issues and guidance for practice. Stat Med. 2011;30:377–99. doi: 10.1002/sim.4067. [DOI] [PubMed] [Google Scholar]
- 26.Shah SJ, Katz DH, Selvaraj S, Burke MA, Yancy CW, Gheorghiade M, Bonow RO, Huang CC, Deo RC. Phenomapping for novel classification of heart failure with preserved ejection fraction. Circulation. 2015;131:269–79. doi: 10.1161/CIRCULATIONAHA.114.010637. [DOI] [PMC free article] [PubMed] [Google Scholar]
- 27.Ahmad T, Pencina MJ, Schulte PJ, O’Brien E, Whellan DJ, Piña IL, Kitzman DW, Lee KL, O’Connor CM, Felker GM. Clinical Implications of Chronic Heart Failure Phenotypes Defined by Cluster Analysis. J Am Coll Cardiol. 2014;64:1765–1774. doi: 10.1016/j.jacc.2014.07.979. [DOI] [PMC free article] [PubMed] [Google Scholar]
- 28.Cook NR. Use and Misuse of the Receiver Operating Characteristic Curve in Risk Prediction. Circulation. 2007;115:928–935. doi: 10.1161/CIRCULATIONAHA.106.672402. [DOI] [PubMed] [Google Scholar]
- 29.Oparil S, Williams D, Chrysant SG, Marbury TC, Neutel J. Comparative efficacy of olmesartan, losartan, valsartan, and irbesartan in the control of essential hypertension. J Clin Hypertens (Greenwich) 2001;3:283–91. 318. doi: 10.1111/j.1524-6175.2001.01136.x. [DOI] [PMC free article] [PubMed] [Google Scholar]
- 30.Ono T, Sanai T, Miyahara Y, Noda R. Olmesartan is More Effective Than Other Angiotensin Receptor Antagonists in Reducing Proteinuria in Patients With Chronic Kidney Disease Other Than Diabetic Nephropathy. Curr Ther Res Clin Exp. 2013;74:62–7. doi: 10.1016/j.curtheres.2013.02.002. [DOI] [PMC free article] [PubMed] [Google Scholar]
- 31.Nakamura T, Fujiwara N, Sato E, Ueda Y, Sugaya T, Koide H. Renoprotective Effects of Various Angiotensin II Receptor Blockers in Patients with Early-Stage Diabetic Nephropathy. Kidney Blood Press Res. 2010;33:213–220. doi: 10.1159/000316707. [DOI] [PubMed] [Google Scholar]
Associated Data
This section collects any data citations, data availability statements, or supplementary materials included in this article.