

Abstract
Fundamental to the diagnosis of lung cancer in CT scans is the detection and interpretation of lung nodules. As the capabilities of CT scanners have advanced, higher levels of spatial resolution reveal tinier lung abnormalities. While not all detected lung nodules should be reported, radiologists strive to detect all nodules that might have relevance to cancer diagnosis. Although medium to large lung nodules are detected consistently, inter-reader agreement and reader sensitivity for lung nodule detection diminish substantially as nodule size falls below 8–10 mm. The difficulty in establishing an absolute reference standard presents a challenge to the reliability of studies performed to evaluate lung nodule detection. In the interest of improving detection performance, investigators are using eye tracking to analyze the effectiveness with which radiologists search CT scans relative to their ability to recognize nodules within their search path to determine if strategies might exist to improve performance across readers. Beyond the viewing of transverse CT reconstructions, image processing techniques such as thin-slab maximum intensity projections are used to substantially improve reader performance. Finally, the development of computer-aided detection has continued to evolve with the expectation that one day it will serve routinely as a tireless partner to the radiologist to enhance detection performance without significant prolongation of the interpretive process. This review provides an introduction to the current understanding of these varied issues as we enter the era of widespread lung cancer screening.
Introduction
As discussed throughout this volume, lung cancer screening with CT has reached critical milestones in a long and diligent development. While there remains much to be learned about the health and economic impacts of widespread CT screening for lung cancer, the Centers for Medicare and Medicaid Services in November 2014 proposed that Medicare beneficiaries between the ages of 55 and 74 years who have a cigarette smoking history of at least 30 pack-years will have coverage for lung cancer screening.
Fundamental to the effectiveness of CT screening is the radiologist who is tasked with identifying suspect lesions in the form of pulmonary nodules within the CT data. The magnitude of this challenge can be substantial, particularly for small lung nodules. At the time of their detection on incidence screens in the National Lung Screening Trial, 35% of lung cancers had diameters that were 10 mm or less (1). A CT scan acquired through the entirety of the lungs and reconstructed with 1-mm thick sections, contains approximately 9,000,000 pulmonary voxels. Lung nodules with diameters between 4 and 10 mm occupy 77 to 1200 voxels or 0.00085% to 0.013% of the lung volume, challenging radiologists to identify them all within a search duration of between 2 and 5 minutes under ideal circumstances (2). The goal of this article is to review current knowledge regarding lung nodule detection in CT scans as we transition to the era of widespread CT-based lung cancer screening.
The manner with which CT scans are acquired, reconstructed, displayed and interpreted impacts radiologists’ performance. Supported by the observation that lung nodule detection is improved when thinner CT sections are acquired and reconstructed (3, 4), recent guidelines recommend that screening CT scans are obtained preferentially with 1-mm and not greater than 2.5 mm thick sections (5). These guidelines are consistent with the CT techniques used in both the National Lung Screening Trial (NLST) and the NELSON trials (6, 7). When viewing transverse sections, image size, reader distance from the image, paging rate, and the use of stereoscopic display have been shown to influence lung nodule detection (8–10). This review focuses on issues concerning the assessment of reader performance for the identification of lung nodules, the current understanding of radiologist’s performance, and steps that have been investigated to improve radiologist performance in the identification of lung nodules in general and lung cancer in particular.
Establishing Relevance
Defined as spheroidal localized regions of increased lung attenuation less than 3 cm in diameter, lung nodules occur throughout the lungs but vary substantially in size, CT attenuation, and margination. Depending upon the sensitivity of the interpreter and the quality of the CT data, tiny lung nodules can be identified in virtually all patients undergoing chest CT scanning (Figure 1).
Figure 1.
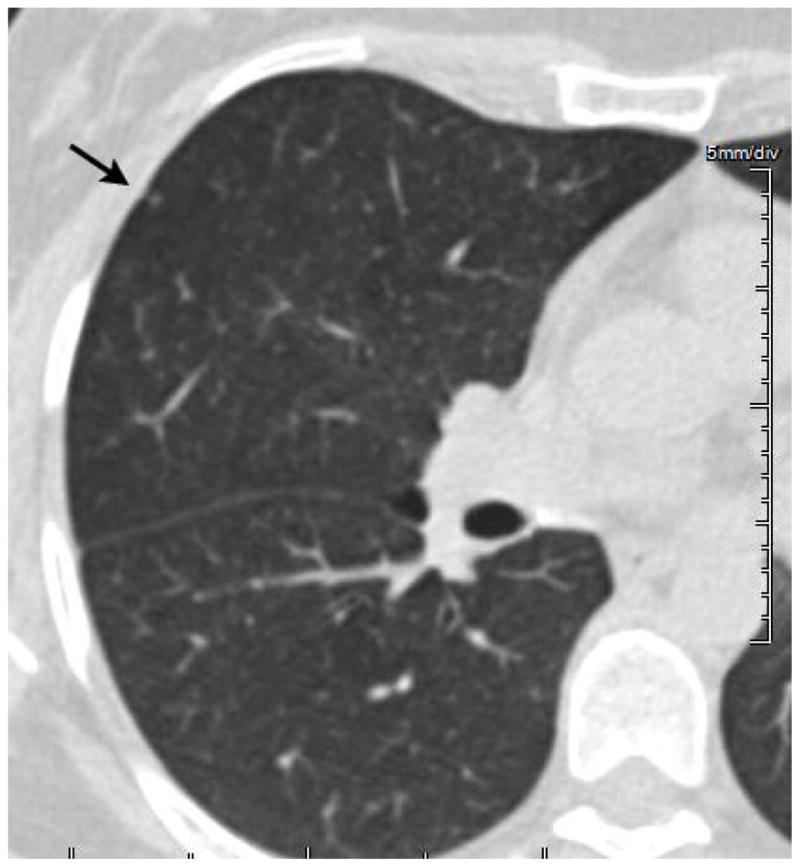
This 1.25-mm thick CT section demonstrates an approximately 2-mm lung nodule (arrow). Nodules such as this or smaller can be found in virtually every CT scan obtained beyond young adulthood. Because nodules of this size are overwhelmingly benign there is no relevance to their identification unless disseminated or presenting as a new finding in a patient with documented malignancy. There is essentially no role for reporting this nodule within the context of lung cancer screening.
Before engaging in a discussion of the effectiveness with which radiologists detect lung nodules, we must establish the criteria for a nodule that should be reported. Because CT is capable of detecting nodules as small as 1-mm in diameter and because the vast majority of small lung nodules are benign (11), investigators have sought to define a nodule diameter boundary below which lung nodules are clinically insignificant and can thus be ignored. In a landmark publication that has guided lung nodule management in many medical centers for almost 10 years, the Fleischner Society published guidelines on the management of solid lung nodules based upon available evidence (12). While these guidelines allowed that solid nodules 4 mm in diameter could be ignored in low-risk patients, they also recommended that all nodules be followed regardless of size for high-risk patients. A subsequent publication has augmented the guidelines for both solitary and multiple ground glass and part solid nodules (13). The Fleischner Society’s guidelines aim to guide the interpretation of all chest CT scans and are thus not specific to lung cancer screening. Recently published guidelines specific to lung cancer screening have refined the approach to managing lung nodules detected within the context of a screening program. While articulating a very low likelihood for malignancy, the guidelines recommend accelerated follow-up for new nodules greater than 4-mm in diameter (14). Other experts relying upon data from the NELSON and NLST trials have suggested that nodules < 6 mm might be ignored (15, 16). While the issue of which nodules should be reported continues to evolve, solid nodules greater than 4-mm and ground glass nodules greater than 20-mm are currently considered important to detect and track, particularly within the context of newly appearing nodules on follow-up screens (14).
Establishing Truth
Pulmonary nodules are imaging findings that are presumed to correspond to abnormalities of the lung parenchyma. While the point is nuanced, radiologist’s performance can be assessed on a basis of detecting imaging findings (lung nodules) or pathologically proven lung cancer. In the former case, the relevance of the observation is challenged, because absolute confirmation of lung nodule pathology is rarely available. In the latter case, because nodule detections that are not cancer dominate, the majority of observations are either assigned to be false positive lung cancers or intermediate findings in a longitudinal imaging protocol that defines positivity based upon nodule growth.
In lung cancer screening, the principal task for the radiologist is to identify and assess lung nodules. For the majority of studies of nodule detection, the reference standard has been determined based upon expert opinion. This method relies upon one or more CT readers establishing the reference against which the performance of other radiologists or computerized algorithms is measured. When the panel is composed of more than one radiologist, truth has been based upon consensus or a threshold number of panelists who agree on the presence of a nodule (17). For some studies, the panel’s independent assessment of the CT images is used as a basis of comparison to the readers, while in other studies the panel’s independent assessment of the CT images is augmented by direct adjudication of the observers’ decisions. The merits of these various methods remain open for discussion, however in aggregate, the use of an expert observer(s) to establish the reference standard, while easy to execute, has fundamental flaws relating to the subjectivity and fallibility of the panelists’ assessments. These limitations have been documented in a study that found that the sensitivity and false positive rate of nodule detection by radiologists varied from 51.0 to 83.2% and 0.33 to 1.39 per case, respectively, when different combinations of experienced radiologists set the reference standard (18).
One other challenge that affects lung nodule reference sets is consistency in establishing the size of nodules at the lower boundary of significance. Most studies of lung nodule detection in CT have sought to examine nodules above an integer threshold between 3 and 5 millimeters in diameter, inclusive. Because nodules smaller than 3 mm are readily identified, there will be detections that fall above and below the lower size threshold. Reliable sizing of lung nodules is challenged by subjectivity in selecting the best dimension to measure and consistency in making the measurement through manual manipulation of digital calipers. As a result, a nodule measured just above the lower threshold for inclusion in the truth set might have been excluded by a reader on the basis of a measurement just below the threshold and vice versa. This represents an additional source of disagreement between readers and the reference standard, serving to diminish measures of detection performance and observer agreement. One logical solution to this latter dilemma would be the use of a computer algorithm to segment the nodule margins in order to measure a consistent reference diameter for each nodule. The topic of lung nodule sizing is addressed further in a separate article within this volume.
One method used to counteract the subjectivity inherent in truth panel assignments of native lung nodules is the embedding of computer-generated nodules into lung CT scans (2, 19). Effective use of this technique is based upon technologies to synthesize nodules with a variety of characteristics, to simulate CT scans of the resulting nodule models, and to embed them realistically into CT scans (2, 20). One other intriguing paradigm for assessing lung nodule detection involves a preoperative CT prior to pulmonary metastasectomy with palpation and subsequent pathological examination serving as the reference standard (21–23).
Current State of Radiologist Performance
Following from the previous discussion of reference standard, measured radiologist performance is influenced by the goal of the analysis. When focusing on lung nodule detection, multiple studies have consistently revealed low inter-observer agreement amongst radiologists for lung nodule detection (24–27), and as a result, measures of detection performance have been highly variable as well. Depending upon the nature of the input data, patient population, method of reference standard determination, and criteria for lung nodule identification, reported sensitivities range from 30–97% with false positive counts of 0.6–2.1 per patient (2, 3, 21–23, 25, 28–30). Thinner CT sections, larger lung nodules, and a predominance of solid versus ground glass or part solid nodules are associated with higher sensitivities (Figure 2). In one recent study to assess detection of computer-generated solid 5-mm nodules that were embedded within lung CT data reconstructed with 1.25-mm sections, sensitivities amongst 13 readers reviewing transverse reconstructions using cine-paging technique varied from 30–73% with a mean sensitivity of 49% (2). The location of the nodule relative to normal lung structures of similar cross-sectional dimension appears to affect consistency of detection across readers (Figure 3) These performance values indicate that even in the presence of an absolute reference standard and the use of thin-section CT acquisition, the identification of small pulmonary nodules is very difficult and performed by radiologists with varying sensitivity.
Figure 2.
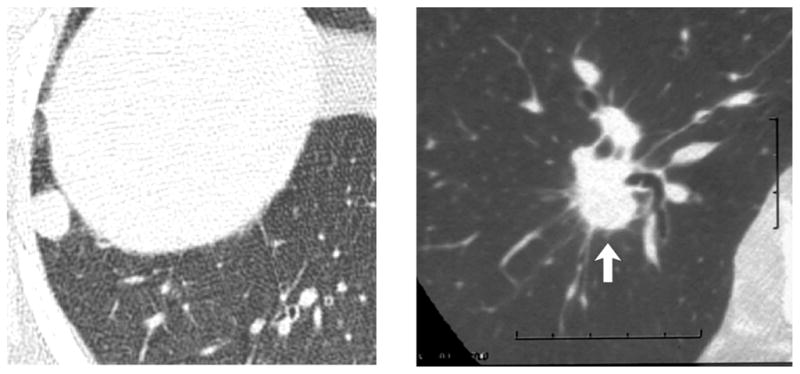
Two examples of 12 mm lung nodules from two different patients. The nodule on the left is not associated with normal lung structures in its vicinity and thus is easy to detect. The nodule on the right (arrow) is closely associated with 5–8 mm pulmonary blood vessels. Although it is substantially larger than adjacent blood vessels, it appears less conspicuous than the nodule at left.
Figure 3.

Five mm lung nodules (red circles). The number in the upper left corner corresponds to the number of radiologists out of 13 who detected the nodule. Differences in the regional lung complexity and the cross-sectional area of the lungs on these cross-sections may be a key determinate in their detection.
While the detection of lung cancer on screening CT exams begins with the detection of lung nodules, and the preceding data establishes a high degree of variability in nodule detection by radiologists, it is important to note that radiologist sensitivity for detecting lesions that are ultimately proven to be lung cancer has been consistently high in CT screening trials (1, 31, 32). Within the context of incidence screening 1–2 years following a baseline CT scan in the NLST and NELSON trials, sensitivity was 94.4–96.4% and negative predictive value was 99.9%. Greater variance was observed between the two trials when quantifying specificity (72.6 and 99.0%) and positive predictive value (2.4 and 42.2%) for NLST and NELSON, respectively, however they are likely to reflect the use of an indeterminate category in the NELSON trial as a means for delaying the call of positive or negative until follow-up CT was performed (1, 31). Interobserver agreement in a sub-study of the NLST was moderate amongst experienced readers (kappa = 0.58–0.64) with pair-wise agreement on positive versus negative screening averaging 82% (range 64%–92%) and 81% (range 68%–92%), respectively (33).
Amongst 34 patients with interval lung cancers detected after the baseline screen in the NELSON trial, only 35% were not visible on prior CT scans, while 50% were not diagnosed because of radiological detection and interpretation errors. The remaining 15% were attributed to protocol errors or participant non-compliance. Among the 17 patients for whom a failure to detect lung cancer was attributed to radiologist error, 13 were attributed to detection error, two were attributed to human error, and two were attributed to interpretation error. The 13 lung cancers missed because of detection errors were: intrabronchial localized lesions (five); pleural-attached lesions (two); lesion adjoining a bullous structure (one); lesion surrounded by extensive honeycombing (one); and four cases where an intrapulmonary lesion was not visible but signs of lung cancer metastases were missed (three cases of mediastinal lymphadenopathy, and one case of pleural effusion). Compared with screen-detected cancers, interval cancers were diagnosed at more advanced stages. In light of this analysis, overall sensitivity of lung cancer screening in NELSON was 85% (32).
In a similar analysis, Investigators from the International Early Lung Cancer Action Program (I-ELCAP) Consortium recently conducted a retrospective review of annual repeat CT screening exams that were performed on 104 patients with newly diagnosed lung cancer. The prior scans were obtained with predominately 1.25–2.5 mm section thickness, 7–18 months prior to the scan on which the diagnosis was made. The cancers were not visible in 23%, were visible but not identified in 54%, and were identified but not classified as malignant in 23% of prior CT scans (34). Of 56 lesions that were visible on prior exam but not identified, 30% (N=17) were < 3 mm; 38% (N=21) had a similar size as surrounding blood vessels; 32% (N=18) were larger than surrounding blood vessels; 80% (N=45) were solid; and 64% (N=36) were peripheral on the prior annual screening exam. At the time of diagnosis, 18% had progressed beyond stage 1. While the impact of delayed diagnosis on health outcomes cannot be ascertained from these data, these results are not surprising in light of the aforementioned challenges of limited and varied sensitivity for lung nodule detection in general.
The Process of Lung Nodule Detection
Despite remarkable advances in CT technology and its evolution for diagnostic medical imaging, its use in managing patients and detecting disease remains wholly dependent upon a human observer and interpreter. Radiologists undergo many years of education and training and while the training of radiologists assures a deep knowledge base across a spectrum of manifestations of diseases and normal tissues on imaging studies, our understanding of how radiologists detect and recognize imaging findings is rudimentary. Lung nodule detection with CT is amongst the most difficult of these tasks, which requires a search through approximately 300 transverse sections, each composed of over 260,000 pixels, to recognize nodules that in the case of 5-mm lesion encompass 5/10,000th of the image area within the reconstructed cross-section and that occur within a background of highly complex lung tissue. In order to improve the process of lung nodule detection, we should strive to understand the process of lung nodule detection.
From the late 1970’s and into the 1990’s, Harold Kundel and his colleagues at the University of Pennsylvania conducted a number of experiments using eye tracking in order to understand the basis for radiologists’ detection and recognition of pulmonary lesions in chest radiographs. While a detailed description of their findings is beyond the scope of this review, an examination of some of their key observations is germane to the present discussion. Based upon eye tracking studies of search paths, fixations, and dwell times, they categorized the process of image interpretation into four sequential processes – orientation, search, recognition, and decision making (35). By tracking the center of gaze, the eye tracker indicates the focal point of vision. Based upon the concept of a volumetric gaze cone with vertex centered on the pupil and centered along the line of sight within which an object will be seen (36). For chest radiographic analysis, Kundel determined that the visual angle, analogous to the vertex angle of the gaze cone, within which a lung nodule is detected during random search was between approximately 3.5–5 degrees (37, 38), corresponding to a 4.3–6.1 cm circular region on the surface of a radiograph positioned 70-cm from the observer.
These concepts were recently applied to a study of CT interpretation. During cine paging through stacks of 1.25-mm thick CT sections augmented with synthetic 5-mm nodules, the center of gaze and the section position was recorded to define a unique four-dimensional (x, y, z, t) gaze path through the lung volumes (2). Across 13 readers, 987/989 detected nodules were centered within 50 pixels of the nearest gaze point and only 2 nodules were detected amongst the 1050 nodules that were never closer than 50 pixels from the gaze path. Based upon this 50-pixel radius, a circular region with diameter of 100 pixels corresponded to 60 mm within the lungs and a visual angle of 2.6 degrees. Based upon this diameter applied to the visual search paths of 520 CT interpretations by 13 readers, on average only 27% of the lung volume was within 50 pixels of the nearest gaze point. Moreover, nodules occurring in the 73% of the lung that was outside of this region were detected in less than 0.2% of instances. False negative detections that were outside of the gaze volume can be characterized as search errors and those within the gaze volume as recognition-acceptance errors. Overall between 9 and 45% (mean 25%) of nodules were not detected because they were outside of the gaze volume. Within the gaze volume, nodules were correctly recognized and accepted with a sensitivity of 47–84% (mean 65%) (2).
Eye tracking can reveal variations in a radiologist’s approach to searching the lungs (37, 39) (Figure 4). Drew and colleagues have classified lung CT interpreters as either “drillers” or “scanners” based upon their tendency to hold their eyes relatively still in x and y planes while quickly scrolling through the z axis (“drillers”) or to search individual transverse sections fully before moving to the next section (“scanners”). The sensitivity of drillers and scanners for the detection of lung nodules was 60%, and 48%, respectively, suggesting that a drilling strategy might be superior to a scanning strategy (39).
Figure 4.

Plots of gaze paths from two readers (top and bottom rows) evaluating the same stack of 1.25-mm thick CT sections for lung nodules. The duration of the search is divided into five segments and colored red, orange, green, aqua, and blue from beginning to end of the search. Plots on the left show the section number displayed from beginning to end of search. Plots on the right show the gaze point over time projected through all transverse sections. The first reader (top row) is classified as a scanner. He starts at the top of the lungs scanning the anterior portion of both lungs before moving inferiorly. When reaching the bottom of the lungs, the reader reverses direction scanning laterally in the posterior aspect of the lungs. The second reader (bottom row) completes nine passes through the lungs, searching the right lung over four passes before moving to the left lung for three passes before returning to the right lung for two more passes. This pattern has been classified as a “drilling” search pattern. The scan contained 4 5-mm nodules in the right lung and one in the left lung. These search patterns were consistent for the two readers across 40 datasets. Nodule detection sensitivity across 40 scans for the two readers was 46% and 73%, respectively.
Ideally a diagnostic test focused principally on the identification of lung nodules would result in the detection of a greater proportion of the nodules present. Perceptual factors such as target conspicuity and background clutter, as well as attentional factors that include satisfaction of search and early termination of search can influence the effectiveness of lesion detection (40). Collectively, these results suggest that radiologists might benefit from feedback or guidance to produce search paths that are more likely to result in a higher nodule detection rate. Providing gaze feedback to interpreters of chest radiographs has been shown to result in conversion of false negative results to true positive decisions (41). This approach has not been reported with CT scanning.
These approaches to studying the conscious and subconscious behaviors of radiologists as they interpret lung CT scans provide a glimpse as to how a greater understanding of these processes might help develop training and feedback approaches that could improve performance. While this line of inquiry remains to be developed, substantially greater efforts have been applied to the development of image processing and analysis tools intending to simplify the process of searching the lungs and facilitating lung nodule detection.
Image Based Methods for Performance Improvement
The means with which CT data are presented to the radiologist has a profound impact on detection performance, particularly for small lung nodules. Viewing transverse sections on a cine display results in the detection of 31% more nodules 5 mm when compared to film-based review (42). With the advent of image review stations that allow real-time reformation and rendering of transverse sections, an innumerable range of approaches are possible for navigating and evaluating the rich volumetric lung CT data (43) which impact radiologists’ effectiveness and efficiency of search (44).
One technique that is easily implemented and standardized is the creation of transverse maximum intensity projections through overlapping thin-slabs (TS-MIP) (45) (Figure 5). The principal advantage of this approach has been realized to a greater extent as primary reconstructions have become thinner with cross-sections of blood vessels and other normal lung structures mimicking the appearance of nodules. TS-MIP overcomes this limitation while preserving the diminished volume averaging benefits of thin, < 2 mm reconstruction, by displaying the longitudinal course of the vessels and enabling their discrimination from nodules. The primary review of TS-MIPs for lung nodule detection has been shown to enhance detection across reviewers, but also to preferentially enhance performance in less experienced readers, diminishing the gap in performance across the experience domain (46). Greater improvement of detection has been observed for < 5mm nodules with transverse TS-MIP when compared to primary reading of both 5 and 1-mm CT reconstructions (47). Interestingly, coronal TS-MIPs have been not as effective as transverse TS-MIPs. The performance gains realized with TS-MIP have been documented for solid nodules exclusively. In an analysis of ground glass nodule detection in low-dose CT scans, 7-mm TS-MIP was not significantly different from 1- or 5-mm transverse reconstructions (48).
Figure 5.
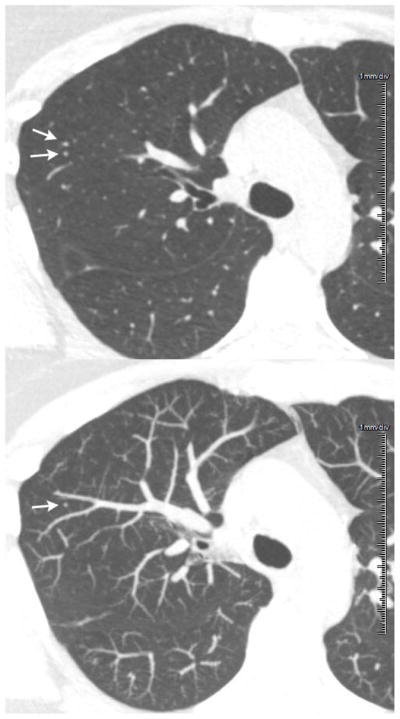
A 1.25-mm thick transverse CT section revels two 4-mm rounded opacities appearing as lung nodules (arrows in top image). A 7-mm thick TS-MIP centered on the transverse section above reveals that only the posterior of the two opacities is a lung nodule (arrow in bottom image) and the anterior opacity corresponds to a part of a normal blood vessel (bottom).
Two improvements to the interpretation of TS-MIPs, aimed at overcoming limitations of overlap between nodules and other lung structures within the slab have been proposed. The use of stereoscopic display to view TS-MIPs has been shown to improve nodule detection and shorten interpretation time when compared to standard viewing (8), and the use of thin-slab volume rendering has been shown to significantly improve the detection of lung nodules relative to TS-MIP for nodules <11 mm in diameter (49).
Because the principal means for analyzing indeterminate lung nodules is to assess for growth and because the detection of interval cancers in CT scans of patients with stable benign nodules is an important element of lung cancer screening, tools that highlight change over time could have a major impact on the efficiency and effectiveness with which screening CT is interpreted. The primary approach studied to date involves registration of priors with the examination to be interpreted. There are two approaches to matching lung nodules over time. The first involves nodule identification and segmentation followed by sub-region matching (50). The second and more flexible approach involves morphing the datasets to one another using non-rigid transformation to accommodate for relative and absolute differences in local lung position owing to differences in body position and in both global and local lung volumes (51). This latter approach provides a means for both nodule matching over time and the display of prior locations where new nodules have appeared. In the setting of pulmonary metastasis assessment, lung nodule matching algorithms perform best when there are not major changes in lung expansion or major new parenchymal abnormalities (52). Because the underlying lung architecture is more consistent in lung cancer screening scans when compared to patients with lung metastases, the reliability of matching algorithms is much greater in this population. A matching rate of 92.7% was a achieved in three serial CT scans from 40 subjects with 143 nodules from the NLST (53).
With progressive improvements in the effectiveness of warping and morphing algorithms for aligning serial CT scans, the use of temporal subtraction has been proposed as a means for improving the conspicuity of changes over time. A recent feasibility study showed significant improvement in the detection of actionable nodules when comparing temporal subtraction to standard viewing (54). Further experience will be required to ascertain the generalizability and utility of this technique.
Computer Aided Detection (CAD)
Beyond direct manipulation of the CT image, computer aided detection (CAD) employs computer algorithms that extract and analyze features within the CT data in order to isolate and highlight regions where abnormalities are likely. Lung nodule detection has been amongst the most widely developed and investigated applications for CAD (25, 30, 55–61). The inexhaustible nature of a computer algorithm represents an appealing partner for the radiologist who must struggle with the perceptual challenges of being human. Indeed, in spite of substantial variability in the implementation and performance of commercial CAD systems, the combination of a radiologist and any one of three tested CAD systems produced indistinguishably superior performance when compared to the radiologist’s interpretation alone (62).
Of greatest benefit for facilitating detection of smaller nodules (25, 57, 60), CAD consistently detects nodules that are not seen by radiologists and when used to augment radiologist’s readings, substantially reduces inter-observer variability (59). While the focus of most CAD development has been directed toward solid nodules, systems tuned to the detection of ground glass and part solid nodules are emerging (63–65), and have been shown to improve reader performance for all three classes of lung nodule (64).
While the greatest focus of CAD performance assessment has been on lung nodule detection, CAD has also been investigated from the perspective of lung cancer detection. The feasibility of CAD detecting lung cancers that were missed by radiologists was demonstrated in 2002 using 10-mm thick low-dose screening CT scans. A sensitivity of 84% for the detection of missed lung cancer by a CAD algorithm without human participation was associated with an average of 28 false positives per scan (55). A subsequent study using a different CAD algorithm investigated 17 patients with missed lung cancer on 10-mm thick low-dose screening CT and found that reader sensitivity improved from 52% to 68% with CAD (63). Most recently CAD was assessed retrospectively in 134 subjects from the NLST, resulting in improved inter-observer agreement (kappa increase from 0.53–0.66). Pairwise agreement on the positivity of screening results and follow-up recommendations per case amongst seven chest radiologists increased from 77% and 72% at initial assessment to 84% and 80% with CAD (66)
While commercial CAD systems primarily operate as black boxes, at the heart of all CAD systems is the opportunity to tune the system and balance the sensitivity of nodule detection with false positive results. Although radiologists are very effective at rejecting CAD’s false positive results, the process is time consuming and thus CAD system developers must strike a balance between sensitivity and false positives per scan (30). Considering workflow and efficiency of CT interpretation, there are several models for CAD use.
The aforementioned studies of lung CAD focus on CAD as a second reader, meaning that the radiologist reviews the images independently and then secondarily reviews CAD markings to determine if there are any nodules that they had not detected. Two studies have recently examined alternative models for incorporating CAD into the clinical workflow. In a comparison of concurrent versus second reader modes, reading time was significantly shorter in the concurrent-reader mode (132 s) when compared to the second-reader mode (210 s). Diagnostic performance was slightly diminished with concurrent relative to second reader mode, but the difference was not significant (p=0.35) (67). With a slightly different twist on the workflow process, Godoy and colleagues considered the question of detection performance when readers evaluate thick (5-mm) CT sections while CAD operates on thin (1-mm) CT sections. This performance was compared to thin-section readings with and without CAD, and CAD alone. The advantage of the former strategy is 80% fewer transverse reconstructions need to be evaluated by the reader, and while spatial resolution is decreased when compared to a thin section, the thin sections were available to review within the context of assessing CAD detections. In this study, which included a blend of ground glass, part solid, and solid nodules, reading thick followed by thin-section CAD (80% sensitivity, 1.26 FP) resulted in significantly more detections than reading thin alone (65% sensitivity, 0.64 FP), however, reading thin followed by thin-section CAD (84% sensitivity, 0.90 FP) was significantly better than reading thick followed by thin-section CAD (64). Interpretation times for the various strategies were not reported. Despite over a decade of investigation and refinement, lung CAD is rarely used in clinical practice. Nevertheless, there are compelling reasons for lung CAD to become a routine part of CT interpretation in the setting of lung cancer screening. Critical to its adoption will be a workflow that facilitates both efficiency and effectiveness of interpretation.
Conclusion
While seemingly a straightforward task, the effective and efficient detection of lung nodules on CT presents many challenges to the radiologist, which result in limited sensitivity and interobserver agreement for many nodule detection applications. Within the context of lung cancer screening, performance is impacted by the threshold size for actionability and the associated management protocol, which assures repeated exams to limit the time interval before another opportunity for detection arises. When serial CT exams are acquired to assess lesion growth and thus classify a finding as positive, performance is significantly better than for nodule detection in general. Nevertheless, in the interest of maximizing the effectiveness of interpretation, greater understanding of how radiologists detect lung nodules as well as how a spectrum of alternative visualization methods and CAD might be used systematically is needed. In light of the magnitude of lung cancer screening CT scans anticipated to be performed, these investigations should be prioritized.
References
- 1.Aberle DR, DeMello S, Berg CD, et al. Results of the two incidence screenings in the National Lung Screening Trial. The New England journal of medicine. 2013;369(10):920–31. doi: 10.1056/NEJMoa1208962. [DOI] [PMC free article] [PubMed] [Google Scholar]
- 2.Rubin GD, Roos JE, Tall M, et al. Characterizing Search, Recognition, and Decision in the Detection of Lung Nodules on CT Scans: Elucidation with Eye Tracking. Radiology. 2014:132918. doi: 10.1148/radiol.14132918. [DOI] [PubMed] [Google Scholar]
- 3.Fischbach F, Knollmann F, Griesshaber V, Freund T, Akkol E, Felix R. Detection of pulmonary nodules by multislice computed tomography: improved detection rate with reduced slice thickness. European radiology. 2003;13(10):2378–83. doi: 10.1007/s00330-003-1915-7. [DOI] [PubMed] [Google Scholar]
- 4.Sinsuat M, Saita S, Kawata Y, et al. Influence of slice thickness on diagnoses of pulmonary nodules using low-dose CT: potential dependence of detection and diagnostic agreement on features and location of nodule. Academic radiology. 2011;18(5):594–604. doi: 10.1016/j.acra.2011.01.007. [DOI] [PubMed] [Google Scholar]
- 5.Kazerooni EA, Austin JHM, Black WC, et al. ACR-STR practice parameter for the performance and reporting of lung cancer screening thoracic computed tomography (CT): 2014 (Resolution 4) Journal of thoracic imaging. 2014;29(5):310–6. doi: 10.1097/RTI.0000000000000097. [DOI] [PubMed] [Google Scholar]
- 6.Xu DM, Gietema H, de Koning H, et al. Nodule management protocol of the NELSON randomised lung cancer screening trial. Lung cancer (Amsterdam, Netherlands) 2006;54(2):177–84. doi: 10.1016/j.lungcan.2006.08.006. [DOI] [PubMed] [Google Scholar]
- 7.Team NLSTR. Aberle DR, Berg CD, et al. The National Lung Screening Trial: overview and study design. Radiology. 2011;258(1):243–53. doi: 10.1148/radiol.10091808. [DOI] [PMC free article] [PubMed] [Google Scholar]
- 8.Wang XH, Durick JE, Lu A, et al. Compare display schemes for lung nodule CT screening. Journal of Digital Imaging. 2011;24(3):478–84. doi: 10.1007/s10278-010-9293-6. [DOI] [PMC free article] [PubMed] [Google Scholar]
- 9.Copley SJ, Bryant TH, Chambers AA, et al. Observer accuracy in the detection of pulmonary nodules on CT: effect of cine frame rate. Clinical Radiology. 2010;65(2):133–6. doi: 10.1016/j.crad.2009.05.016. [DOI] [PubMed] [Google Scholar]
- 10.Seltzer SE, Judy PF, Feldman U, Scarff L, Jacobson FL. Influence of CT image size and format on accuracy of lung nodule detection. Radiology. 1998;206(3):617–22. doi: 10.1148/radiology.206.3.9494475. [DOI] [PubMed] [Google Scholar]
- 11.Benjamin MS, Drucker EA, McLoud TC, Shepard J-AO. Small pulmonary nodules: detection at chest CT and outcome. Radiology. 2003;226(2):489–93. doi: 10.1148/radiol.2262010556. [DOI] [PubMed] [Google Scholar]
- 12.MacMahon H, Austin JHM, Gamsu G, et al. Guidelines for Management of Small Pulmonary Nodules Detected on CT Scans: A Statement from the Fleischner Society 1. Radiology. 2005;237(2):395–400. doi: 10.1148/radiol.2372041887. [DOI] [PubMed] [Google Scholar]
- 13.Naidich DP, Naidich DP, Bankier AA, et al. Recommendations for the management of subsolid pulmonary nodules detected at CT: a statement from the Fleischner Society. Radiology. 2013;266(1):304–17. doi: 10.1148/radiol.12120628. [DOI] [PubMed] [Google Scholar]
- 14.American College of Radiology. Lung CT Screening Reporting and Data System (Lung-RADS) 2015 Nov 15; doi: 10.1016/j.jacr.2015.07.015. Available from: http://www.acr.org/Quality-Safety/Resources/LungRADS. [DOI] [PubMed]
- 15.Horeweg N, van Rosmalen J, Heuvelmans MA, et al. Lung cancer probability in patients with CT-detected pulmonary nodules: a prespecified analysis of data from the NELSON trial of low-dose CT screening. The Lancet Oncology. 2014 doi: 10.1016/S1470-2045(14)70389-4. [DOI] [PubMed] [Google Scholar]
- 16.Gierada DS, Pinsky P, Nath H, Chiles C, Duan F, Aberle DR. Projected outcomes using different nodule sizes to define a positive CT lung cancer screening examination. J Natl Cancer Inst. 2014;106(11) doi: 10.1093/jnci/dju284. [DOI] [PMC free article] [PubMed] [Google Scholar]
- 17.Armato SG, McLennan G, Bidaut L, et al. The Lung Image Database Consortium (LIDC) and Image Database Resource Initiative (IDRI): a completed reference database of lung nodules on CT scans. Medical Physics. 2011;38(2):915–31. doi: 10.1118/1.3528204. [DOI] [PMC free article] [PubMed] [Google Scholar]
- 18.Armato SG, Roberts RY, Kocherginsky M, et al. Assessment of radiologist performance in the detection of lung nodules: dependence on the definition of "truth". Academic radiology. 2009;16(1):28–38. doi: 10.1016/j.acra.2008.05.022. [DOI] [PMC free article] [PubMed] [Google Scholar]
- 19.Naidich DP, Rusinek H, McGuinness G, Leitman B, McCauley DI, Henschke CI. Variables affecting pulmonary nodule detection with computed tomography: evaluation with three-dimensional computer simulation. Journal of thoracic imaging. 1993;8(4):291–9. doi: 10.1097/00005382-199323000-00005. [DOI] [PubMed] [Google Scholar]
- 20.Karadi C, Beaulieu CF, Jeffrey RB, Jr, Paik DS, Napel S. Display modes for CT colonography. Part I. Synthesis and insertion of polyps into patient CT data. Radiology. 1999;212(1):195–201. doi: 10.1148/radiology.212.1.r99jl25195. [DOI] [PubMed] [Google Scholar]
- 21.Kang MC, Kang CH, Lee HJ, Goo JM, Kim YT, Kim JH. Accuracy of 16-channel multi-detector row chest computed tomography with thin sections in the detection of metastatic pulmonary nodules. European journal of cardio-thoracic surgery: official journal of the European Association for Cardio-thoracic Surgery. 2008;33(3):473–9. doi: 10.1016/j.ejcts.2007.12.011. [DOI] [PubMed] [Google Scholar]
- 22.Cerfolio RJ, McCarty T, Bryant AS. Non-imaged pulmonary nodules discovered during thoracotomy for metastasectomy by lung palpation. European journal of cardio-thoracic surgery: official journal of the European Association for Cardio-thoracic Surgery. 2009;35(5):786–91. doi: 10.1016/j.ejcts.2009.01.012. discussion 91. [DOI] [PubMed] [Google Scholar]
- 23.Ellis MC, Hessman CJ, Weerasinghe R, Schipper PH, Vetto JT. Comparison of pulmonary nodule detection rates between preoperative CT imaging and intraoperative lung palpation. American journal of surgery. 2011;201(5):619–22. doi: 10.1016/j.amjsurg.2011.01.005. [DOI] [PubMed] [Google Scholar]
- 24.Leader JK, Warfel TE, Fuhrman CR, et al. Pulmonary nodule detection with low-dose CT of the lung: agreement among radiologists. AJR American journal of roentgenology. 2005;185(4):973–8. doi: 10.2214/AJR.04.1225. [DOI] [PubMed] [Google Scholar]
- 25.Rubin GD, Lyo JK, Paik DS, et al. Pulmonary nodules on multi-detector row CT scans: performance comparison of radiologists and computer-aided detection. Radiology. 2005;234(1):274–83. doi: 10.1148/radiol.2341040589. [DOI] [PubMed] [Google Scholar]
- 26.Armato SG, McNitt-Gray MF, Reeves AP, et al. The Lung Image Database Consortium (LIDC): an evaluation of radiologist variability in the identification of lung nodules on CT scans. Academic radiology. 2007;14(11):1409–21. doi: 10.1016/j.acra.2007.07.008. [DOI] [PMC free article] [PubMed] [Google Scholar]
- 27.Pinsky PF, Gierada DS, Nath PH, Kazerooni E, Amorosa J. National lung screening trial: variability in nodule detection rates in chest CT studies. Radiology. 2013;268(3):865–73. doi: 10.1148/radiol.13121530. [DOI] [PMC free article] [PubMed] [Google Scholar]
- 28.Diederich S, Semik M, Lentschig MG, et al. Helical CT of pulmonary nodules in patients with extrathoracic malignancy: CT-surgical correlation. AJR American journal of roentgenology. 1999;172(2):353–60. doi: 10.2214/ajr.172.2.9930781. [DOI] [PubMed] [Google Scholar]
- 29.Ko JP, Rusinek H, Naidich DP, et al. Wavelet compression of low-dose chest CT data: effect on lung nodule detection. Radiology. 2003;228(1):70–5. doi: 10.1148/radiol.2281020254. [DOI] [PubMed] [Google Scholar]
- 30.Roos JE, Paik D, Olsen D, et al. Computer-aided detection (CAD) of lung nodules in CT scans: radiologist performance and reading time with incremental CAD assistance. European radiology. 2010;20(3):549–57. doi: 10.1007/s00330-009-1596-y. [DOI] [PMC free article] [PubMed] [Google Scholar]
- 31.van Klaveren RJ, Oudkerk M, Prokop M, et al. Management of Lung Nodules Detected by Volume CT Scanning. The New England journal of medicine. 2009;361(23):2221–9. doi: 10.1056/NEJMoa0906085. [DOI] [PubMed] [Google Scholar]
- 32.Horeweg N, Scholten ET, de Jong PA, et al. Detection of lung cancer through low-dose CT screening (NELSON): a prespecified analysis of screening test performance and interval cancers. The Lancet Oncology. 2014 doi: 10.1016/S1470-2045(14)70387-0. [DOI] [PubMed] [Google Scholar]
- 33.Gierada DS, Pilgram TK, Ford M, et al. Lung cancer: interobserver agreement on interpretation of pulmonary findings at low-dose CT screening. Radiology. 2008;246(1):265–72. doi: 10.1148/radiol.2461062097. [DOI] [PubMed] [Google Scholar]
- 34.Xu DM, Yip R, Smith JP, Yankelevitz DF, Henschke CI Investigators ftI-E. Retrospective Review of Lung Cancers Diagnosed in Annual Rounds of CT Screening. AJR American journal of roentgenology. 2014:1–8. doi: 10.2214/AJR.13.12115. [DOI] [PubMed] [Google Scholar]
- 35.Kundel HL, Nodine CF, Carmody D. Visual scanning, pattern recognition and decision-making in pulmonary nodule detection. Investigative Radiology. 1978;13(3):175–81. doi: 10.1097/00004424-197805000-00001. [DOI] [PubMed] [Google Scholar]
- 36.Gamer M, Hecht H. Are you looking at me? Measuring the cone of gaze. Journal of experimental psychology Human perception and performance. 2007;33(3):705–15. doi: 10.1037/0096-1523.33.3.705. [DOI] [PubMed] [Google Scholar]
- 37.Kundel HL, Nodine CF, Thickman D, Toto L. Searching for lung nodules. A comparison of human performance with random and systematic scanning models. Investigative Radiology. 1987;22(5):417–22. doi: 10.1097/00004424-198705000-00010. [DOI] [PubMed] [Google Scholar]
- 38.Kundel HL, Nodine CF, Toto L. Searching for lung nodules. The guidance of visual scanning. Investigative Radiology. 1991;26(9):777–81. doi: 10.1097/00004424-199109000-00001. [DOI] [PubMed] [Google Scholar]
- 39.Drew T, Vo ML-H, Olwal A, Jacobson F, Seltzer SE, Wolfe JM. Scanners and drillers: characterizing expert visual search through volumetric images. Journal of vision. 2013;13(10) doi: 10.1167/13.10.3. [DOI] [PMC free article] [PubMed] [Google Scholar]
- 40.Andriole KP, Wolfe JM, Khorasani R, et al. Optimizing analysis, visualization, and navigation of large image data sets: one 5000-section CT scan can ruin your whole day. Radiology. 2011;259(2):346–62. doi: 10.1148/radiol.11091276. [DOI] [PMC free article] [PubMed] [Google Scholar]
- 41.Nodine CF, Kundel HL. Using eye movements to study visual search and to improve tumor detection. Radiographics: a review publication of the Radiological Society of North America, Inc. 1987;7(6):1241–50. doi: 10.1148/radiographics.7.6.3423330. [DOI] [PubMed] [Google Scholar]
- 42.Tillich M, Kammerhuber F, Reittner P, Riepl T, Stoeffler G, Szolar DH. Detection of pulmonary nodules with helical CT: comparison of cine and film-based viewing. AJR Am J Roentgenol. 1997;169(6):1611–4. doi: 10.2214/ajr.169.6.9393175. [DOI] [PubMed] [Google Scholar]
- 43.Rubin GD, Napel S, Leung AN. Volumetric analysis of volumetric data: achieving a paradigm shift. Radiology. 1996;200(2):312–7. doi: 10.1148/radiology.200.2.8685316. [DOI] [PubMed] [Google Scholar]
- 44.Wang XH, Durick JE, Lu A, et al. Characterization of radiologists’ search strategies for lung nodule detection: slice-based versus volumetric displays. Journal of Digital Imaging. 2008;21 (Suppl 1):S39–49. doi: 10.1007/s10278-007-9076-x. [DOI] [PMC free article] [PubMed] [Google Scholar]
- 45.Napel S, Rubin GD, Jeffrey RB., Jr STS-MIP: A new reconstruction technique for CT of the chest. J Comput Assist Tomogr. 1993;17(5):832–8. [PubMed] [Google Scholar]
- 46.Gruden JF, Ouanounou S, Tigges S, Norris SD, Klausner TS. Incremental benefit of maximum-intensity-projection images on observer detection of small pulmonary nodules revealed by multidetector CT. AJR American journal of roentgenology. 2002;179(1):149–57. doi: 10.2214/ajr.179.1.1790149. [DOI] [PubMed] [Google Scholar]
- 47.Valencia R, Denecke T, Lehmkuhl L, Fischbach F, Felix R, Knollmann F. Value of axial and coronal maximum intensity projection (MIP) images in the detection of pulmonary nodules by multislice spiral CT: comparison with axial 1-mm and 5-mm slices. European radiology. 2006;16(2):325–32. doi: 10.1007/s00330-005-2871-1. [DOI] [PubMed] [Google Scholar]
- 48.Scholten ET, Mali WPTM, Prokop M, et al. Non-solid lung nodules on low-dose computed tomography: comparison of detection rate between 3 visualization techniques. Cancer imaging: the official publication of the International Cancer Imaging Society. 2013;13:150–4. doi: 10.1102/1470-7330.2013.0016. [DOI] [PMC free article] [PubMed] [Google Scholar]
- 49.Peloschek P, Sailer J, Weber M, Herold CJ, Prokop M, Schaefer-Prokop C. Pulmonary nodules: sensitivity of maximum intensity projection versus that of volume rendering of 3D multidetector CT data. Radiology. 2007;243(2):561–9. doi: 10.1148/radiol.2432052052. [DOI] [PubMed] [Google Scholar]
- 50.Ko JP, Betke M. Chest CT: Automated Nodule Detection and Assessment of Change over Time—Preliminary Experience1. Radiology. 2001;218(1):267–73. doi: 10.1148/radiology.218.1.r01ja39267. [DOI] [PubMed] [Google Scholar]
- 51.Sun S, Rubin GD, Paik D, Steiner RM, Zhuge F, Napel S. Registration of lung nodules using a semi-rigid model: method and preliminary results. Medical Physics. 2007;34(2):613–26. doi: 10.1118/1.2432073. [DOI] [PubMed] [Google Scholar]
- 52.Lee KW, Kim M, Gierada DS, Bae KT. Performance of a computer-aided program for automated matching of metastatic pulmonary nodules detected on follow-up chest CT. AJR American journal of roentgenology. 2007;189(5):1077–81. doi: 10.2214/AJR.07.2057. [DOI] [PubMed] [Google Scholar]
- 53.Tao C, Gierada DS, Zhu F, Pilgram TK, Wang JH, Bae KT. Automated matching of pulmonary nodules: evaluation in serial screening chest CT. AJR American journal of roentgenology. 2009;192(3):624–8. doi: 10.2214/AJR.08.1307. [DOI] [PubMed] [Google Scholar]
- 54.Aoki T, Murakami S, Kim H, et al. Temporal subtraction method for lung nodule detection on successive thoracic CT soft-copy images. Radiology. 2014;271(1):255–61. doi: 10.1148/radiol.13130460. [DOI] [PubMed] [Google Scholar]
- 55.Armato SG, Li F, Giger ML, MacMahon H, Sone S, Doi K. Lung cancer: performance of automated lung nodule detection applied to cancers missed in a CT screening program. Radiology. 2002;225(3):685–92. doi: 10.1148/radiol.2253011376. [DOI] [PubMed] [Google Scholar]
- 56.Brown MS, Goldin JG, Rogers S, et al. Computer-aided Lung Nodule Detection in CT. Academic radiology. 2005;12(6):681–6. doi: 10.1016/j.acra.2005.02.041. [DOI] [PubMed] [Google Scholar]
- 57.Das M, Mühlenbruch G, Mahnken AH, et al. Small pulmonary nodules: effect of two computer-aided detection systems on radiologist performance. Radiology. 2006;241(2):564–71. doi: 10.1148/radiol.2412051139. [DOI] [PubMed] [Google Scholar]
- 58.White CS, Pugatch R, Koonce T, Rust SW, Dharaiya E. Lung nodule CAD software as a second reader: a multicenter study. Academic radiology. 2008;15(3):326–33. doi: 10.1016/j.acra.2007.09.027. [DOI] [PubMed] [Google Scholar]
- 59.Goldin JG, Brown MS, Petkovska I. Computer-aided diagnosis in lung nodule assessment. Journal of thoracic imaging. 2008;23(2):97–104. doi: 10.1097/RTI.0b013e318173dd1f. [DOI] [PubMed] [Google Scholar]
- 60.Sahiner B, Chan H-P, Hadjiiski LM, et al. Effect of CAD on radiologists' detection of lung nodules on thoracic CT scans: analysis of an observer performance study by nodule size. Academic radiology. 2009;16(12):1518–30. doi: 10.1016/j.acra.2009.08.006. [DOI] [PMC free article] [PubMed] [Google Scholar]
- 61.Fraioli F, Serra G, Passariello R. CAD (computed-aided detection) and CADx (computer aided diagnosis) systems in identifying and characterising lung nodules on chest CT: overview of research, developments and new prospects. La Radiologia medica. 2010;115(3):385–402. doi: 10.1007/s11547-010-0507-2. [DOI] [PubMed] [Google Scholar]
- 62.Christe A, Leidolt L, Huber A, et al. Lung cancer screening with CT: evaluation of radiologists and different computer assisted detection software (CAD) as first and second readers for lung nodule detection at different dose levels. European journal of radiology. 2013;82(12):e873–8. doi: 10.1016/j.ejrad.2013.08.026. [DOI] [PubMed] [Google Scholar]
- 63.Li Q, Li F, Doi K. Computerized Detection of Lung Nodules in Thin-Section CT Images by Use of Selective Enhancement Filters and an Automated Rule-Based Classifier. Academic radiology. 2008;15(2):165–75. doi: 10.1016/j.acra.2007.09.018. [DOI] [PMC free article] [PubMed] [Google Scholar]
- 64.Godoy MCB, Kim TJ, White CS, et al. Benefit of computer-aided detection analysis for the detection of subsolid and solid lung nodules on thin- and thick-section CT. AJR American journal of roentgenology. 2013;200(1):74–83. doi: 10.2214/AJR.11.7532. [DOI] [PubMed] [Google Scholar]
- 65.Jacobs C, van Rikxoort EM, Twellmann T, et al. Automatic detection of subsolid pulmonary nodules in thoracic computed tomography images. Medical image analysis. 2014;18(2):374–84. doi: 10.1016/j.media.2013.12.001. [DOI] [PubMed] [Google Scholar]
- 66.Jeon KN, Goo JM, Lee CH, et al. Computer-aided nodule detection and volumetry to reduce variability between radiologists in the interpretation of lung nodules at low-dose screening computed tomography. Investigative Radiology. 2012;47(8):457–61. doi: 10.1097/RLI.0b013e318250a5aa. [DOI] [PMC free article] [PubMed] [Google Scholar]
- 67.Matsumoto S, Ohno Y, Aoki T, et al. Computer-aided detection of lung nodules on multidetector CT in concurrent-reader and second-reader modes: a comparative study. European journal of radiology. 2013;82(8):1332–7. doi: 10.1016/j.ejrad.2013.02.005. [DOI] [PubMed] [Google Scholar]