The use of open arc cone-beam CT allowed all lesions to be depicted completely, and this facilitates the full potential of cone-beam CT for lesion detection and the evaluation of the technical success of therapy.
Abstract
Purpose
To compare liver coverage and tumor detectability by using preprocedural magnetic resonance (MR) images as a reference, as well as radiation exposure of cone-beam computed tomography (CT) with different rotational trajectories.
Materials and Methods
Fifteen patients (nine men and six women; mean age ± standard deviation, 65 years ± 5) with primary or secondary liver cancer were retrospectively included in this institutional review board–approved study. A modified cone-beam CT protocol was used in which the C-arm rotates from +55° to −185° (open arc cone-beam CT) instead of −120° to +120° (closed arc cone-beam CT). Each patient underwent two sessions of transarterial chemoembolization between February 2013 and March 2014 with closed arc and open arc cone-beam CT (during the first and second transarterial chemoembolization sessions, respectively, as part of the institutional transarterial chemoembolization protocol). For each cone-beam CT examination, liver volume and tumor detectability were assessed by using MR images as the reference. Radiation exposure was compared by means of a phantom study. For statistical analysis, paired t tests and a Wilcoxon signed rank test were performed.
Results
Mean liver volume imaged was 1695 cm3 ± 542 and 1857 cm3 ± 571 at closed arc and open arc cone-beam CT, respectively. The coverage of open arc cone-beam CT was significantly higher compared with closed arc cone-beam CT (97% vs 86% of the MR imaging liver volume, P = .002). In eight patients (53%), tumors were partially or completely outside the closed arc cone-beam CT field of view. All tumors were within the open arc cone-beam CT field of view. The open arc cone-beam CT radiation exposure by means of weighted CT index was slightly lower compared with that of closed arc cone-beam CT (−5.1%).
Conclusion
Open arc cone-beam CT allowed for a significantly improved intraprocedural depiction of peripheral hepatic tumors while achieving a slight radiation exposure reduction.
© RSNA, 2015
Online supplemental material is available for this article.
Introduction
Transarterial chemoembolization (TACE) is an important treatment modality for a number of primary and secondary liver malignancies (1–5). In the past decade, C-arm cone-beam computed tomography (CT) has become an indispensable part of TACE procedures for improved identification of tumors and their feeding arteries, as well as for the assessment of technical success of the procedure (6–12). In particular, cone-beam CT was shown to demonstrate tumors that were visible on preprocedural cross-sectional images but occult on digital subtraction angiography images and thus can lead to alteration of treatment strategy and procedure end point assessment (13–15). Additionally, the use of cone-beam CT was recently reported to prolong survival in patients with unresectable hepatocellular carcinoma (16). However, investigators in several studies on cone-beam CT concluded that the limited field of view (FOV) led to missed or only partially depicted tumors, especially in the lateral segments of the liver (17–19). This limitation might be especially relevant for obese patients with larger girth of the abdomen.
Current commercial solutions to increase the FOV include expanding the bore size (increasing the space between the tube and the detector), fusing images from two cone-beam CT scans (20), and using a larger detector (21). However, these solutions are implemented at the cost of increased radiation exposure and/or reduced image quality. Specifically, an increased bore size requires greater x-ray flux by the inverse-square law to have enough x-rays reach the detector. Similarly, a larger x-ray tube cone angle is required to sufficiently expose a larger detector, which again increases the radiation dose to the patient. Additionally, this solution increases the amount of scatter radiation, which degrades image quality. Fusing two offset rotation axis cone-beam CT scans by using software is a cost-efficient solution, since it does not require hardware modifications like the solutions mentioned previously. However, this requires two cone-beam CT scans and would double the radiation dose. Furthermore, fusing two three-dimensional (3D) volumetric data sets requires additional postprocessing that is time consuming and can introduce image artifacts.
Meyer et al reported a mean transversal liver diameter of approximately 22 cm, with a range of 15–28 cm (17). Thus, for most patients, the liver should fit into the 25-cm FOV provided by a standard cone-beam CT scanner. However, cone-beam CT data are currently obtained by rotating the C-arm more or less symmetrically around the patient’s spine, whereas the liver is offset in the body with predominant localization to the right side of the patient, resulting in frequent truncation of this organ. We hypothesized that an improved rotational trajectory could be a potential solution, by allowing for a wider translation of the angiographic table toward the left side of the patient, thus centering the liver in the FOV of the cone-beam CT volume. Two methods for testing this hypothesis were used, with preprocedural cross-sectional images as the reference: One objective method involved volumetric assessment of the liver volume covered by cone-beam CT, and one subjective method involved the assessment of liver tumors partially or completely outside the FOV.
The purpose of our study was to compare liver coverage and tumor detectability by using preprocedural magnetic resonance (MR) images as the reference, as well as radiation exposure of cone-beam CT with different rotational trajectories.
Materials and Methods
P.W., A.R., I.M.v.d.B., and M.L. are employees of Philips. J.F.H.G. is a grant recipient of Philips. The control of the data and the information submitted for publication were maintained by the remaining authors (R.E.S., J.C., S.S., R.D., and J.H.S.), who had no conflict of interest.
Study Cohort
This retrospective, single-institution study was conducted in compliance with the Health Insurance Portability and Accountability Act and was approved by the institutional review board. All procedures were performed on the same C-Arm system (Allura Xper FD20; Philips Healthcare, Best, the Netherlands), equipped with the XperCT module, enabling C-arm cone-beam CT acquisition and volumetric image reconstruction (22). In September 2013, an additional cone-beam CT protocol involving a different rotational trajectory was installed. The hardware of the C-arm system remained unchanged. Fifteen consecutive patients with primary or secondary liver cancer were retrospectively identified who underwent their first TACE procedure between February and September 2013, before the installation of the modified cone-beam CT protocol, and who underwent a second TACE procedure between September 2013 and March 2014, after the installation (a mean interval of 7 months between the procedures; range, 2–12 months). Baseline characteristics of the study group are summarized in Table 1.
Table 1.
Baseline Characteristics of the Study Group
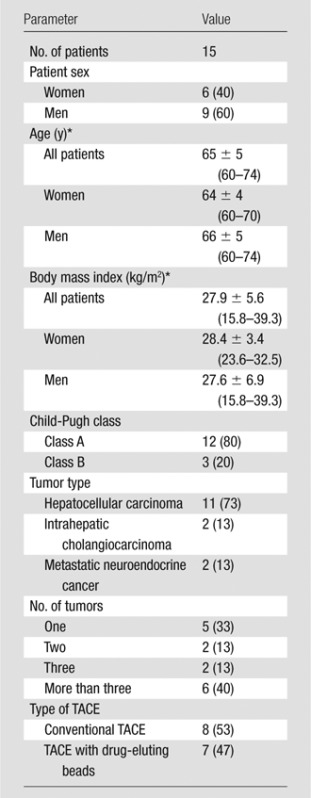
Note.—Except where indicated otherwise, data are numbers of patients, with percentages in parentheses.
*Data are means ± standard deviations, with ranges in parentheses.
MR Imaging Technique
All patients underwent MR imaging approximately 3 weeks (mean, 22 days; range, 0–62 days) before each TACE procedure on a 1.5-T MR imaging unit with a phased-array torso coil for signal reception (Magnetom Avanto; Siemens Medical Solutions, Forchheim, Germany). A standard liver protocol was performed, including axial T1-weighted 3D fat-suppressed spoiled gradient-echo images in the arterial, portal venous, and delayed phases (20, 70, and 180 seconds after administration of intravenous contrast material, respectively).
Cone-Beam CT Technique
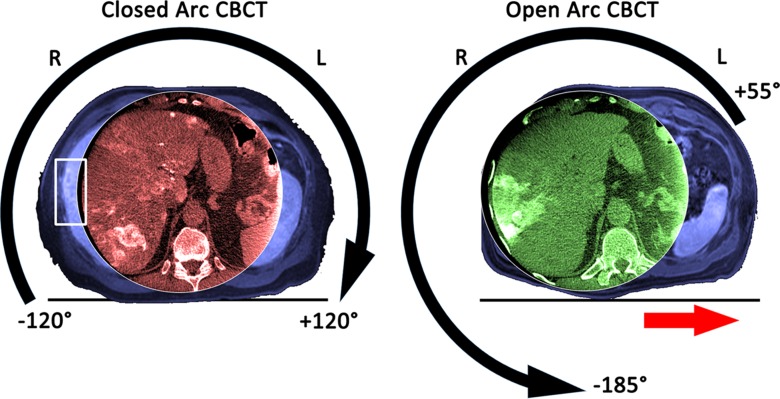
Each patient underwent two C-arm cone-beam CT acquisition sessions during a TACE procedure: one contrast material–enhanced dual-phase cone-beam CT acquisition (23) before delivery of chemoembolic agents (either drug-eluting beads or a mixture of ethiodized oil [Lipiodol; Guerbet, Villapinte, France], doxorubicin, and mitomycin C followed by bland beads) to confirm correct positioning of the microcatheter in the main tumor feeding branch of the hepatic artery and another unenhanced single-phase cone-beam CT acquisition right after drug delivery to confirm correct deposition of the chemotherapeutic and embolic agents. The liver was positioned as much as possible in the isocenter of the C-arm system without the patient or the table obstructing the C-arm rotation. The new cone-beam CT protocol changed the trajectory of the C-arm to rotate from +55° to −185° (open arc) instead of −120° to +120° (closed arc). This new protocol opens the arc to the left side of the patient and allows for a wider translation of the angiographic table toward this direction; thus, centering the liver in the FOV of the cone-beam CT volume becomes possible (Fig 1, Movie E1 [online]). For both protocols, the acquisition parameters were set to 120-kV tube voltage, 0.4-mm Cu filtration, 5–6-msec exposure time, and 250-mA tube current, the latter being modulated automatically during the acquisition to adjust for patient size. After implementation of our institutional protocol, the dual-phase cone-beam CT scans were triggered at 3 and 28 seconds after a single injection of 20 mL of undiluted contrast agent (Oxilan, 300 mg of iodine per milliliter; Guerbet) with a power injector (Medrad, Indianola, Pa) at a flow rate of 2 mL/sec and a pressure of 700 psi. The patients were instructed to perform a breath hold at end expiration during each of the cone-beam CT scans, with free breathing between the early and the delayed arterial phase scans. With the motorized C-arm covering a 240° clockwise arc at a rotation speed of up to 55° per second, 312 projection images (60 frames per second) were acquired in 5.2 seconds. On completion of the acquisition, the two-dimensional projections were automatically transferred to a dedicated workstation where 3D volumetric reconstructions were generated with an isotropic resolution of 0.6 mm, a FOV of 250 × 250 × 194 mm, and a matrix size of 384 × 384 × 296.
Figure 1:
Images in a 60-year-old man (body mass index, 29.7 kg/m2) with multiple neuroendocrine liver metastases in the liver who was treated twice with conventional TACE at our institution with an interval of 3 months between treatments. Both panels have orientation indicators and show the cone-beam CT (CBCT ) images acquired during closed arc (in red) and open arc (in green) cone-beam CT, respectively, and the corresponding preinterventional T1-weighted MR images (in blue) to visualize the FOV of the entire patient. The left panel shows the geometric motion of the C-arm with the detector as the reference during closed arc cone-beam CT. This geometric setup allowed only a limited movement of the table on the x-axis such that the FOV was centered on the spine rather than on the liver, resulting in a truncated depiction of the liver and some liver tumors being missed entirely (white box on the left panel). The right panel shows the geometric motion of the C-arm during open arc cone-beam CT. This geometric setup opens the rotation arch to the left side of the patient so that the procedure table can be moved left on the x-axis (red arrow on the right panel), allowing for better centering of the FOV on the liver.
Movie E1.
The first part of the video shows the rotation of the C-arm from −120° to +120° during closed arc cone-beam CT. This geometric setup allowed only a limited movement of the table on the x-axis such that the FOV cannot be placed off center. The second part of the video shows the rotation of the C-arm from +55° to −185° during open arc cone-beam CT. This geometric setup opens the rotation arc to the left side so that the procedure table can be moved left on the x-axis (red arrows), allowing for improved off-center placement of the FOV.
TACE Protocol
The indication for treatment and the choice of treatment modality were discussed at our multidisciplinary liver tumor board on a case-by-case basis. All TACE procedures were performed by the same interventional radiologist (J.F.H.G., with 18 years of experience in hepatic interventions) by using a standardized approach according to our institutional protocol (24). Briefly, access was gained in the common femoral artery by using the Seldinger technique. The celiac axis was then catheterized by using a 5-F Simmons-1 catheter (Cordis, Miami Lakes, Fla) through which a 2.8-F Renegade Hi-Flo microcatheter (Boston Scientific, Marlborough, Mass) was advanced coaxially. Several angiographic steps were performed to define the hepatic arterial anatomy to determine portal venous patency and tumor localization. Selective injection rates were adapted to the caliber of the blood vessels and ranged from 1 to 3 mL/sec. After confirmation of good microcatheter positioning, the drug payload was delivered. For conventional TACE (n = 8), ethiodized oil (Lipiodol; Guerbet) was mixed 1:1 with a solution that contained 50 mg of doxorubicin and 10 mg of mitomycin-C. The injection of that emulsion was followed by the administration of bland microspheres with a diameter of 100–300 μm (Embospheres; Merit Medical, South Jordan, Utah). For TACE with drug-eluting beads (n = 7), a 4-mL solution of DC Beads (Biocompatibles/BTG, Surrey, United Kingdom) with a diameter of 100–300 μm was loaded with 100 mg of doxorubicin hydrochloride (25 mg/mL) and mixed with 4 mL of Oxilan (Guerbet). For both TACE modalities, the technical end point was substantial flow reduction within the arterial supply of the tumor, while avoiding complete occlusion to maintain arterial patency for repeat treatment and prevent nontargeted reflux into healthy tissue.
Volumetric Analysis of the Liver
Liver segmentation was performed on both MR images and cone-beam CT images by an interventional radiologist with 7 years of experience (R.E.S.) who did not participate in the TACE procedures. Dedicated 3D semiautomatic prototype software (Medisys; Philips Research, Suresnes, France) involving non-Euclidean geometry and theory of radial basis functions was used on T1-weighted portal venous MR images and delayed arterial phase cone-beam CT images to automatically create a 3D segmentation mask (25). The software allows for interactive adjustments, yielding the nomenclature “semi-automatic,” by using two steps. In the first step, the user interactively expands or contracts the 3D mask around control points defined by the user (balloon mode). In the second step, the user sets control points on the border of the liver, which will grow or shrink the pre-existing segmentation mask automatically (contour point algorithm). With the 3D nature of the segmentation, the liver volume can be directly calculated. In the case of incomplete liver depiction on cone-beam CT images, only the visible liver volume was segmented.
Liver Tumor Depiction
Axial cone-beam CT images from both acquisition techniques were evaluated by an interventional radiologist (R.E.S.) and a radiology resident with 2 years of experience in liver MR imaging (J.C.) independently of each other. An ordinal scale was defined with regard to missed or partially depicted target tumors, by using the corresponding preinterventional contrast-enhanced MR images as a side-by-side reference. The ordinal scale was based on the clinical relevance of partial and complete tumor depiction on cone-beam CT images for intraprocedural guidance and 3D volumetric response assessment. If all liver tumors seen on the corresponding MR images were inside the cone-beam CT FOV, the cone-beam CT images could be used for guidance and response assessment (score of 1). If one of the tumors was partially outside the cone-beam CT FOV, the cone-beam CT images could be used for guidance but not for response assessment (score of 2). If one of the tumors was completely outside the cone-beam CT FOV, the cone-beam CT images could not be used for guidance or for response assessment (score of 3).
Radiation Exposure Measurements
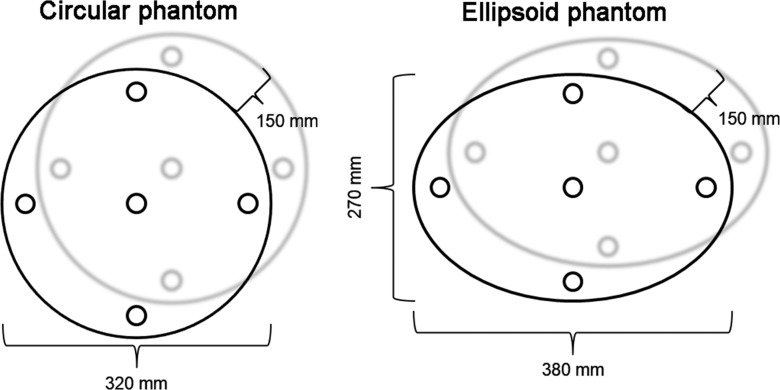
Because of the retrospective design of the study, only the cumulative dose of the entire procedure was available, not detailed dose information for cone-beam CT specifically. Thus, dose measurements were performed on two different phantoms made of poly(methyl methacrylate). A Raysafe ×2 system (Unfors RaySafe AB, Billdal, Sweden) with a CT dose index (CTDI) probe was used, which needs to be recalibrated once a year, and was calibrated 2 days before. The phantoms were placed on the center of the examination table, including a circular CTDI phantom with a diameter of 320 mm and a modified CTDI phantom with an ellipsoid shape with long and short diameters of 380 and 270 mm that better mimics the human body (26). Both phantoms had a depth of 150 mm and five measurement holes, 12.5 mm in diameter each, that reached the middle of the phantom along the z-axis. One measurement hole was in the center of the phantom; the four remaining measurement holes were symmetrically placed in the periphery (top, bottom, left, and right), 10 mm from the phantom edge (Fig 2). Open and closed arc cone-beam CT dose was measured three times at all five locations while the unused holes were filled with poly(methyl methacrylate) rods. Weighted CTDI (CTDIw in the following equation) was calculated as follows (27):
Figure 2:
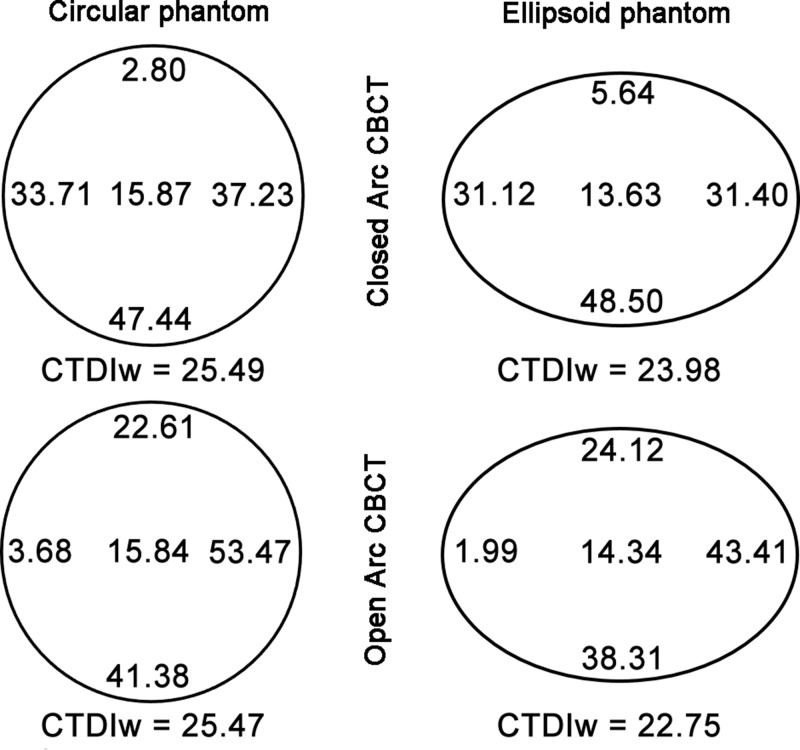
Schematic of the circular and ellipsoid phantoms used for radiation exposure measurements.
Statistical Analysis
All statistical computations were performed in SPSS Statistics version 22 (IBM, Armonk, NY). A P value less than .05 was considered to indicate a statistically significant difference. Descriptive statistics were performed to summarize the data. After normal distribution was confirmed with the Shapiro-Wilk test, liver volumes were expressed as means, standard deviations, and ranges and compared by using the paired t tests. For tumor detectability rating, count and percentage were used and a Wilcoxon signed rank test was performed. Spearman ρ was used to calculate interobserver variability. Means and standard deviations were calculated for radiation exposures measured, and paired t tests were performed for comparison.
Results
Volumetric Analysis of the Liver
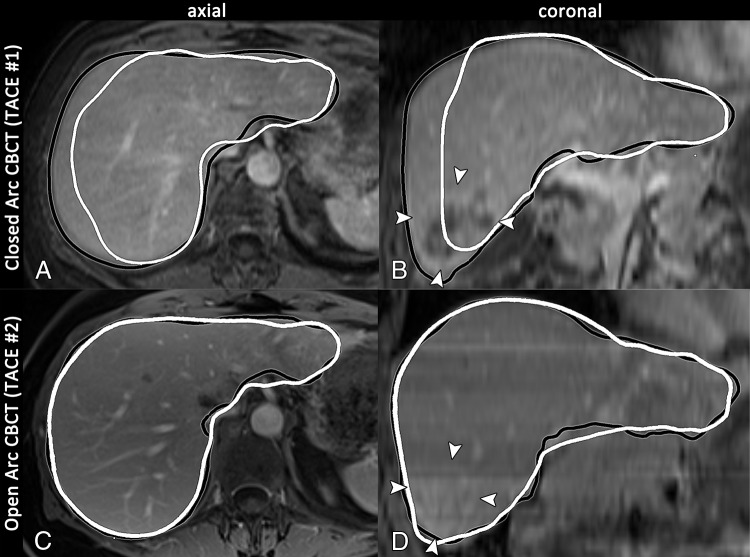
The mean liver volume measured on the first and second series of MR images was 1973.4 cm3 ± 633.3 and 1926.5 cm3 ± 632.7, respectively (range, 1189.5–3197.1 cm3 and 1024.9–3275.9 cm3, respectively). Although some of the livers showed growth or shrinkage over time, related to either disease progression or treatment response, there was no significant difference in liver volume between the first and the second series of MR images (P = .611). The mean liver volume recorded by using closed arc cone-beam CT was 1695.3 cm3 ± 542.5 (range, 944.2–2807.3 cm3). On average, 86% of the liver volume that was measured on the pretreatment MR images was depicted on closed arc cone-beam CT images. The mean liver volume recorded by using open arc cone-beam CT was 1855.1 cm3 ± 568.0 (range, 1022.8–2877.4 cm3) and showed that on average, 97% of the liver volume measured on the corresponding pretreatment MR images could be visualized (Fig 3). The difference in liver volume coverage (11%) between closed and open arc cone-beam CT was statistically significant (P = .001). Detailed measurements for each patient are shown in Table 2.
Figure 3:
A, C, Axial and, B, D, coronal images in a 69-year-old woman with intrahepatic mass-forming cholangiocarcinoma in segment 6 (arrowheads on B and D) who was treated with conventional TACE twice at our institution. The preprocedural T1-weighted MR images are shown with the intraprocedural cone-beam CT (CBCT ) liver perimeter overlay, where the black and white outlines indicate the liver segmentation based on MR and intraprocedural cone-beam CT images, respectively. A, B, Baseline MR images and closed arc cone-beam CT images are shown, and C, D, follow-up MR images and open arc cone-beam CT images are shown. Closed arc cone-beam CT was unable to demonstrate the outer parts of the liver (only 85.4% depiction) and failed to show the entire tumor (arrowheads on B), whereas open arc cone-beam CT covered the complete liver volume and depicted the entire tumor (arrowheads on D).
Table 2.
Liver Volumes as Measured on Cone-Beam CT Images and the Corresponding MR Images
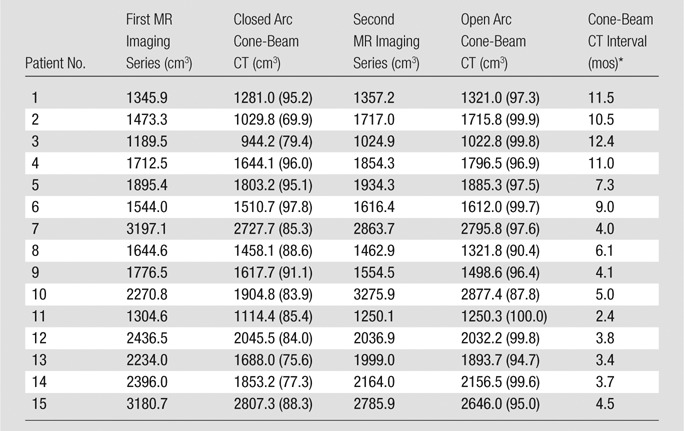
Note.—Except where indicated otherwise, data are liver volumes, and numbers in parentheses are the percentage of liver coverage of cone-beam CT, calculated by dividing the liver volume on cone-beam CT images by the liver volume on the corresponding MR images and multiplying by 100%.
*Data are the intervals between cone-beam CT acquisitions.
Liver Tumor Depiction
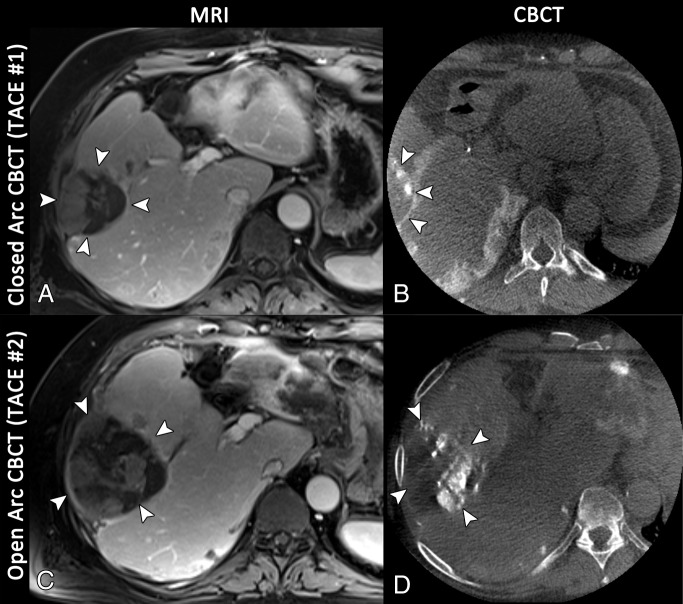
Both readers reported independently the same rating for each patient and cone-beam CT method, respectively, with regard to tumor depiction, resulting in a correlation coefficient of 1.0 (P < .001). In seven patients (47%), the closed arc cone-beam CT images were rated as having a score of 1 (all tumors within the FOV), whereas scores of 2 and 3 were assigned to images in three (20%) and five (33%) patients, respectively. Open arc cone-beam CT was significantly better, as all tumors in the 15 patients were within the FOV (P = .009) (Fig 4).
Figure 4:
Axial images in a 72-year-old man with multifocal hepatocellular carcinoma, with the index lesion in segment 6. A, Baseline T1-weighted MR image acquired in the portal venous phase shows the index lesion in segment 6 (arrowheads). B, Reconstruction of the closed arc cone-beam CT (CBCT ) data acquired during the first conventional TACE procedure depicts the tumor only to a limited extent (arrowheads), owing to suboptimal centering of the FOV. C, Follow-up MR image acquired 4 months later demonstrates extensive growth of the tumor (arrowheads); the patient was referred for another cycle of conventional TACE. D, Even though the tumor has grown, the axial reconstruction of the open arc cone-beam CT data from the intraprocedural imaging depicts the complete tumor (arrowheads).
Radiation Exposure Measurements
The weighted CTDI for closed and open arc cone-beam CT was 25.49 mGy ± 0.02 and 25.47 mGy ± 0.01, respectively, by using the circular phantom and 23.98 mGy ± 0.02 and 22.75 mGy ± 0.05, respectively, by using the ellipsoid phantom. In other words, the circular phantom did not yield a significant difference in radiation exposure between closed and open arc cone-beam CT (P = .227), whereas the radiation exposure measured in the ellipsoid phantom was 5.1% lower (1.2 mGy) during open arc cone-beam CT compared with closed arc cone-beam CT, which was significant (P < .001). Of note, by switching from closed arc to open arc cone-beam CT, the radiation exposure significantly decreased on the right and bottom side of the phantom and increased on the top and left side of the phantom (P < .001 for all four sides; Fig 5).
Figure 5:
Diagram of mean x-ray exposure (in milligrays) at each probe position in the circular (left) and ellipsoid (right) phantoms during closed and open arc cone-beam CT (CBCT), respectively. For the circular phantom, weighted CTDI (CTDIw) was similar for both closed and open arc cone-beam CT, whereas for the ellipsoid phantom, weighted CTDI was slightly lower during open arc cone-beam CT.
Discussion
The main finding of our study was that open arc cone-beam CT significantly increased the imaging coverage of the liver volume. This confirms that a more complete depiction of the liver is possible without changing the size of the FOV; rather, it is achieved by improving the positioning of the liver in the cone-beam CT FOV. This was attained without any hardware changes by modifying only software so that the geometric motion of the C-arm can have a wider lateral translation of the angiographic table and off-center cone-beam CT acquisition.
In contrast to previously described techniques to increase the liver coverage during cone-beam CT (20,21), open arc cone-beam CT did not lead to an increase in radiation exposure. The measurements conducted on an ellipsoid phantom in our study show a slight decrease in radiation exposure. This can be explained by the fact that the transverse diameter, given the ellipsoid shape of the body, is the greatest x-ray path length and where the automatic tube current modulation is tuned to the highest x-ray flux. This transverse diameter of the phantom is swept only once by the x-ray tube and detector during open arc cone-beam CT but twice during closed arc cone-beam CT. This slight reduction in radiation exposure during cone-beam CT is even more important in recent C-arm machines that offer significant radiation exposure reduction during two-dimensional imaging, such as fluoroscopy and digital subtraction angiography, and so the contribution of cone-beam CT to the cumulative radiation exposure of a procedure is increased (28). Additionally, the radiation exposure by using open arc cone-beam CT significantly decreased at the bottom of both phantoms, which anatomically would be the back of the patient, and this mimics the position of the x-ray tube during fluoroscopy and digital subtraction angiography, where the highest skin dose is normally observed.
Investigators in several studies on tumor detectability at cone-beam CT reported 11%–12% of tumors being outside of the cone-beam CT FOV (10,19). Our study showed a higher percentage of tumors partially or completely outside of the closed arc cone-beam CT FOV, (20% and 33% of the patients, respectively). However, one of the previously mentioned studies included only patients with fewer than four hepatocellular carcinoma tumors (19), whereas 40% of the patients in our study had more than three tumors. Another factor for this difference could be the small number of patients in both our study and one mentioned previously (10). The complete depiction of an intrahepatic tumor and its feeding arteries is desirable to optimize the placement of the microcatheter before delivery of the chemoembolic agents. The use of open arc cone-beam CT allowed all tumors to be depicted completely, which facilitates the full potential of cone-beam CT for tumor detection and in the evaluation of the technical success of therapy.
A limitation of this feasibility study is the small number of patients. The small sample size could limit the generalizability of our results to the patient population suitable for TACE with regard to the number of peripheral hepatic tumors being better depicted. However, the liver sizes in this small study cohort covered a wide range. Thus, the results for improved liver coverage should be similar for other patients. Additionally, the intraindividual comparison had the substantial advantage of avoiding bias due to differences between two subcohorts, as in a two-arm trial. The possibility of intraindividual comparison of both cone-beam CT techniques and the corresponding MR images was of great benefit, especially for the volumetric assessment of the liver in our study. This was supported by the similarity of liver volumes measured on MR images before and after the first TACE procedure, with no significant differences observed. Another limitation was that this technique was evaluated by using only one C-arm system vendor, since the other vendors, to the authors’ knowledge, do not have such solutions. However, the change of the rotational trajectory should be applicable to C-arm systems from other vendors. Additionally, because of the retrospective design of the study, the setup time for cone-beam CT acquisition, as well as the effect of open arc cone-beam CT on catheter positioning and treatment end point, was not recorded. These could be evaluated in a future prospective study. The wider translation of the angiographic table may ease the workflow for cone-beam CT acquisition by reducing collisions (between the C-arm and the procedure table or the patient) and the need for patient repositioning, thus shortening setup time. Further validation of the results and benefits of open arc cone-beam CT in terms of procedure workflow, as well as patient outcome in a larger trial, are recommended.
In conclusion, open arc cone-beam CT allowed for a significantly improved intraprocedural depiction of peripheral hepatic tumors while achieving a slight radiation exposure reduction.
Advance in Knowledge
■ Modification of the rotational trajectory of the C-arm allows for advanced off-center positioning of the patient table to facilitate better centering of the liver in the cone-beam CT field of view, resulting in a significantly increased coverage of the liver volume (97% vs 86%, P = .001).
Implications for Patient Care
■ Complete coverage of the liver during cone-beam CT imaging allows for improved depiction of peripheral hepatic tumors, which is essential for intraprocedural quantitative response assessment based on cone-beam CT images.
■ No increase in radiation exposure is necessary to improve the liver coverage; in fact, a slight decrease in radiation exposure can be achieved.
Acknowledgments
Acknowledgments
The authors thank Jeffrey Baker, RT(R), for his contribution to the acquisition of open arc cone-beam CT and William van der Sterren, PhD, for his contribution to the phantom measurements.
Received December 10, 2014; revision requested February 3, 2015; revision received February 16; accepted February 26; final version accepted March 17.
Supported by the Max Kade Foundation, New York, NY, and Philips Research North America, Briarcliff Manor, NY.
Funding: This research was supported by the National Institutes of Health (grants R01 CA160771 and P30 CA006973).
Disclosures of Conflicts of Interest: R.E.S. Activities related to the present article: author received a grant from the Max Kade Foundation. Activities not related to the present article: disclosed no relevant relationships. Other relationships: disclosed no relevant relationships. J.C. disclosed no relevant relationships. S.S. disclosed no relevant relationships. P.W. disclosed no relevant relationships. R.D. disclosed no relevant relationships. J.H.S. disclosed no relevant relationships. A.R. Activities related to the present article: author is an employee of Philips. Activities not related to the present article: disclosed no relevant relationships. Other relationships: disclosed no relevant relationships. I.M.v.d.B. Activities related to the present article: author is an employee of Philips. Activities not related to the present article: disclosed no relevant relationships. Other relationships: disclosed no relevant relationships. J.F.H.G. Activities related to the present article: author received a grant from Philips Research North America. Activities not related to the present article: author received payment from Nordion, Biocompatibles/BTG, and Bayer Healthcare for consulting; author received grants from Bayer Healthcare, DOB, Biocompatibles/BTG, Bayer Healthcare, Nordion, Context Vision, and Guerbet. Other relationships: disclosed no relevant relationships. M.L. Activities related to the present article: author is an employee of Philips. Activities not related to the present article: disclosed no relevant relationships. Other relationships: disclosed no relevant relationships.
Abbreviations:
- CTDI
- CT dose index
- FOV
- field of view
- TACE
- transarterial chemoembolization
- 3D
- three-dimensional
References
- 1.Sato T. Locoregional management of hepatic metastasis from primary uveal melanoma. Semin Oncol 2010;37(2):127–138. [DOI] [PubMed] [Google Scholar]
- 2.Lencioni R, Petruzzi P, Crocetti L. Chemoembolization of hepatocellular carcinoma. Semin Intervent Radiol 2013;30(1):3–11. [DOI] [PMC free article] [PubMed] [Google Scholar]
- 3.Kuhlmann JB, Blum HE. Locoregional therapy for cholangiocarcinoma. Curr Opin Gastroenterol 2013;29(3):324–328. [DOI] [PubMed] [Google Scholar]
- 4.Fiorentini G, Aliberti C, Mulazzani L, et al. Chemoembolization in colorectal liver metastases: the rebirth. Anticancer Res 2014;34(2):575–584. [PubMed] [Google Scholar]
- 5.Del Prete M, Fiore F, Modica R, et al. Hepatic arterial embolization in patients with neuroendocrine tumors. J Exp Clin Cancer Res 2014;33(1):43. [DOI] [PMC free article] [PubMed] [Google Scholar]
- 6.Hirota S, Nakao N, Yamamoto S, et al. Cone-beam CT with flat-panel-detector digital angiography system: early experience in abdominal interventional procedures. Cardiovasc Intervent Radiol 2006;29(6):1034–1038. [DOI] [PubMed] [Google Scholar]
- 7.Loffroy R, Lin M, Rao P, et al. Comparing the detectability of hepatocellular carcinoma by C-arm dual-phase cone-beam computed tomography during hepatic arteriography with conventional contrast-enhanced magnetic resonance imaging. Cardiovasc Intervent Radiol 2012;35(1):97–104. [DOI] [PubMed] [Google Scholar]
- 8.Loffroy R, Lin M, Yenokyan G, et al. Intraprocedural C-arm dual-phase cone-beam CT: can it be used to predict short-term response to TACE with drug-eluting beads in patients with hepatocellular carcinoma? Radiology 2013;266(2):636–648. [DOI] [PMC free article] [PubMed] [Google Scholar]
- 9.Wang Z, Lin M, Lesage D, et al. Three-dimensional evaluation of lipiodol retention in HCC after chemoembolization: a quantitative comparison between CBCT and MDCT. Acad Radiol 2014;21(3):393–399. [DOI] [PMC free article] [PubMed] [Google Scholar]
- 10.Schernthaner RE, Lin M, Duran R, Chapiro J, Wang Z, Geschwind JF. Delayed-phase cone-beam CT improves detectability of intrahepatic cholangiocarcinoma during conventional transarterial chemoembolization. Cardiovasc Intervent Radiol 2014 Dec 5. [Epub ahead of print] [DOI] [PMC free article] [PubMed] [Google Scholar]
- 11.Suk Oh J, Jong Chun H, Gil Choi B, Giu Lee H. Transarterial chemoembolization with drug-eluting beads in hepatocellular carcinoma: usefulness of contrast saturation features on cone-beam computed tomography imaging for predicting short-term tumor response. J Vasc Interv Radiol 2013;24(4):483–489. [DOI] [PubMed] [Google Scholar]
- 12.Tacher V, Radaelli A, Lin M, Geschwind JF. How I do it: cone-beam CT during transarterial chemoembolization for liver cancer. Radiology 2015;274(2):320–334. [DOI] [PMC free article] [PubMed] [Google Scholar]
- 13.Wallace MJ, Murthy R, Kamat PP, et al. Impact of C-arm CT on hepatic arterial interventions for hepatic malignancies. J Vasc Interv Radiol 2007;18(12):1500–1507. [DOI] [PubMed] [Google Scholar]
- 14.Miyayama S, Yamashiro M, Okuda M, et al. Usefulness of cone-beam computed tomography during ultraselective transcatheter arterial chemoembolization for small hepatocellular carcinomas that cannot be demonstrated on angiography. Cardiovasc Intervent Radiol 2009;32(2):255–264. [DOI] [PubMed] [Google Scholar]
- 15.Tognolini A, Louie JD, Hwang GL, Hofmann LV, Sze DY, Kothary N. Utility of C-arm CT in patients with hepatocellular carcinoma undergoing transhepatic arterial chemoembolization. J Vasc Interv Radiol 2010;21(3):339–347. [DOI] [PubMed] [Google Scholar]
- 16.Iwazawa J, Ohue S, Hashimoto N, Muramoto O, Mitani T. Survival after C-arm CT-assisted chemoembolization of unresectable hepatocellular carcinoma. Eur J Radiol 2012;81(12):3985–3992. [DOI] [PubMed] [Google Scholar]
- 17.Meyer BC, Frericks BB, Voges M, et al. Visualization of hypervascular liver lesions During TACE: comparison of angiographic C-arm CT and MDCT. AJR Am J Roentgenol 2008;190(4):W263–W269. [DOI] [PubMed] [Google Scholar]
- 18.Lee IJ, Chung JW, Yin YH, et al. Cone-beam CT hepatic arteriography in chemoembolization for hepatocellular carcinoma: angiographic image quality and its determining factors. J Vasc Interv Radiol 2014;25(9):1369–1379; quiz 1379, e1. [DOI] [PubMed] [Google Scholar]
- 19.Miyayama S, Matsui O, Yamashiro M, et al. Detection of hepatocellular carcinoma by CT during arterial portography using a cone-beam CT technology: comparison with conventional CTAP. Abdom Imaging 2009;34(4):502–506. [DOI] [PubMed] [Google Scholar]
- 20.Strobel N, Meissner O, Boese J, et al. 3D imaging with flat-detector C-arm systems. In: Reiser M, ed. Multislice CT. 3rd ed. Berlin, Germany: Springer, 2009; 33–52. [Google Scholar]
- 21.Discovery IGS. 740. GE Healthcare. Web site. Accessed September 3, 2014.
- 22.Feldkamp L, Davis L, Kress J. Practical cone-beam algorithms. J Opt Soc Am A 1984;1(6):612–619. [Google Scholar]
- 23.Lin M, Loffroy R, Noordhoek N, et al. Evaluating tumors in transcatheter arterial chemoembolization (TACE) using dual-phase cone-beam CT. Minim Invasive Ther Allied Technol 2011;20(5):276–281. [DOI] [PMC free article] [PubMed] [Google Scholar]
- 24.Liapi E, Geschwind JF. Transcatheter arterial chemoembolization for liver cancer: Is it time to distinguish conventional from drug-eluting chemoembolization? Cardiovasc Intervent Radiol 2011;34(1):37–49. [DOI] [PMC free article] [PubMed] [Google Scholar]
- 25.Chapiro J, Lin M, Duran R, Schernthaner RE, Geschwind JF. Assessing tumor response after loco-regional liver cancer therapies: the role of 3D MRI. Expert Rev Anticancer Ther 2015;15(2):199–205. [DOI] [PMC free article] [PubMed] [Google Scholar]
- 26.Sookpeng S, Martin CJ, Gentle DJ. A study of CT dose distribution in an elliptical phantom and the influence of automatic tube current modulation in the x-y plane. J Radiol Prot 2013;33(2):461–483. [DOI] [PubMed] [Google Scholar]
- 27.Jessen KA, Shrimpton PC, Geleijns J, Panzer W, Tosi G. Dosimetry for optimisation of patient protection in computed tomography. Appl Radiat Isot 1999;50(1):165–172. [DOI] [PubMed] [Google Scholar]
- 28.Schernthaner RE, Duran R, Chapiro J, Wang Z, Geschwind JF, Lin M. A new angiographic imaging platform reduces radiation exposure for patients with liver cancer treated with transarterial chemoembolization. Eur Radiol. In press.2015. [DOI] [PMC free article] [PubMed]


