Abstract
Objective
To validate estimated tumour volumetry in primary gastric gastrointestinal stromal tumours (GISTs) using semi-automated volumetry.
Materials and Methods
In this IRB-approved retrospective study, we measured the three longest diameters in x, y, z axes on CTs of primary gastric GISTs in 127 consecutive patients (52 women, 75 men, mean age: 61 years) at our institute between 2000 and 2013. Segmented volumes (Vsegmented) were obtained using commercial software by two radiologists. Estimate volumes (V1–V6) were obtained using formulae for spheres and ellipsoids. Intra- and inter-observer agreement of Vsegmented and agreement of V1–6 with Vsegmented were analysed with concordance correlation coefficients (CCC) and Bland-Altman plots.
Results
Median Vsegmented and V1–V6 were 75.9 cm3, 124.9 cm3, 111.6 cm3, 94.0 cm3, 94.4cm3, 61.7 cm3 and 80.3 cm3 respectively. There was strong intra- and inter-observer agreement for Vsegmented. Agreement with Vsegmented was highest for V6 (scalene ellipsoid, x≠y≠z), with CCC of 0.96 [95%CI: 0.95–0.97]. Mean relative difference was smallest for V6 (0.6%), while it was −19.1% for V5, +14.5% for V4, +17.9% for V3, +32.6 % for V2 and +47% for V1.
Conclusion
Ellipsoidal approximations of volume using three measured axes may be used to closely estimate Vsegmented when semi-automated techniques are unavailable.
Keywords: Gastrointestinal stromal tumour, estimated volumtery, sphere, ellipsoid, RECIST
Introduction
With up to 5000 new cases diagnosed each year in the United States, gastrointestinal stromal tumour (GIST) is the most common mesenchymal tumour of the gastrointestinal tract [1; 2]. The stomach is the most common site of GIST with up to 60% of GISTs occurring in this location [3]. The biologic behaviour of GIST is predicted by certain morphological characteristics. A risk stratification model based on morphologic parameters is widely used for determining treatment strategies and prognosis of GISTs [4; 5; 6]. GISTs are stratified into very low-risk, low-risk, intermediate-risk and high-risk categories in this model based on origin (stomach, duodenum, jejunum/ileum and rectum), size (≤2 cm, >2 to ≤5 cm, >5cm to ≤ 10 cm and >10cm) and mitotic index (≤5 or > 5 per 50 hpf)[7]. Of the three parameters used in this model, tumour size and site can be determined preoperatively on imaging. The size in the risk assessment of GISTs refers to the single largest dimension. Given that GISTs are usually irregular tumours, it is not difficult to imagine that using a single dimension is an oversimplification of the anatomic complexity of GISTs.
Imaging plays a key role in treatment response assessment by depicting changes in tumour size. The number of tumour cells is better represented by tumour volume rather than linear dimensions especially for tumours which are irregular in shape [8]. Volumetric assessment of tumours is therefore considered a better biomarker for treatment response than linear measurements like those used in World Health Organization (WHO) and Response Evaluation Criteria In Solid Tumors (RECIST) guidelines [8]. These traditional guidelines assume tumours to be spherical making them unreliable for nonspherical tumours. There is evidence to suggest that 3D volumetry performs better in the assessment of treatment response when compared to linear measurements, especially when the tumours are assumed to be ellipsoid rather than spherical, and has less inter-observer variability [9; 10; 11; 12; 13; 14; 15]. Recent advances in image analysis software have enabled evaluation of the advantages of 3-dimensional (3D) measurements over one-dimensional (1D) measurements in assessing changes in tumour size. Several studies have shown the value of tumour volumetry in head and neck cancers, lung cancer, rectal cancer, Ewing sarcoma, rhabdomyosarcoma, metastatic colorectal cancer and metastatic GIST [9; 10; 12; 16; 17; 18; 19; 20; 21; 22; 23; 24; 25]. Within the abdomen, most studies have assessed only rectal cancer, liver metastasis, lymph nodes and peritoneal lesions [13; 18; 19; 20; 24; 25; 26; 27; 28]. Experience with tumour volumetry in primary malignant abdominopelvic tumours other than rectal cancer has been limited.
Volumetric analysis has been performed in several prior studies using commercially available software. This software may not be widely available, needs user experience and can be time-consuming. On the other hand, using mathematical formulae for spheres and ellipsoids to calculate tumour volume can be feasible where automated software is not available, can be less time-consuming, and help standardization of volume criteria by decreasing operator dependence. Few studies especially in the setting of liver metastases have shown that volume can be estimated with mathematical formulae using the linear measurements obtained from cross-sectional imaging [19; 29]. In an earlier study from our institute, we used estimated volumes calculated from the mathematical formula for ellipsoids to assess response of primary GIST to neoadjuvant imatinib [5], but the accuracy of those volume estimates compared to true tumour volumes was not evaluated. Accordingly, the purpose of this research was to evaluate the accuracy and feasibility of estimated tumour volumetry (volume estimated using mathematical formulae) at presentation in a homogeneous cohort of gastric GISTs seen at a single institute.
Materials and Methods
Subjects
This Health Insurance Portability and Accountability Act-compliant retrospective study was approved by our institutional review board with waiver for informed consent. We included all 127 consecutive patients (52 women, 75 men, mean age: 61 years, range: 23 – 89 years) with a diagnosis of gastric GIST and with imaging of the primary tumour who were referred to or primarily treated at our institute between January, 2000 and December, 2013. The histopathology of all these patients was reviewed at our institute as part of routine oncology care to confirm the diagnosis of gastric GIST.
Imaging
The CT images of 59 patients (47%) were performed at our institute on multidetector scanners namely four-slice (GE Healthcare, Barrington, IL, USA), 16-row (Siemens Medical Solutions, Forchheim, Germany), and 64-row (Toshiba America Medical Systems, Tustin, CA, USA) MDCT systems with 0.5 mm collimation, 120 kVp, 500 mA (max), gantry rotation time 0.5 s, table speed of 26.5 mm/rotation) using standard abdominal algorithm with 5 mm axial and 4mm coronal reconstructions. The remaining 68 patients (53%) were referred to our institute with CT performed at outside hospitals. These patients had adequate diagnostic quality images with 5 mm axial reconstructions which were uploaded to our radiology Picture Archiving and Communication System (PACS). The images were obtained after intravenous administration of iodinated contrast in the portal venous phase in 115 patients while 12 patients did not receive intravenous contrast. Oral contrast was administered in 114 patients (negative oral contrast in four patients) with adequate gastric distension in 106 patients.
The images were reviewed by two radiologists (ST and NHR) with 9 and 14 years of experience in radiology, respectively, in consensus on a workstation (Centricity PACS RA1000; GE Healthcare, Barrington, IL) to obtain the longest transverse, anteroposterior and craniocaudal dimensions (cm) aligned to the tumour in the x, y and z axes. The craniocaudal dimension was measured either on coronal images when available or was calculated by multiplying the number of slices on which the tumour was seen by the slice thickness. The three dimensions were then arranged in a descending order and labelled as d1>d2> d3. The tumours were stratified according to the cut-offs for traditional risk stratification using the longest diameter (≤2 cm, >2 to ≤5 cm, >5cm to ≤ 10 cm and >10cm).
Semi-automated tumour volumetry
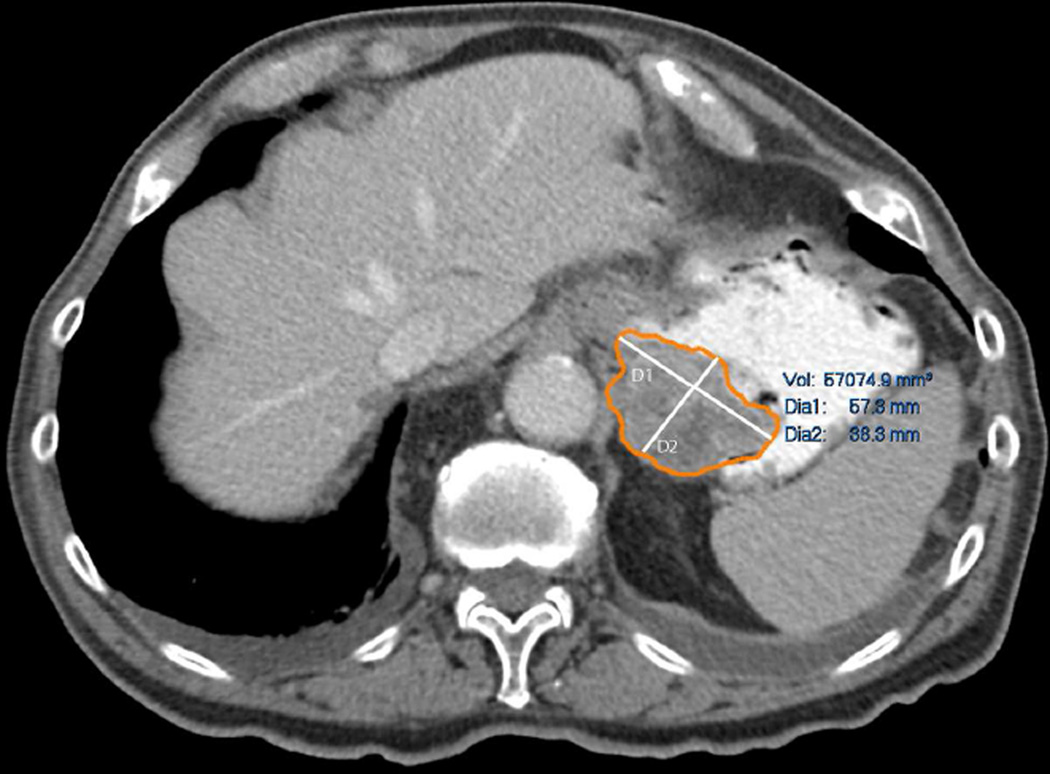
For semi-automated tumour volumetry, the axial datasets were transferred to commercially available software (Carestream Vue PACS Lesions Management, Carestream Health, Inc., NY). The technique of segmentation involved drawing free hand regions of interest (ROI) around the margins of the tumour on three or more axial slices, then the software automatically segmented the rest of the tumour and provided the measured volume of the tumour (Vsegmented) (Fig 1). Manual correction after the segmentation was performed when the tumour was over or under segmented. Two radiologists with 9 and 5 years of experience in radiology: radiologist 1 (ST) and radiologist 2 (ACO), respectively, segmented the tumours semi-automatically on the software in different sessions to ensure intra- and inter-observer agreement and increase the robustness of the Vsegmented. Radiologist 1 performed the segmentation of the tumours in a random patient order two times one month apart to assess intraobserver variability. Radiologist 2 performed the segmentation once in a random patient order to assess inter-observer variability. For each patient, the average of the three readings was taken as the Vsegmented.
Fig 1.
Technique of semi-automated tumour segmentation.
Estimated tumour volume
The mathematical formula for volume estimation is 4/3*π*x*y*z /8, where x, y and z represent diameters in the x, y and z axes. Tumour volumes can be calculated by substituting the x, y and z diameters with linear dimensions to obtain a hypothetical sphere or ellipsoid. As per RECIST, hypothetical spherical tumour volume can be calculated with the aforementioned formula using the single longest diameter [30]. The hypothetical ellipsoid tumour volume can be calculated assuming a scalene ellipsoid where x≠y≠z, an oblate ellipsoid (like a disc) where x=y >z or a prolate ellipsoid (like a rugby) where x=y <z (Fig 2) [12]. To determine the best method to estimate the tumour volume, we used various combinations of the linear dimensions (d1, d2, d3) to estimate tumour volumes (Fig.2) (Table 1).
Fig 2.
Schematic representation of volumes of sphere, oblate ellipsoid, prolate ellipsoid and scalene ellipsoid. To determine the best method to estimate the tumour volume, we used various combinations of the linear dimensions (d1>d2>d3) to estimate tumour volumes. V1 was calculated using only the longest dimension (d1) which gives the volume of a sphere; V2 and V3 were calculated using longest dimension (d1) and second longest dimension (d2) (V2 (oblate) [d1×d1×d2], V3 (prolate) [d1×d2×d2]); V4 and V5 were calculated using longest dimension (d1) and shortest dimension (d3) (V4 (oblate) [d1×d1×d3], V5 (prolate) [d1×d2×d2]); V6 was calculated using all three dimensions (scalene) [d1×d2×d3]).
Table 1.
Estimate Volumes
| Volume | Formula | Geometric shape |
|---|---|---|
| Volume 1 (V1) | 4/3p*d13/8 | Sphere |
| Volume 2 (V2) | 4/3p*d1*d1*d2/8 | Oblate ellipsoid |
| Volume 3 (V3) | 4/3p*d1*d2*d2/8 | Prolate ellipsoid |
| Volume 4 (V4) | 4/3p*d1*d1*d3/8 | Oblate ellipsoid |
| Volume 5 (V5) | 4/3p*d1*d3*d3/8 | Prolate ellipsoid |
| Volume 6 (V6) | 4/3p*d1*d2*d3/8 | Scalene ellipsoid |
Statistical Analysis
Intra and inter-observer variability of the Vsegmented and agreement between the Vsegmented and calculated volumes (V1–V6) was assessed using concordance correlation coefficients (CCCs), mean relative difference (%), and 95% limits of agreement (%) as described previously [14; 31; 32]. Assuming two measurements have mean u1 and u2, with variance σ12 and σ22, and covariance σ12, CCC = (2 σ12)/[σ12+ σ22+( u1− u2)2]. CCCs are composed of a measure of precision (how far each pair of measurements deviates from the best-fit line through the data) and a measure of accuracy (the distance between the best-fit line and the 45 line through the origin). A value of 1 indicates perfect agreement and −1 indicates perfect reversed agreement [33]. Agreement in the two measurements (e.g. P1 and P2) was shown visually using Bland-Altman plots with 95% limits of agreement and the average relative difference, computing the mean relative difference (%) between the two measurements (100*[P1−P2]/P1) [34]. The relationship between the volumetric measurements and longest dimension was assessed using Spearman rank correlation coefficient. Statistical analysis was performed with commercial software (GraphPad Prism ver. 6, GraphPad Prism Software Inc, La Jolla, CA) and MedCalc (MedCalc Software bvba, Ostend, Belgium).
Results
The median longest dimension was 6.2 cm (IQ25–75, 4.0 – 10.3 cm). The longest dimension was ≤2 cm in six tumours, 2–5 cm in 45 tumours, 5–10 cm in 42 tumours and >10 cm in 34 tumours.
Segmented tumour volume
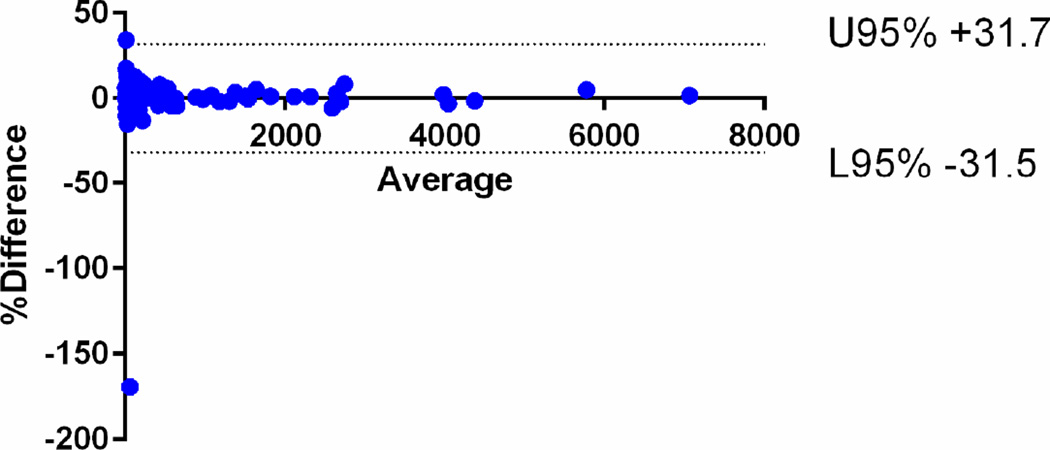
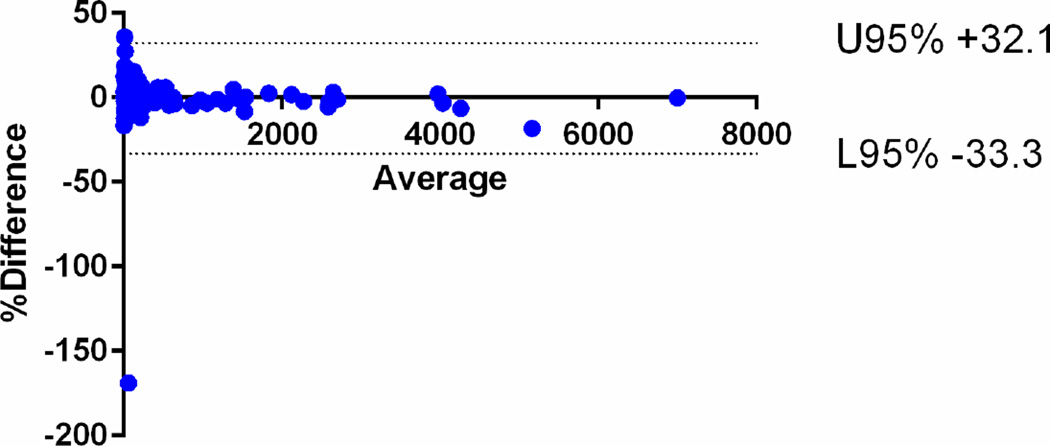
The median Vsegmented for all the tumours was 75.9 cm3 (IQ25–75, 21.4 – 340.6 cm3). There was strong intra-observer agreement between the first and second readings of the radiologist 1 with CCC of 0.9992 [95%CI: 0.9990–0.9995]. There was also strong inter-observer agreement between the readings of radiologists 1 and 2 with CCC of 0.9965 [95%CI: 0.9953–0.9975]. The mean relative difference for intra-observer assessment was 0.10% (95% limits of agreement −31.5, +31.7) and that for inter-observer agreement was −0.6% (95% limits of agreement −33.3, +32.1) (Fig 3).
Fig 3.
Bland-Altman plots of the segmented tumour volumes (Vsegmented) measured by radiologist 1 and 2. The mean relative difference for intra-observer assessment was 0.10% (95% limits of agreement −31.5, +31.7) and that for b inter-observer agreement was −0.6% (95% limits of agreement −33.3, +32.1).
Estimated tumour volume
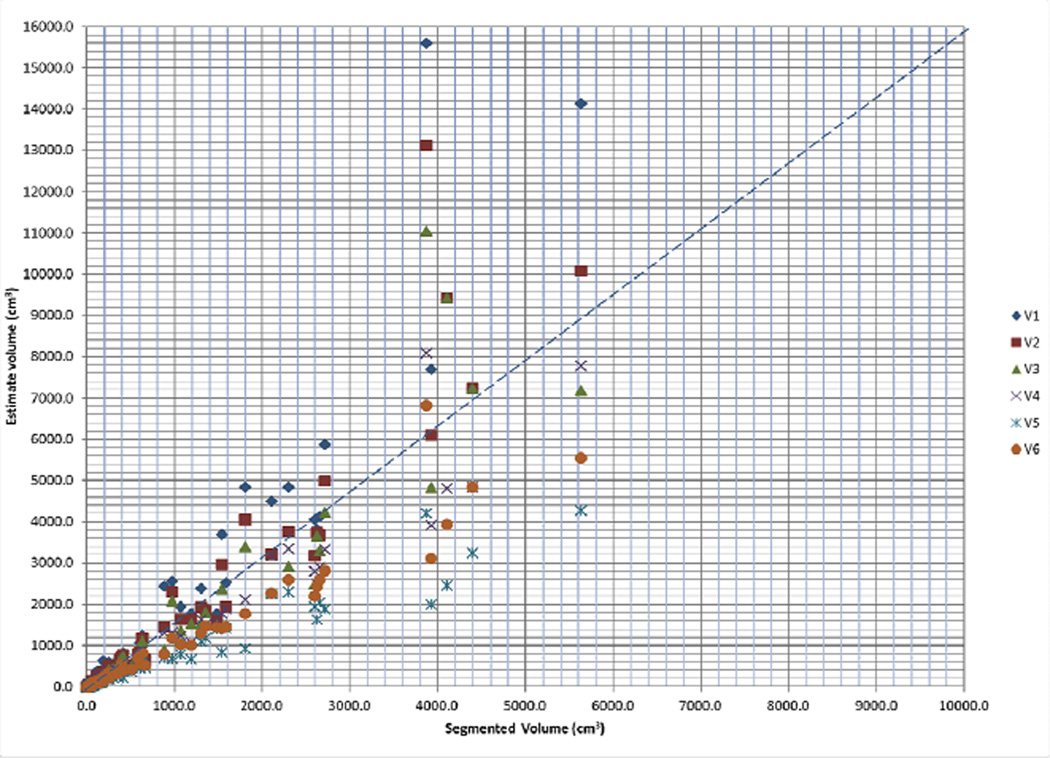
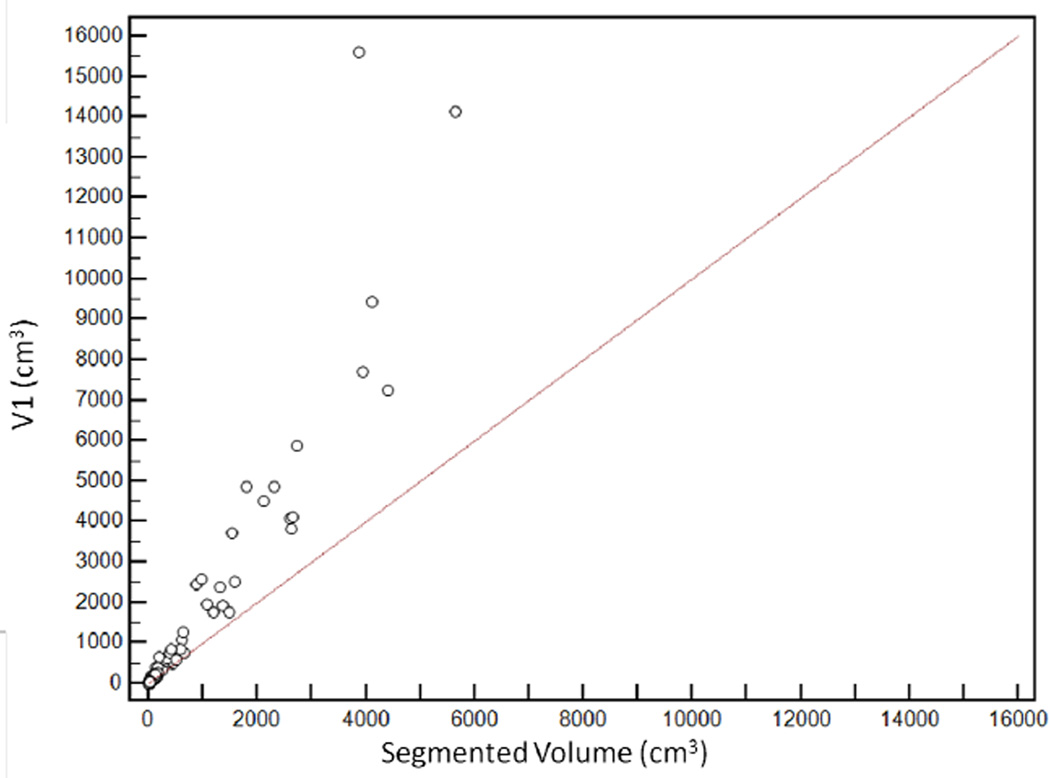
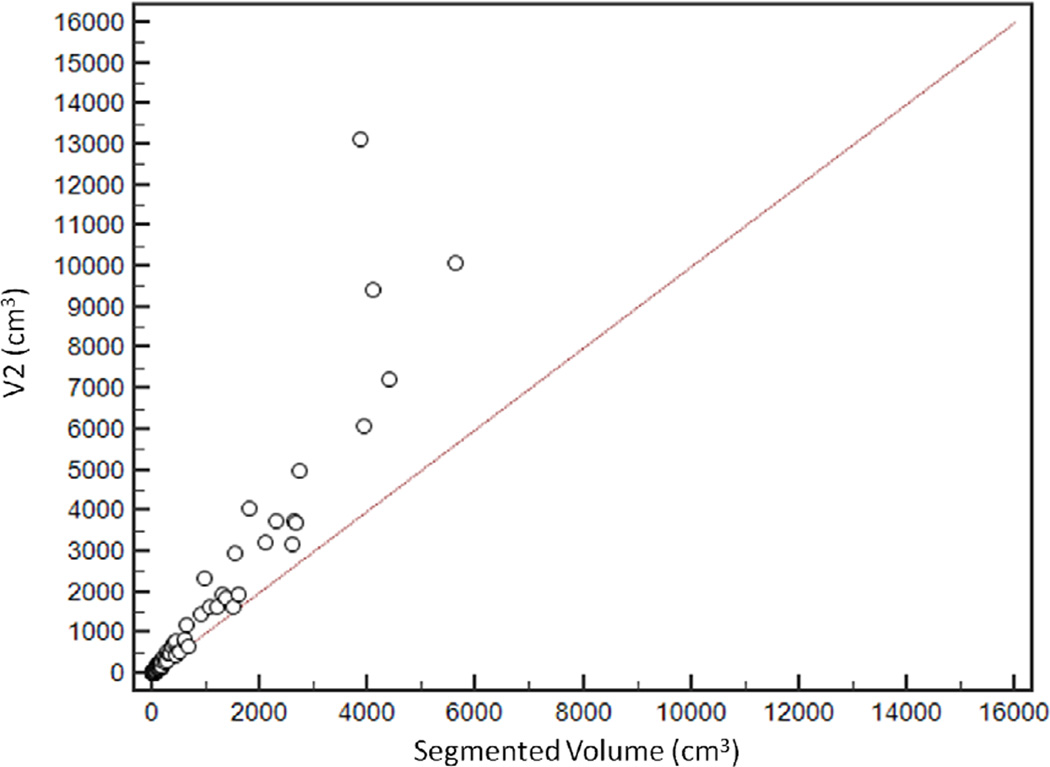
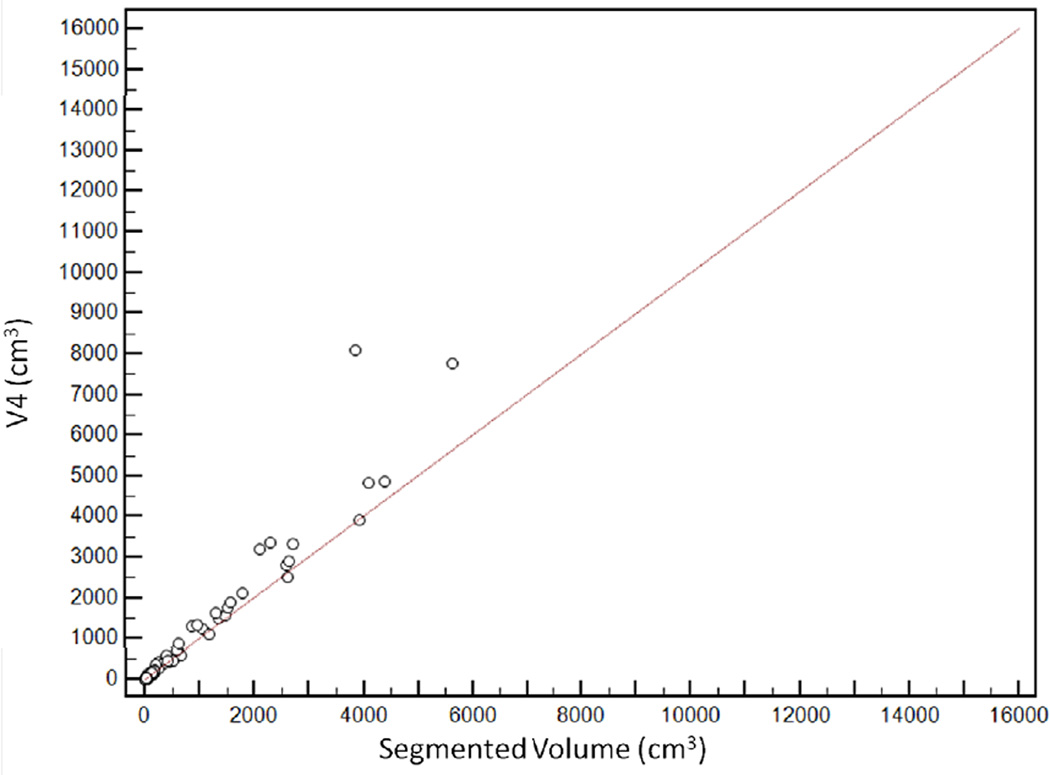
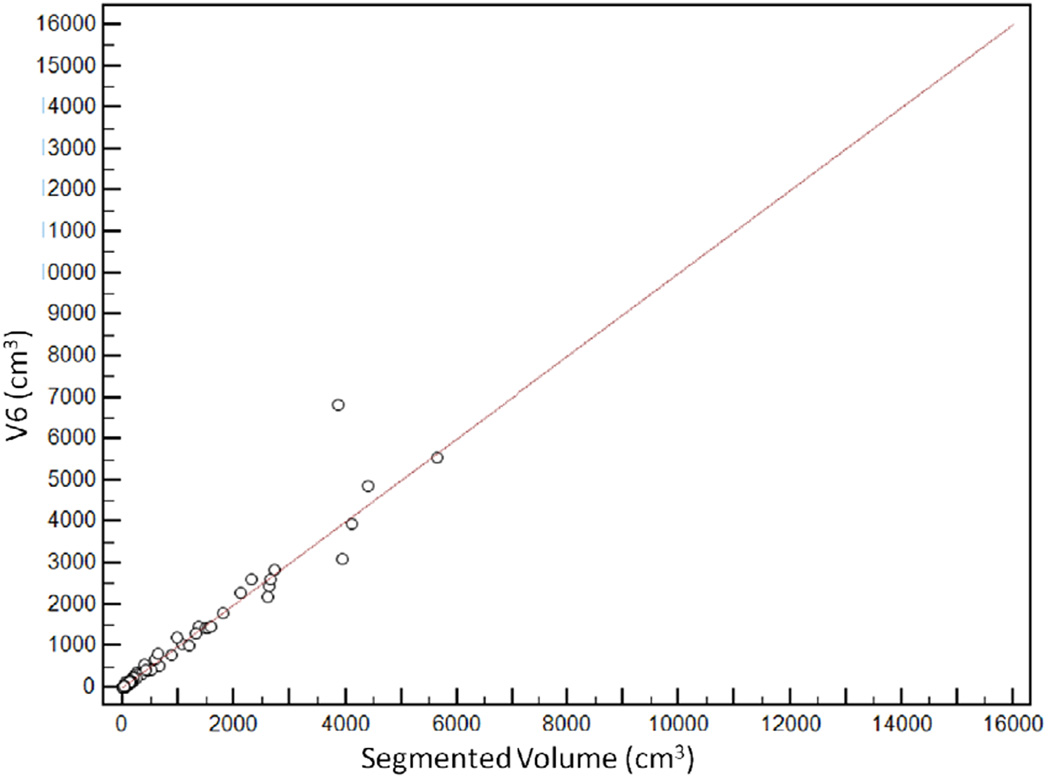
The median V1, V2, V3, V4, V5 and V6 values were 124.9 cm3 (IQ25–75, 33.5–572.6 cm3), 111.6 cm3 (IQ25–75, 28.7–496.9 cm3), 94.0 cm3 (IQ25–75, 25.0–435.7 cm3), 94.4 cm3 (IQ25–75, 25.5–421.7 cm3), 61.7 cm3 (IQ25–75, 17.0–262.0 cm3) and 80.3 cm3 (IQ25–75, 19.3–357.5 cm3) respectively (Fig 4).
Fig 4.
Scatter plot demonstrating distribution of estimated tumour volumes (V1–6) versus segmented tumour volume (Vsegmented).
Agreement between Vsegmented and estimated tumour volumes
V6 had the highest agreement with Vsegmented, with CCC of 0.96 [95%CI: 0.95–0.97]. The agreement was lowest for V1, with CCC of 0.65 [95%CI: 0.61–0.69] (Figure 5). CCCs for V2, V3, V4 and V5 were 0.74 [95%CI: 0.70–0.77], 0.80 [95%CI: 0.77–0.83], 0.92 [95%CI: 0.91–0.94] and 0.93 [95%CI: 0.91–0.94] respectively (Table 2).
Fig 5.
Relationship between segmented volume (Vsegmented) and estimated tumour volumes. V6 had the highest agreement with the segmented volume, with concordance correlation coefficients (CCC) of 0.96 [95%CI: 0.95–0.97]. CCCs for V2, V3, V4 and V5 were 0.74 [95%CI: 0.70 to 0.77], 0.80 [95%CI: 0.77 to 0.83], 0.92 [95%CI: 0.91–0.94] and 0.93 [95%CI: 0.91–0.94] respectively. The agreement was lowest for V1, with CCC of 0.65 [95%CI: 0.61–0.69]
Table 2.
Agreement between Vsegmented and estimated tumor volumes
| Concordance correlation coefficients | Mean relative difference on Bland-Altman Plots | |
|---|---|---|
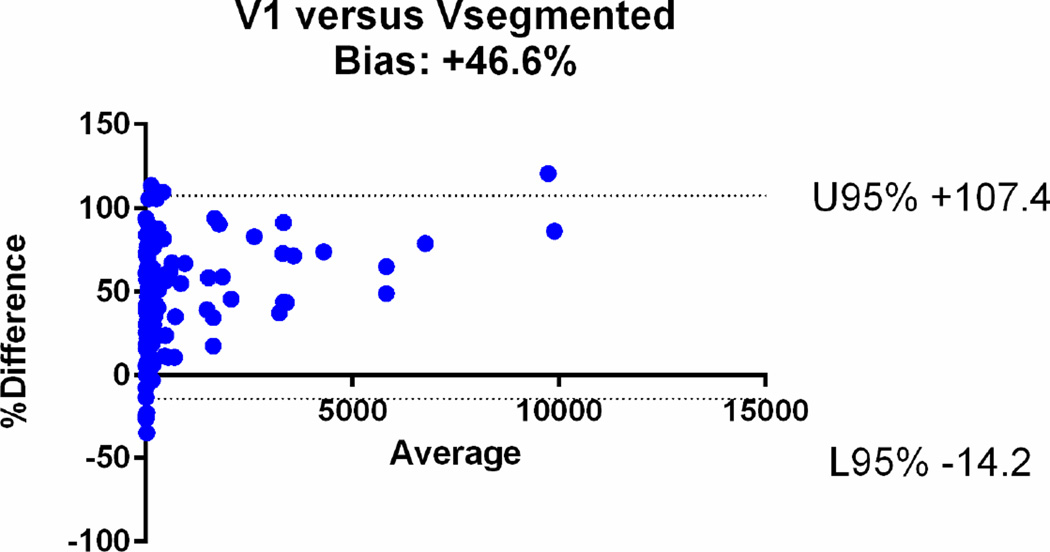
| V1 | 0.65 [95%CI: 0.61–0.69] | +47% (95%CI: −14, +107) |
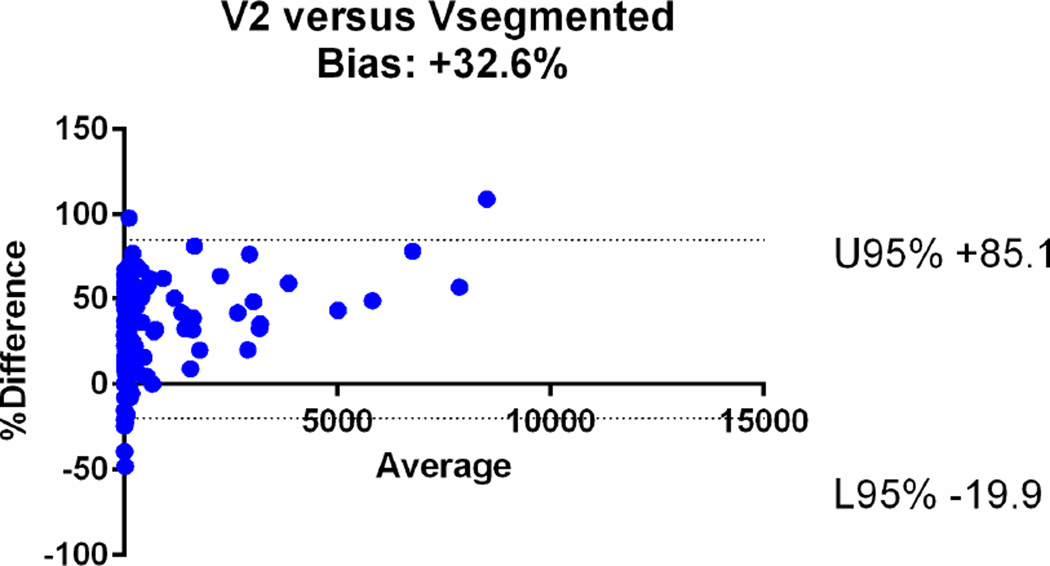
| V2 | 0.74 [95%CI: 0.70–0.77] | +32.6 % (95%CI: −19.9, +85.1) |
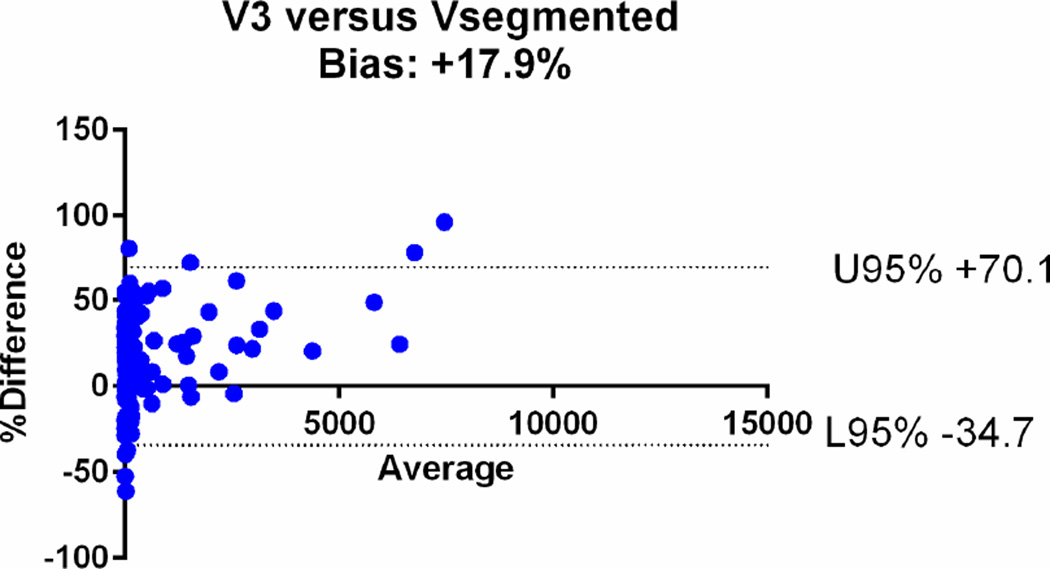
| V3 | 0.80 [95%CI: 0.77–0.83] | +17.9% (95%CI: −34.7, +70.13) |
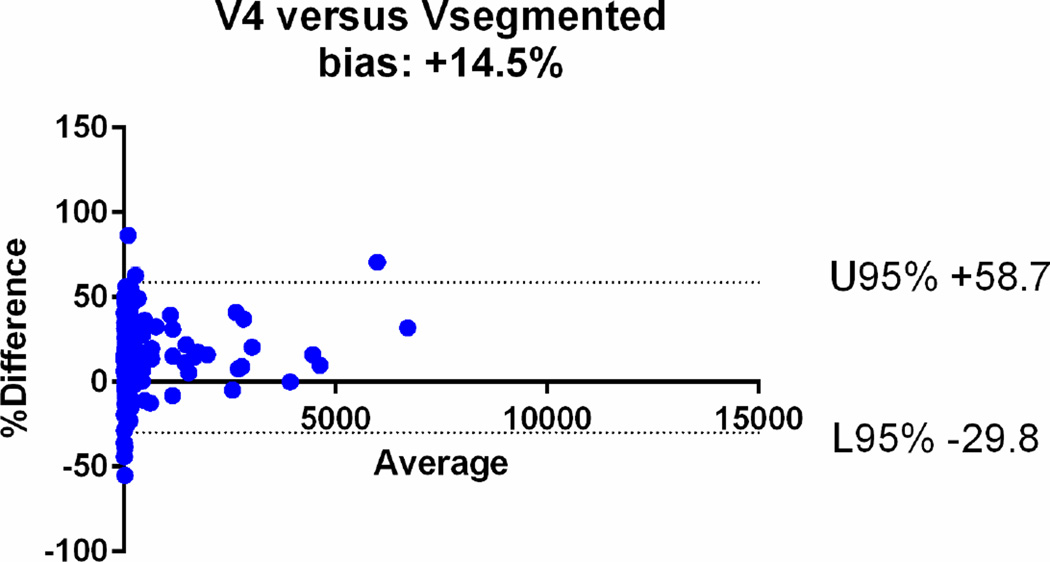
| V4 | 0.92 [95%CI: 0.91–0.94] | +14.5% (95%CI: −29.8, +58.7) |
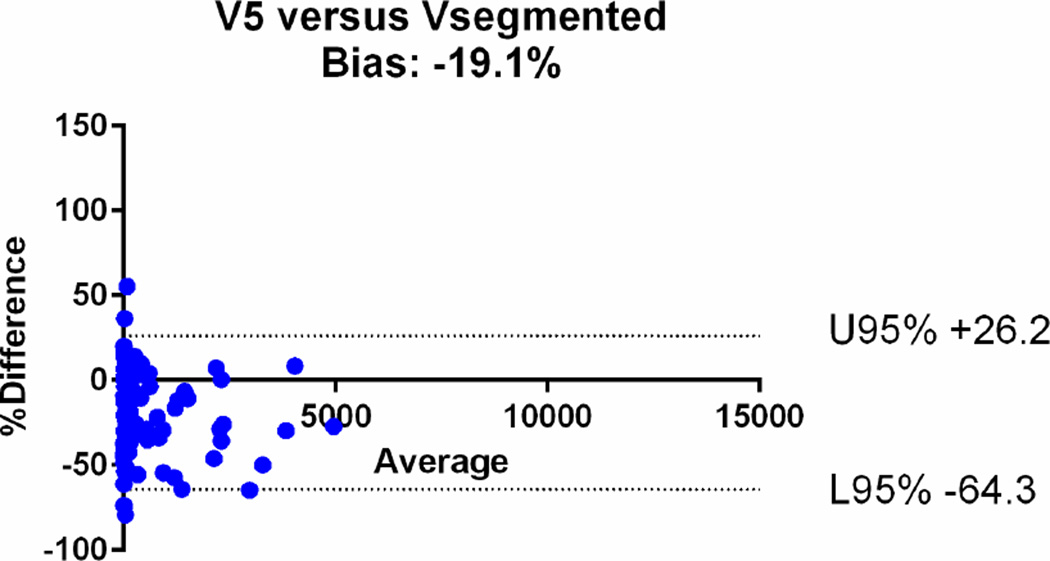
| V5 | 0.93 [95%CI: 0.91–0.94] | −19.1% (95%CI: −64.3, +26.2) |
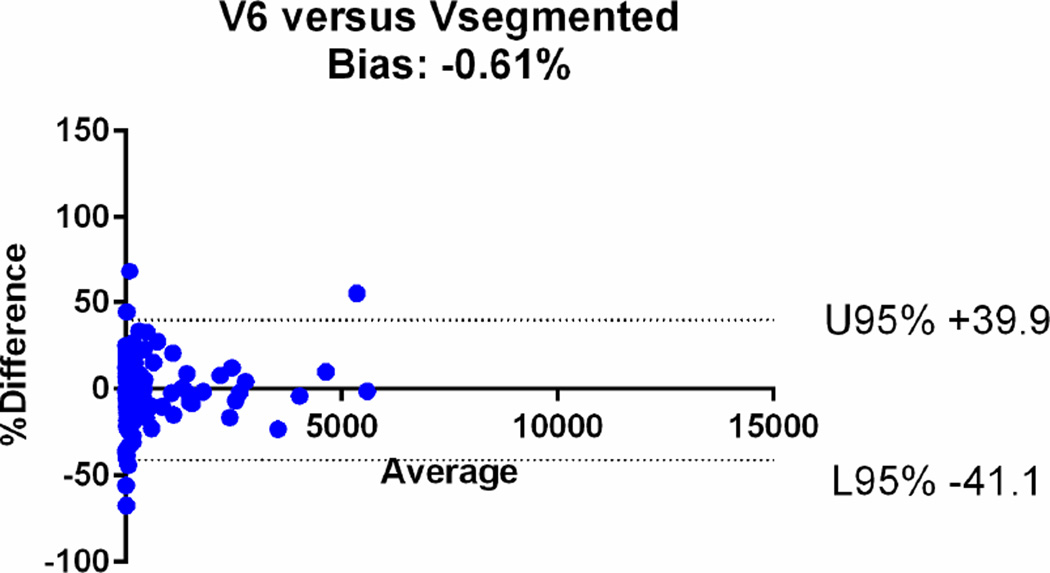
| V6 | 0.96 [95%CI: 0.95–0.97] | −0.61% (95%CI: −41.1, +39.9%) |
The agreements were further assessed with the Bland-Altman plots (Fig. 6). The mean relative difference for V6 was −0.61%, which was markedly smaller compared to that of other calculated volumes, including −19.1% for V5, +14.5% for V4, +17.9% for V3, +32.6 % for V2 and +47% for V1. The 95% limits of agreement on the Bland-Altman plots were narrowest for V6 (−41.1, +39.9%), compared to (−64.3, +26.2) for V5, (−29.8, +58.7) for V4, (−34.7, +70.13) for V3, (−19.9, +85.1) for V2 and (−14, +107) for V1 (Table 2). Based on the assessments, V1, V2, V3 and V4 overestimated the volume, while V5 underestimated the volume.
Fig 6.
Bland-Altman plots comparing the segmented tumour volumes (Vsegmented) with estimate tumour volumes (a–f V1–6). There is agreement between Vsegmented and all the other volumes, but the least bias is with V6. The Vsegmented is overestimated by V1, V2, V3 and V4 and underestimated by V5.
Correlation between volume and longest dimension
The median Vsegmented according to the longest dimension was as follows: 2.2 cm3 (≤2 cm), 18.6 cm3 (>2 – ≤5 cm), 115.6 cm3 (>5 –≤10 cm) and 1248.8 cm3 (>10 cm). There was a strong positive correlation between longest dimension and Vsegmented (Spearman correlation r= 0.985). There was also positive correlation between longest dimension and estimated volumes: V1 (r=1.000), V2 (r=0.998), V3 (r=0.990), V4 (r=0.996) and V5 (r=0.986) and V6 (r= 0. 990).
When Vsegmented was compared with the standard cutoffs of longest dimension which are used in risk stratification of GIST, all the tumours with longest dimension of ≤2 cm had Vsegmented of ≤5 cm3 and 44/45 tumours with longest dimension >2 to ≤5 cm had Vsegmented of >5 and ≤70 cm3. Of the 42 tumours with longest dimension >5cm to ≤ 10 cm, 28 (67%) had Vsegmented of >70 cm3 and ≤ 250 cm3 whereas 33/34 tumours with longest dimension >10cm had Vsegmented of > 250 cm3.
Discussion
In this study, we have demonstrated a strong positive correlation between Vsegmented and all the estimated tumour volumes. The agreement with Vsegmented using CCC was highest for V6 and lowest for spherical tumour volume (V1). The findings likely reflect partly the shape of primary tumours in GIST patients, which often resemble a scalene ellipsoid. The low agreement between measured volume and calculated spherical tumour volume was consistent with our clinical observation that primary tumours of GIST are rarely spherical in shape. The results are also consistent with the prior report which compared the measured and calculated spherical volume in advanced lung cancer patients [15]. Segmented tumour volume was either overestimated or underestimated by all formulae except that for scalene ellipsoids. Spherical tumour volume (V1), obtained by extrapolating only the longest dimension, overestimated segmented tumour volumes by nearly 50%, an observation similar to Laubender et al. who found over estimation of tumour volume (spherical) with RECIST-based longest dimension [19]. In contrast, ellipsoidal volumes (V2–5) using longest and second longest or shortest diameters either overestimated the Vsegmented to a lesser extent or underestimated it. Despite the strong rank order correlation between the longest dimension and segmented volumes, robust to nonlinear monotonic relationships like volume and cubed length, our results show that the use of three measured axes is superior to the use of a single measured axis when approximating volumes using ellipsoids.
Studies have shown that liver metastases in GIST are better assessed as ellipsoids rather than as spheres [11; 12; 29]. Schiavon et al. attempted volumetric analysis in assessing response of hepatic metastases from GIST [11; 12]. In their preliminary study of 363 liver metastases in 84 GIST patients, they compared volume measurements with RECIST and Choi criteria following imatinib therapy [12]. They found that 3D assessments were more sensitive in detecting changes in size than 1D measurements and that volume (especially ellipsoidal) and Choi criteria identified greater numbers of imatinib-responders than RECIST [12]. In addition, 3D criteria had better correlation with over-all survival than RECIST or Choi criteria. In a follow-up study of 139 liver metastases in 78 GIST patients treated with imatinib, Schiavon et al. concluded that unlike the assumption of RECIST that tumours are spherical, liver metastases in GIST are rarely spherical and change considerably during treatment [11]. Though not accurate, ellipsoidal tumour volumes were a reasonable proxy for actual tumour volumes. Our study shows that this assumption holds true in primary gastric GIST as well. We observed that ellipsoid tumour volume (especially scalene ellipsoid volume based on three measured axes) can be used as an alternative measure for tumour volume when automated tumour volumetry is unavailable and that the accuracy of that proxy increases with the number of measured axes. It has yet to be determined if these results of volumetric data in metastatic GIST can be replicated in primary GISTs treated with neoadjuvant imatinib.
To the best of our knowledge, this is the first attempt to assess the accuracy of volumetric estimations in primary gastric GIST. Studies focusing on volumetric assessment of primary malignant abdominopelvic tumours are scant. A good example of primary abdominopelvic malignancy where volumetry has been shown to be of value is primary rectal cancer [18; 24]. Evidence from multiple studies suggests that volumetric assessment reliably detects patients with complete response and correlates with outcome. Lambregts et al. in a study of 112 patients with locally advanced rectal cancer treated with neoadjuvant chemoradiotherapy (CRT) found that post-CRT volumetry on diffusion-weighted imaging had a sensitivity and specificity of 70% and 98% respectively for detecting complete response [18]. Nougaret et al. in a study of 58 patients with rectal cancer treated with CRT found that a tumour volume reduction of at least 70% correlated with good histological tumour regression and longer disease-free survival [24].
The significance of the observations in our study lies in the fact that they are a step towards standardization of volumetric criteria. Though the concept of volumetric response assessment was briefly addressed in RECIST 1.1, it was thought that the lack of sufficient standardization and supporting data may necessitate continued use of anatomic 1D assessments [35]. Our study shows that tumour volume can be calculated with routine cross-sectional imaging data and this can increase the ease of volumetric analysis. It has to be evaluated in future studies if volume estimates from axis-aligned linear measurements would differ from tumour-aligned linear measurements. As changes in volume due to changes in the nonviable or noncellular component of the tumour and the growth pattern of tumour are not taken in to account by both estimated and segmented tumour volumetry, future studies incorporating these variables can help in refining the volumetric criteria.
The larger implication of our study is its impact on refining risk stratification in GISTs. In the assessment of treatment response in tumours, several recent studies have suggested that volume assessment allows the capture finer changes in tumour size in contrast to single longest dimensions on which the traditional response criteria including WHO and RECIST are based [22; 26; 29; 36]. Proposals for translating 1D RECIST cut-offs to 3D criteria are assuming importance. Given the correlation between segmented tumour volumes and ellipsoidal approximations based on a few measured axes in our study, it is to be determined in future studies whether the benefits of the current unidimensional risk stratification model can be enhanced in 3D volume estimations using simple ellipsoidal approximations or if true 3D volume segmentations will be needed. This argument can be further supported by the strong positive correlation between single longest dimension and Vsegmented in our study. This correlation allowed stratification of tumours according to actual tumour volume cutoffs of ≤5 cm3, >5 to ≤70 cm3, >70 cm3 to ≤ 250 cm3 and > 250 cm3 matching the traditional single longest dimension cut-offs.
While the present study provides initial evidence supporting the use of estimated volume calculation using the formula for scalene ellipsoids as an alternate for the measured tumour volumes by segmentation, another important issue that needs to be addressed includes reproducibility of the linear measurements, which represents an important next step to apply tumour volume assessments in GIST patients.
The limitations of the study include a retrospective design in patients treated at a single institution. While we ensured that the Vsegmented was robust by demonstrating a high degree of intra- and inter-observer agreement of the Vsegmented, the linear measurements were performed by two radiologists in consensus, and the issue of reproducibility of linear measurements has not been addressed. Factors like slice thickness and partial volume averaging were not taken into account. Given the short time interval (one month) between the two readings by radiologist 1, the possibility of memory/recall bias while assessing intra-observer variability could not be excluded. Tumours were measured on the baseline scan alone, and follow-up scans were not assessed. Further studies are planned to address the important issue of measurement reproducibility of the technique, as well as the impact on response assessment based on the longitudinal scans. The present study describes an initial step toward incorporating the volumetric assessment in monitoring of GIST patients.
In conclusion, ellipsoidal approximations of volume using three measured axes may be used to closely estimate the measured tumour volume when semi-automated techniques are unavailable. As tumour volumes correlate strongly with unidimensional measurements, additional studies are required to explore the potential role of tumour volumetry and volume approximations in both risk stratification and response assessment of primary GIST to neoadjuvant imatinib.
Key points.
Estimation of tumour volume in primary GIST using mathematical formulae is feasible.
Gastric GISTs are rarely spherical.
Segmented volumes are highly concordant with three axis-based scalene ellipsoid volumes.
Ellipsoid volume can be used as an alternative for automated tumour volumetry.
Acknowledgements
The scientific Guarantor of this study is N.H.R. There is no grant support for the study. The investigator, M.N., has been awarded 1K23CA157631 (NCI) and has served as a consultant to Bristol-Myers Squibb. The investigator A.B.S is a recipient of a Radiologic Society of North America (RSNA) research grant starting from July, 2014. Some of the study subjects(72 patients) have been previously reported as part of another research study: “Gastrointestinal stromal tumour: optimizing the use of cross-sectional chest imaging during follow-up” (Radiology Sep 5:132456, 2014. PMID: 25203129)
Footnotes
None of the other authors have any financial disclosures related to the content in the article.
References
- 1.Gold JS, Dematteo RP. Combined surgical and molecular therapy: The gastrointestinal stromal tumor model. Ann Surg. 2006;244:176–184. doi: 10.1097/01.sla.0000218080.94145.cf. [DOI] [PMC free article] [PubMed] [Google Scholar]
- 2.Tirumani SH, Jagannathan JP, Krajewski KM, Shinagare AB, Jacene H, Ramaiya NH. Imatinib and beyond in gastrointestinal stromal tumors: A radiologist's perspective. AJR Am J Roentgenol. 2013;201:801–810. doi: 10.2214/AJR.12.10003. [DOI] [PubMed] [Google Scholar]
- 3.Miettinen M, Sobin LH, Lasota J. Gastrointestinal stromal tumors of the stomach: A clinicopathologic, immunohistochemical, and molecular genetic study of 1765 cases with long-term follow-up. Am J Surg Pathol. 2005;29:52–68. doi: 10.1097/01.pas.0000146010.92933.de. [DOI] [PubMed] [Google Scholar]
- 4.Gronchi A. Risk stratification models and mutational analysis: Keys to optimising adjuvant therapy in patients with gastrointestinal stromal tumour. Eur J Cancer. 2013;49:884–892. doi: 10.1016/j.ejca.2012.10.025. [DOI] [PubMed] [Google Scholar]
- 5.Tirumani SH, Shinagare AB, Jagannathan JP, Krajewski KM, Ramaiya NH, Raut CP. Radiologic assessment of earliest, best, and plateau response of gastrointestinal stromal tumors to neoadjuvant imatinib prior to successful surgical resection. Eur J Surg Oncol. 2014;40:420–428. doi: 10.1016/j.ejso.2013.10.021. [DOI] [PubMed] [Google Scholar]
- 6.Wang D, Zhang Q, Blanke CD, et al. Phase ii trial of neoadjuvant/adjuvant imatinib mesylate for advanced primary and metastatic/recurrent operable gastrointestinal stromal tumors: Long-term follow-up results of radiation therapy oncology group 0132. Ann Surg Oncol. 2012;19:1074–1080. doi: 10.1245/s10434-011-2190-5. [DOI] [PMC free article] [PubMed] [Google Scholar]
- 7.Miettinen M, Lasota J. Gastrointestinal stromal tumors: Pathology and prognosis at different sites. Semin Diagn Pathol. 2006;23:70–83. doi: 10.1053/j.semdp.2006.09.001. [DOI] [PubMed] [Google Scholar]
- 8.Rezai P, Pisaneschi MJ, Feng C, Yaghmai V. A radiologist's guide to treatment response criteria in oncologic imaging: Anatomic imaging biomarkers. AJR Am J Roentgenol. 2013;201:237–245. doi: 10.2214/AJR.12.9862. [DOI] [PubMed] [Google Scholar]
- 9.Nishino M, Dahlberg SE, Cardarella S, et al. Tumor volume decrease at 8 weeks is associated with longer survival in egfr-mutant advanced non-small-cell lung cancer patients treated with egfr tki. J Thorac Oncol. 2013;8:1059–1068. doi: 10.1097/JTO.0b013e318294c909. [DOI] [PMC free article] [PubMed] [Google Scholar]
- 10.Nishino M, Dahlberg SE, Cardarella S, et al. Volumetric tumor growth in advanced non-small cell lung cancer patients with egfr mutations during egfr-tyrosine kinase inhibitor therapy: Developing criteria to continue therapy beyond recist progression. Cancer. 2013;119:3761–3768. doi: 10.1002/cncr.28290. [DOI] [PMC free article] [PubMed] [Google Scholar]
- 11.Schiavon G, Ruggiero A, Bekers DJ, et al. The effect of baseline morphology and its change during treatment on the accuracy of response evaluation criteria in solid tumours in assessment of liver metastases. Eur J Cancer. 2014;50:972–980. doi: 10.1016/j.ejca.2014.01.004. [DOI] [PubMed] [Google Scholar]
- 12.Schiavon G, Ruggiero A, Schoffski P, et al. Tumor volume as an alternative response measurement for imatinib treated gist patients. PLoS One. 2012;7:e48372. doi: 10.1371/journal.pone.0048372. [DOI] [PMC free article] [PubMed] [Google Scholar]
- 13.Schwartz L, Curran S, Trocola R, et al. Volumetric 3d ct analysis–an early predictor of response to therapy. J Clin Oncol. 2007;25:4576. [Google Scholar]
- 14.Nishino M, Guo M, Jackman DM, et al. Ct tumor volume measurement in advanced non-small-cell lung cancer: Performance characteristics of an emerging clinical tool. Acad Radiol. 2011;18:54–62. doi: 10.1016/j.acra.2010.08.021. [DOI] [PMC free article] [PubMed] [Google Scholar]
- 15.Nishino M, Jackman DM, DiPiro PJ, Hatabu H, Janne PA, Johnson BE. Revisiting the relationship between tumour volume and diameter in advanced nsclc patients: An exercise to maximize the utility of each measure to assess response to therapy. Clin Radiol. 2014;69:841–848. doi: 10.1016/j.crad.2014.03.020. [DOI] [PMC free article] [PubMed] [Google Scholar]
- 16.Chen SW, Yang SN, Liang JA, Tsai MH, Shiau AC, Lin FJ. Value of computed tomography-based tumor volume as a predictor of outcomes in hypopharyngeal cancer after treatment with definitive radiotherapy. Laryngoscope. 2006;116:2012–2017. doi: 10.1097/01.mlg.0000237804.38761.81. [DOI] [PubMed] [Google Scholar]
- 17.Chow DS, Qi J, Guo X, et al. Semiautomated volumetric measurement on postcontrast mr imaging for analysis of recurrent and residual disease in glioblastoma multiforme. AJNR Am J Neuroradiol. 2014;35:498–503. doi: 10.3174/ajnr.A3724. [DOI] [PMC free article] [PubMed] [Google Scholar]
- 18.Lambregts DM, Rao SX, Sassen S, et al. Mri and diffusion-weighted mri volumetry for identification of complete tumor responders after preoperative chemoradiotherapy in patients with rectal cancer: A bi-institutional validation study. Ann Surg. 2014 doi: 10.1097/SLA.0000000000000909. [DOI] [PubMed] [Google Scholar]
- 19.Laubender R, Lynghjem J, D’Anastasi M, et al. Evaluating the agreement between tumour volumetry and the estimated volumes of tumour lesions using an algorithm. European Radiology. 2014;24:1521–1528. doi: 10.1007/s00330-014-3195-9. [DOI] [PubMed] [Google Scholar]
- 20.Lee JA, Yang D, Yoon WS, et al. Tumor volume reduction assessed by planning computed tomography in patients with rectal cancer during preoperative chemoradiation: Impact of residual tumor volume on the prediction of pathologic tumor regression. Tumori. 2014;100:158–162. doi: 10.1177/030089161410000207. [DOI] [PubMed] [Google Scholar]
- 21.Miller SL, Hoffer FA, Reddick WE, et al. Tumor volume or dynamic contrastenhanced mri for prediction of clinical outcome of ewing sarcoma family of tumors. Pediatr Radiol. 2001;31:518–523. doi: 10.1007/s002470100481. [DOI] [PubMed] [Google Scholar]
- 22.Mozley PD, Bendtsen C, Zhao B, et al. Measurement of tumor volumes improves recist-based response assessments in advanced lung cancer. Transl Oncol. 2012;5:19–25. doi: 10.1593/tlo.11232. [DOI] [PMC free article] [PubMed] [Google Scholar]
- 23.Nixon IJ, Palmer FL, Lakin P, Kattan MM, Lee NY, Ganly I. Pathologically determined tumor volume vs pathologic t stage in the prediction of outcome after surgical treatment of oropharyngeal squamous cell carcinoma. JAMA Otolaryngol Head Neck Surg. 2013;139:1151–1155. doi: 10.1001/jamaoto.2013.4973. [DOI] [PubMed] [Google Scholar]
- 24.Nougaret S, Rouanet P, Molinari N, et al. Mr volumetric measurement of low rectal cancer helps predict tumor response and outcome after combined chemotherapy and radiation therapy. Radiology. 2012;263:409–418. doi: 10.1148/radiol.12111263. [DOI] [PubMed] [Google Scholar]
- 25.Regini F, Gourtsoyianni S, Cardoso De Melo R, et al. Rectal tumour volume (gtv) delineation using t2-weighted and diffusion-weighted mri: Implications for radiotherapy planning. Eur J Radiol. 2014;83:768–772. doi: 10.1016/j.ejrad.2014.02.007. [DOI] [PubMed] [Google Scholar]
- 26.Graser A, Becker CR, Reiser MF, Stief C, Staehler M. volumetry of metastases from renal cell carcinoma: Comparison with the recist criteria. Radiologe. 2008;48:850–856. doi: 10.1007/s00117-008-1743-5. [DOI] [PubMed] [Google Scholar]
- 27.Zhao B, Tan Y, Bell DJ, et al. Exploring intra- and inter-reader variability in unidimensional, bi-dimensional, and volumetric measurements of solid tumors on ct scans reconstructed at different slice intervals. Eur J Radiol. 2013;82:959–968. doi: 10.1016/j.ejrad.2013.02.018. [DOI] [PMC free article] [PubMed] [Google Scholar]
- 28.Prasad SR, Jhaveri KS, Saini S, Hahn PF, Halpern EF, Sumner JE. Ct tumor measurement for therapeutic response assessment: Comparison of unidimensional, bidimensional, and volumetric techniques initial observations. Radiology. 2002;225:416–419. doi: 10.1148/radiol.2252011604. [DOI] [PubMed] [Google Scholar]
- 29.Schramm N, Englhart E, Schlemmer M, et al. Tumor response and clinical outcome in metastatic gastrointestinal stromal tumors under sunitinib therapy: Comparison of recist, choi and volumetric criteria. Eur J Radiol. 2013;82:951–958. doi: 10.1016/j.ejrad.2013.02.034. [DOI] [PubMed] [Google Scholar]
- 30.Therasse P, Arbuck SG, Eisenhauer EA, et al. New guidelines to evaluate the response to treatment in solid tumors. European organization for research and treatment of cancer, national cancer institute of the united states, national cancer institute of canada. J Natl Cancer Inst. 2000;92:205–216. doi: 10.1093/jnci/92.3.205. [DOI] [PubMed] [Google Scholar]
- 31.Nishino M, Giobbie-Hurder A, Gargano M, Suda M, Ramaiya NH, Hodi FS. Developing a common language for tumor response to immunotherapy: Immune-related response criteria using unidimensional measurements. Clin Cancer Res. 2013;19:3936–3943. doi: 10.1158/1078-0432.CCR-13-0895. [DOI] [PMC free article] [PubMed] [Google Scholar]
- 32.Zhao B, James LP, Moskowitz CS, et al. Evaluating variability in tumor measurements from same-day repeat ct scans of patients with non-small cell lung cancer. Radiology. 2009;252:263–272. doi: 10.1148/radiol.2522081593. [DOI] [PMC free article] [PubMed] [Google Scholar]
- 33.Lin LI. A concordance correlation coefficient to evaluate reproducibility. Biometrics. 1989;45:255–268. [PubMed] [Google Scholar]
- 34.Bland JM, Altman DG. Statistical methods for assessing agreement between two methods of clinical measurement. Lancet. 1986;1:307–310. [PubMed] [Google Scholar]
- 35.Eisenhauer EA, Therasse P, Bogaerts J, et al. New response evaluation criteria in solid tumours: Revised recist guideline (version 1.1) Eur J Cancer. 2009;45:228–247. doi: 10.1016/j.ejca.2008.10.026. [DOI] [PubMed] [Google Scholar]
- 36.National Comprehensive Cancer Network. NCCN clinical practice guidelines in oncology soft tissue sarcoma version 2.2014. 2014. [Accessed 15 Jun 2014]. http://www.nccn.org/professionals/physician_gls/f_guidelines.asp#site. 2014. [Google Scholar]


