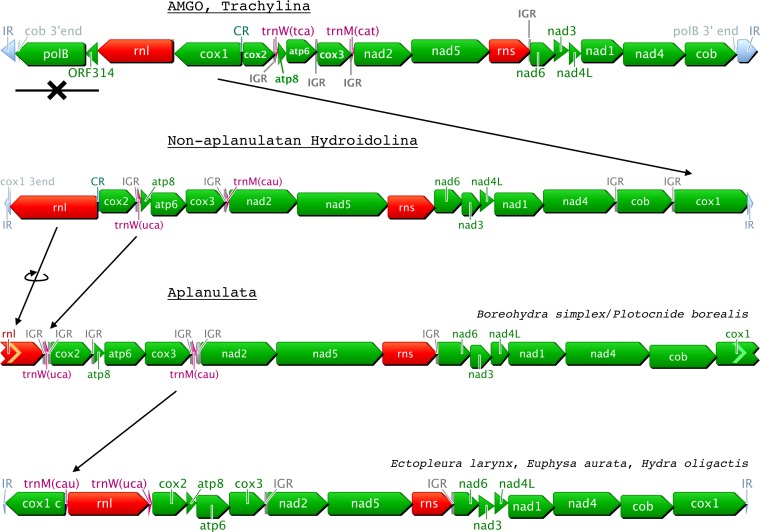
Figure 1. Predicted evolution of the mitochondrial genome organization in Hydrozoa (Cnidaria).
Genes are color-coded as follows: green for proteins; red for rRNAs; purple for tRNAs; light-grey for repeated regions. CR: Control Region corresponding to the inversion of transcription orientation; IR: Inverted Repeat; IGR: Inter-Genic Region. AMGO corresponds to the Ancestral Mitochondrial Genome Organization as predicted in Kayal et al. (2013); cox1 c is a duplicated cox1 on the other end of the mtDNA; incomplete 5’end and 3’end are represented by chevrons on the left and right side of genes, respectively.

