

Abstract
Major depressive disorder is thought to arise in part from dysfunction of the brain's “reward circuitry,” consisting of the mesolimbic dopamine system and the glutamatergic and neuromodulatory inputs onto this system. Both chronic stress and antidepressant treatment regulate gene transcription in many of the brain regions that make up these circuits, but the exact nature of the transcription factors and target genes involved in these processes remain unclear. Here, we demonstrate induction of the FosB family of transcription factors in ∼25 distinct regions of adult mouse brain, including many parts of the reward circuitry, by chronic exposure to the antidepressant fluoxetine. We further uncover specific patterns of FosB gene product expression (i.e., differential expression of full-length FosB, ΔFosB, and Δ2ΔFosB) in brain regions associated with depression – the nucleus accumbens (NAc), prefrontal cortex (PFC), and hippocampus – in response to chronic fluoxetine treatment, and contrast these patterns with differential induction of FosB isoforms in the chronic social defeat stress model of depression with and without fluoxetine treatment. We find that chronic fluoxetine, in contrast to stress, causes induction of the unstable full-length FosB isoform in the NAc, PFC, and hippocampus even 24 hours following the final injection, indicating that these brain regions may undergo chronic activation when fluoxetine is on board, even in the absence of stress. We also find that only the stable ΔFosB isoform correlates with behavioral responses to stress. These data suggest that NAc, PFC, and hippocampus may present useful targets for directed intervention in mood disorders (ie, brain stimulation or gene therapy), and that determining the gene targets of FosB-mediated transcription in these brain regions in response to fluoxetine may yield novel inroads for pharmaceutical intervention in depressive disorders.
Keywords: antidepressants, social defeat, nucleus accumbens, hippocampus, ΔFosB, transcription, depression
1. Introduction
Approximately one in five Americans will experience a depressive disorder within their lifetime (Kessler et al., 2005), and only about 50% of those will fully respond to available treatments (Culpepper, 2010). In recent decades, it has become increasingly clear that the variability in depressive disorders and in the response to existing treatments stems, at least in part, from individual differences in both genetics (Flint and Kendler, 2014) and gene expression (Vialou et al., 2013). Our group and many others suggest that chronic stress or exposure to antidepressants causes induction and altered function of transcription factors which, in turn, modulate gene expression to alter mood and behavior (Vialou et al., 2013). We therefore propose that determining: 1) the specific brain regions, 2) the specific transcription factors, and 3) the specific target genes involved in these processes could potentially lead to the development of novel therapeutic approaches for the treatment and prevention of depressive disorders. Previous studies indicate that the transcription factor ΔFosB is induced by both chronic stress and chronic antidepressant treatment, and that it plays an essential role in mouse models of depression and antidepressant action (Perrotti et al., 2004; Vialou et al., 2010; Ohnishi et al., 2011; Lobo et al., 2013; Robison et al., 2013; Vialou et al., 2014).
The brain's reward circuitry centers on dopaminergic neurons in the ventral tegmental area (VTA) and their mesolimbic projections to nucleus accumbens (NAc), dorsal striatum, amygdala, and hippocampus, as well as their mesocortical projections, in particular to the prefrontal cortex (PFC). Previous studies of the role of ΔFosB in stress responses and antidepressant action have focused on discrete brain regions within the reward circuitry, namely the NAc (Vialou et al., 2010; Robison et al., 2013) and the PFC (Vialou et al., 2014). However, other forms of stimulation, such as chronic exposure to various drugs of abuse, are known to induce ΔFosB in many additional brain regions, both within and outside the reward circuitry (Perrotti et al., 2008). Moreover, the FosB message undergoes complex splicing resulting in multiple proteins, the most prominent of which have apparent molecular weights of 50 kDa (full-length FosB), 35-37 kDa (ΔFosB), and 25 kDa (Δ2ΔFosB) that may have distinct transcriptional target genes and may play distinct roles in behavioral responses (Ohnishi et al., 2011). For instance, ΔFosB appears to drive spontaneous locomotor activity and accumulation of E-cadherin and phospho-Akt, while full-length FosB is essential for stress tolerance (Ohnishi et al., 2011). Though the expression of the distinct gene products in response to stress and various drugs has been examined extensively in NAc and to some degree in PFC (Perrotti et al., 2004), expression of the different FosB gene products outside the NAc in mouse models of depression and antidepressant action has not been reported in detail. Here, we demonstrate that chronic treatment with the antidepressant fluoxetine induces FosB gene products in more than 25 distinct regions of the mouse brain, and that the presence of specific FosB splice products varies in select regions of the reward circuitry under both stress and antidepressant conditions. We chose to focus on NAc and PFC because our previous studies demonstrate the behavioral importance of FosB in these regions (Vialou et al., 2010; Vialou et al., 2014), and we chose hippocampus because is both modulates the function of the mesolimbic and mesocortical dopamine system and has been directly implicated in many studies of depression, both in humans and in pre-clinical models (Duman and Aghajanian, 2012; Eisch and Petrik, 2012).
2. Materials and Methods
2.1. Animals
C57BL/6J male mice (The Jackson Laboratory), 7–8 weeks old and weighing 25–30 g, were habituated to the animal facility one week before use and maintained at 22–25°C on a 12 hr light/dark cycle. All animals had access to food and water ad libitum. All experiments were conducted in accordance with the guidelines of the Institutional Animal Care and Use Committees at Icahn School of Medicine at Mount Sinai and Michigan State University. All efforts were made to minimize animal suffering, to reduce the number of animals used, and to utilize alternatives to in vivo techniques when available.
2.2 Drug Administration
Fluoxetine was dissolved in 0.9% sterile saline solution at 2mg/ml and administered intraperitoneally at 20mg/kg daily for 14 consecutive days to naïve animals (Sections 3.1 and 3.2 below) or 20 days to socially defeated animals (Section 3.4 below). Animals were sacrificed 24 hrs after the final injection and tissue was handled as described below.
2.3 Chronic Social Defeat Stress
Chronic (10 days) social defeat stress and social interaction tests were performed essentially as described (Krishnan et al., 2007; Golden et al., 2011). Briefly, during each defeat episode, intruder mice were allowed to interact for 10 min with an aggressive CD1 mouse, during which they were attacked and displayed subordinate posturing, then spent the remainder of each 24-hour period in the aggressor's cage, separated from the aggressor by a perforated plexiglass divider. For the social interaction test, we measured the time spent in the interaction zone during the first (target absent) and second (target present) trials; the interaction ratio was calculated as 100 × (interaction time, target present)/(interaction time, target absent). Target mice were CD1 males not used for aggressive encounters with the C57 mice being tested for interaction.
2.4. Immunohistochemistry
Eighteen to 24 hr after their last fluoxetine treatment or defeat exposure, animals were anesthetized with chloral hydrate and perfused intracardially with 200 ml of PBS (11.9 mM phosphates, 137 mM NaCl, 2.7 mM KCl; pH 7.4), followed by 400 ml of 4% paraformaldehyde in PBS. Brains were removed and stored overnight in 4% paraformaldehyde at 4°C, then transferred to a 30% sucrose in PBS solution and stored at 4°C until isotonic. Coronal sections (35 μm) were cut on a freezing microtome (Leica, Bannock-burn, IL) and then processed for immunohistochemistry as described (Perrotti et al., 2008) using a polyclonal FosB antibody (SC-48, Santa Cruz Biotechnology, Dallas, TX) which recognizes all three major FosB gene products. FosB positive cells were visualized using diaminobenzidine (DAB) staining (Vector Laboratories, Burlingame, CA) and counted by a double-blind experimenter. The number of FosB immunopositive cells was counted in the entire brain area in a given 35 μm slice and divided by the area to give cells/mm2. FosB was quantified in several sections through the brain of each mouse, and mean values were then calculated for each mouse. Each mouse was considered an individual observation for statistical analysis. Brain regions were defined by (Paxinos and Franklin, 2004).
2.5 Western Blotting
24 hr following final injection of fluoxetine or final defeat episode, mice were decapitated and brains were removed. Brains were serially sliced in a 1.0 mm matrix (Braintree Scientific) and target tissue was removed in phosphate buffered saline containing protease and phosphatase inhibitor cocktails (Sigma Aldrich, St Louis, MO) using a 14 gauge punch for NAc and PFC and a 12 gauge punch for hippocampus and immediately frozen on dry ice. Samples were homogenized by light sonication in modified RIPA buffer: 10 mM Tris base, 150 mM sodium chloride, 1 mM EDTA, 0.1% sodium dodecyl sulfate, 1% Triton X-100, 1% sodium deoxycholate, pH 7.4, protease and phosphatase inhibitors as above. After addition of Laemmli buffer, proteins were separated on 4-15% polyacrylamaide gradient gels (Criterion System, BioRad), and Western blotting was performed using a polyclonal FosB antibody (5G4, Cell Signaling, Danvers, MA) enhanced chemiluminescent detection (Pierce, Rockford, IL). Films were scanned and band intensity was quantified using ImageJ software.
To generate line plots (panels labeled B in Western blot figures), a vertical line was drawn through the bands centered on the top band of the ΔFosB doublet (∼37kDa). The resulting histogram data were averaged for all animals of each group, and the lowest raw pixel intensity value was subtracted from all values for each graph, thus removing the background (which varied due to exposure time). For analysis of individual isoforms, a box was drawn around each of the pertinent bands (50kDa for FosB; the 35-37kDa doublet for ΔFosB; 25kDa for Δ2DFosB) and average pixel intensity was calculated. A background value for each blot was generated from a region containing no specific bands and subtracted from all band values. Finally, membranes were stained for total protein with Swift Membrane Stain (GBiosciences, St Louis, MO), and all band values were normalized to total protein for each lane.
2.6 Statistical Analyses
All statistical analyses were performed using the Prism 6 software package (GraphPad). Student's t-tests were used for all pair-wise comparisons (indicated in Results where t value is given), and differences were considered significant at p<0.05. Error bars on all graphs represent standard error from the mean.
3. Results
3.1 Fluoxetine induction of FosB-like immunoreactivity throughout the brain
Previous studies indicate that FosB gene products are induced in the mouse NAc by chronic exposure to fluoxetine, and that induction of NAc ΔFosB is essential for fluoxetine's behavioral effects in the mouse chronic social defeat stress (CSDS) model of depression (Vialou et al., 2010). In order to determine whether fluoxetine also induces FosB gene products in other brain regions, we used immunohistochemistry to assess levels of FosB gene products after chronic exposure to fluoxetine. As expected, we detected the highest levels of FosB-positive cells in the core and shell of the NAc in saline treated animals, and this was significantly increased in animals treated with chronic fluoxetine (Fig 1A; Table 1). Interestingly, we also found significant increases in FosB-positive cells in virtually every brain region in which FosB-positive cells could be detected (Table 1). The dorsal hippocampus was of particular interest, as there were low levels of FosB-positive cells detected in the dentate gyrus (DG) and CA3 regions of control animals, and virtually none detected in the CA1 region, but there was very strong induction of FosB-like immunoreactivity in all three regions in response to fluoxetine (Fig 1B; Table 1). Specifically, the DG had the highest total number of FosB-positive cells per mm2 after fluoxetine treatment of any region tested, and the CA1 had the highest fold induction of any region tested (Table 1). Other regions of strong induction include parts of the frontal cortex (Fig 1C) and hypothalamus (Fig 1D). All regions in which FosB-positive cells were detected showed a significant fluoxetine-mediated induction with exception of the subiculum, in which a trend for induction was found, but the levels of FosB-positive cells were low and variable (Table 1). No FosB-positive cells were found in the cerebellum, with or without fluoxetine (data not shown).
Figure 1. Induction of FosB-positive cells by chronic fluoxetine.

FosB-positive cells as visualized by DAB-staining in saline- (top) and chronic fluoxetine-treated (middle) mice in A) NAc (Bregma 1.10 mm), B) hippocampus (-1.58 mm), C) PFC (2.10 mm), and D) hypothalamus (-1.46 mm). Schematics of the location of each brain region (red box) within a coronal slice are depicted (bottom; adapted from (Paxinos et al., 2001)). AC: anterior commissure; DG: dentate gyrus; C1: field CA1 of hippocampus; C2: field CA2 of hippocampus; M2: secondary motor cortex; PrL: prelimbic cortex; DM: dorsomedial hypothalamus.
Table 1. Induction of FosB-positive cells after chronic fluoxetine by brain region.
FosB-positive cells as visualized by DAB-staining (see Figure 1) in saline- and chronic fluoxetine-treated mice by brain region. Statistics represent two-tailed Student's t-test. Percent induction by fluoxetine is presented as (control cells per mm2/fluoxetine cells per mm2)×100. (n = 4-10 mice per group)
| Brain Region | Control Cells/mm2 (+/− SEM); N | Fluoxetine Cells/mm2 (+/− SEM); N | t(df); p value | % Induction | Bregma |
|---|---|---|---|---|---|
| Orbital Frontal Cortex, Medial | 78.62 ± 8.656; N=9 | 450.2 ± 39.27; N=6 | t(13)=11.18; p < 0.0001 | 572% | 2.10 mm |
| Orbital Frontal Cortex, Ventrolateral | 51.26 ± 10.85; N=10 | 665.9 ± 86.45; N=6 | t(14)=9.190; p < 0.0001 | 1,298% | 2.10 mm |
| Prefrontal Cortex, M1 | 32.23 ± 4.534; N=10 | 512.6 ± 77.08; N=6 | t(14)=8.202; p < 0.0001 | 1,590% | 2.10 mm |
| Prefrontal Cortex, M2 | 35.09 ± 5.515 N=10 | 431.6 ± 19.25 N=6 | t(14)=24.41; p < 0.0001 | 1,230% | 2.10 mm |
| Prelimbic Cortex | 82.29 ± 10.50; N=9 | 414.2 ± 37.04; N=5 | t(12)=10.96; p < 0.0001 | 503% | 2.10 mm |
| Nucleus Accumbens Shell | 474.8 ± 9.865; N=4 | 1409 ± 257.2; N=4 | t(6)=3.628; p = 0.0110 | 297% | 1.10 mm |
| Nucleus Accumbens Core | 430.1 ± 37.61; N=4 | 824.0 ± 124.2; N=4 | t(6)=3.036; p = 0.0229 | 192% | 1.10 mm |
| Caudate Putamen | 63.00 ± 4.123; N=4 | 264.8 ± 18.87; N=4 | t(6)=10.45; p < 0.0001 | 420% | 1.10 mm |
| Lateral Septal Nucleus, Dorsal | 75.50 ± 10.20; N=4 | 212.5 ± 30.67; N=4 | t(6)=4.238; p = 0.0055 | 218% | 1.10 mm |
| Lateral Septal Nucleus, Ventral | 99.50 ± 16.58; N=4 | 388.0 ± 59.14; N=4 | t(6)=4.697; p = 0.0033 | 390% | 1.10 mm |
| Bed Nucleus of the Stria Terminalis, Dorsal | 37.00 ± 5.462; N=4 | 284.0 ± 30.80; N=4 | t(6)=7.896; p = 0.0002 | 767% | 0.14 mm |
| Bed Nucleus of the Stria Terminalis, Ventral | 67.75 ± 14.64; N=4 | 684.5 ± 32.86; N=4 | t(6)=17.15; p < 0.0001 | 1,013% | 0.14 mm |
| Hippocampus, Dentate Gyrus | 318.8 ± 37.67; N=4 | 1493 ± 245.9; N=4 | t(6)=4.720; p = 0.0033 | 468% | -1.58 mm |
| Hippocampus, CA1 | 2.25 ± 2.25; N=4 | 610.8 ± 187.9; N=4 | t(6)=3.238; p = 0.0177 | 27,146% | −1.58 mm |
| Hippocampus, CA3 | 56.50 ± 14.24; N=4 | 230.8 ± 34.02; N=4 | t(6)=4.725; p = 0.0032 | 408% | −1.58 mm |
| Subiculum | 15.72 ± 1.69; N=4 | 54.83 ± 19.67; N=8 | t(10)=1.371; p = 0.2003 | —— | −2.70 mm |
| Hypothalamus, Dorsomedial | 11.27 ± 3.79; N=6 | 342.8 ± 67.28; N=6 | t(10)=4.920; p = 0.0006 | 3,041% | −1.58 mm |
| Hypothalamus, Lateral | 2.35 ± 0.97; N=6 | 81.24 ± 28.99; N=6 | t(10)=2.719; p = 0.0216 | 3,445% | −1.58 mm |
| Amygdala, Basolateral | 102.8 ± 12.39; N=4 | 309.8 ± 31.66; N=4 | t(6)=6.088; p = 0.0009 | 301% | −2.06 mm |
| Amygdala, Basomedial | 89.25 ± 8.625; N=4 | 717.0 ± 86.49; N=4 | t(6)=7.222; p = 0.0004 | 805% | −2.06 mm |
| Amygdala, Central | 86.50 ± 20.16; N=4 | 659.5 ± 85.32; N=4 | t(6)=6.536; p = 0.0006 | 762% | −2.06 mm |
| Substantia Nigra, Pars Compacta | 15.75 ± 2.056; N=4 | 121.5 ± 26.19; N=4 | t(6)=4.026; p = 0.0069 | 717% | −3.52 mm |
| Ventral Tegmental Area | 18.50 ± 1.25; N=4 | 91.50 ± 8.62; N=4 | t(6)=8.374; p = 0.0002 | 495% | −3.52 mm |
| Periaqueductal Gray | 29.25 ± 2.81; N=4 | 94.25 ± 25.50; N=4 | t(6)=2.534; p = 0.0444 | 322% | −2.92 mm |
| Periventricular Nucleus | 2.88 ± 1.02; N=6 | 15.99 ± 4.49; N=6 | t(10)=2.843; p = 0.0174 | 555% | −1.58 mm |
| Dorsal Raphe | 18.75 ± 5.31; N=4 | 154.0 ± 50.95; N=3 | t(6)=3.139; p = 0.0257 | 821% | −4.36 mm |
| Locus Coeruleus | 77.75 ± 13.67; N=4 | 316.3 ± 23.92; N=4 | t(6)=8.657; p = 0.0001 | 406% | −5.40 mm |
3.2 Fluoxetine induction of specific FosB gene products
Although previous work suggests that, in chronic drugs abuse or stress paradigms, only the 35-37 kDa ΔFosB product of the FosB gene is detectable 24 hours after the final drug or stress exposure (Perrotti et al., 2004; Perrotti et al., 2008), it is unknown which FosB gene products accumulate with chronic exposure to fluoxetine. To address this, we used Western blotting to determine which FosB gene products were present after chronic fluoxetine treatment in NAc, PFC, and hippocampus; regions thought to be important in major depressive disorder or antidepressant action (Price and Drevets, 2012). In the NAc, we found that full-length FosB (50-52 kDa), ΔFosB (35-37 kDa), and Δ2ΔFosB (25 kDa) were all significantly upregulated by chronic fluoxetine at the 24 hr time point (Fig 2; FosB: t(16)=5.262; p<0.0001; ΔFosB: t(15)=5.064; p=0.0001; Δ2ΔFosB: t(15)=2.437; p=0.0277). Surprisingly, full-length FosB was most strongly upregulated (2.8-fold). Given that the animals had not received fluoxetine for 24 hours prior to analysis and that the half-life of full-length FosB in cells is thought to be around 1.6 hours (Carle et al., 2007), the data indicate that chronic fluoxetine causes changes in the functioning of NAc neurons that cause them to express all products of the FosB gene in a sustained manner. In the PFC, we found that only full-length FosB and ΔFosB were significantly induced by fluoxetine (Fig 2; FosB: t(16)=2.227; p=0.0407; ΔFosB: t(16)=4.414; p=0.0004), while Δ2ΔFosB remained unchanged. In the hippocampus of control animals, FosB gene product expression was quite low, and fluoxetine treatment caused a significant increase only in the ΔFosB isoform (Fig 2; t(15)=5.387; p<0.0001), though all three isoforms trended toward increase.
Figure 2. Induction of FosB isoforms in select brain regions by chronic fluoxetine.
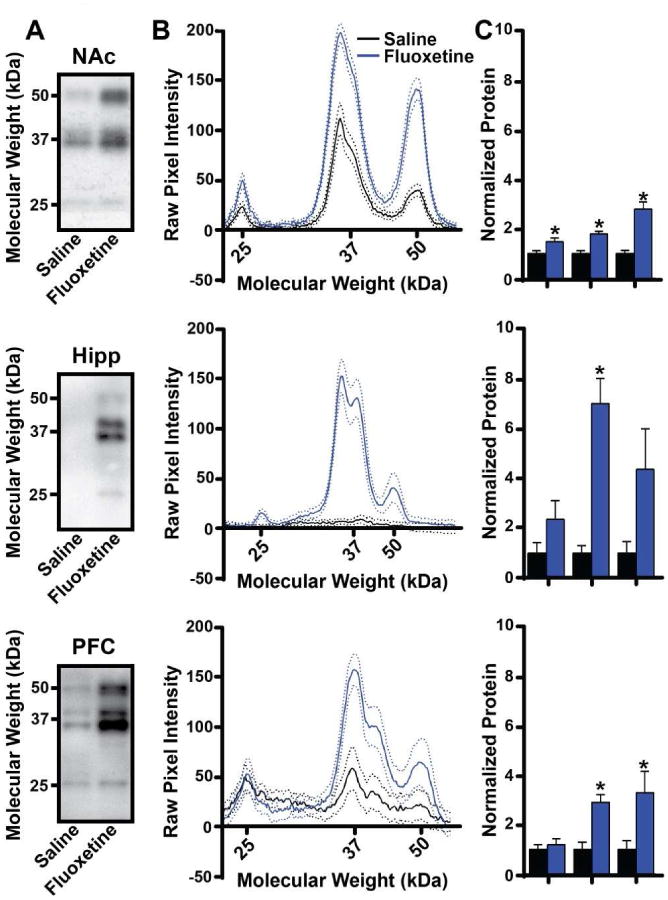
A) Representative western blots of full-length FosB (50-52 kDa), ΔFosB (35-37 kDa), and Δ2ΔFosB (25 kDa) in NAc, hippocampus, and PFC from chronic saline- and fluoxetine-treated animals. B) Plots of average pixel intensity at given molecular weights of Western blots of the indicated brain regions from chronic saline- and fluoxetine-treated animals. Solid lines represent average pixel intensity across the group; dotted lines represent 95% confidence intervals. C) Average protein levels for FosB, ΔFosB, and Δ2ΔFosB in each brain region normalized to saline-treated animals. (n=8-10 mice per group; *: p<0.05; error bars represent SEM)
3.3 Social defeat stress induction of specific FosB gene products
In order to determine whether induction of specific FosB gene products in brain regions related to mood disorders differs between chronic stress and chronic antidepressant treatment, we exposed mice to CSDS (Golden et al., 2011). We exposed 14 mice to CSDS, and three mice were found to be resilient to stress and were dropped from the study. The remaining 11 mice were deemed susceptible (“depressed”) based on the social interaction (SI) test (Krishnan et al., 2007). They exhibited decreased time interacting with a target mouse (Fig 3A; t(15)=7.588; p<0.0001), increased time in the corner zones (Fig 3B; t(15)=2.633; p=0.0188), and a decreased SI ratio (Fig 3C; t(15)=6.879; p<0.0001).
Figure 3. Production of socially defeated mice.
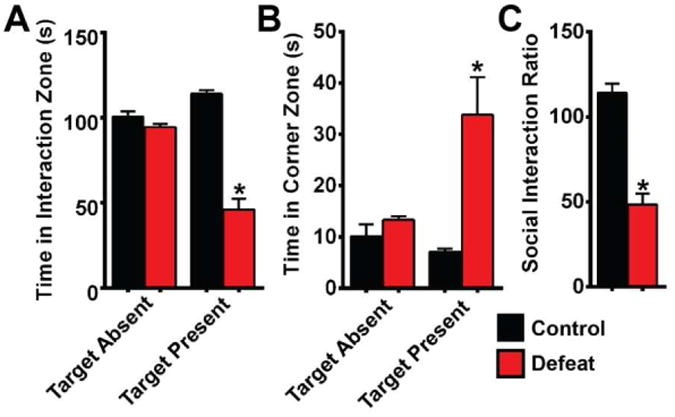
A) Time spent by mice in the social interaction zone with or without a target mouse. B) Time spent by mice in corner zones when a target mouse was or was not present in the interaction zone. C) Social interaction ratio reveals the defeated phenotype in susceptible mice. (n=6-11 mice per group; *: p<0.05; error bars represent SEM)
CSDS in mice is a pharmacologically validated model of major depressive disorder, as chronic, but not acute, treatment with antidepressants (including fluoxetine) reverses the social defeat phenotype (Berton et al., 2006; Krishnan et al., 2007; Vialou et al., 2010). Therefore, we again used Western blotting to determine which FosB gene products accumulate in select brain regions following CSDS. In contrast to chronic fluoxetine exposure, we found that CSDS caused a significant increase in only the ΔFosB isoform in the NAc (Fig 4; t(10)=2.544; p=0.0291), although there was a trend for increased levels of full-length FosB that showed strong variability in the control animals. There was no significant increase in any FosB gene product in the hippocampus in response to CSDS, although this may result from higher levels of all FosB isoforms in the control animals that could be due to experimental design (see Discussion). In the PFC, as in the NAc, we saw significant induction only of the ΔFosB isoform (Fig 4; t(9)=4.447; p=0.0016). These data indicate that CSDS specifically induces ΔFosB in depression-related brain regions, findings that agree closely with previous studies (Vialou et al., 2010).
Figure 4. Induction of FosB isoforms in select brain regions by chronic social defeat stress.
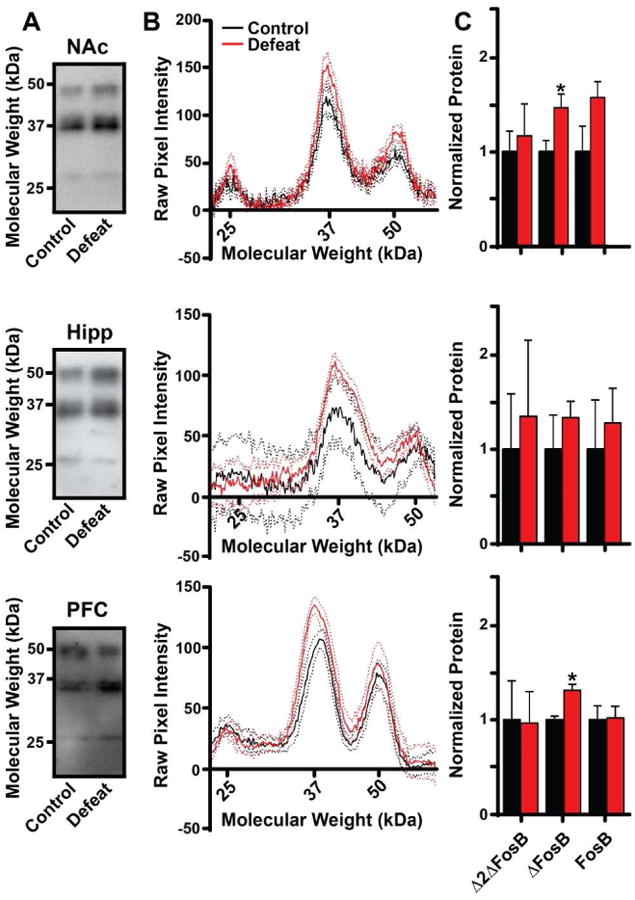
A) Representative Western blots of full-length FosB (50-52 kDa), ΔFosB (35-37 kDa), and Δ2ΔFosB (25 kDa) in NAc, hippocampus, and PFC from control and susceptible animals. B) Plots of average pixel intensity at given molecular weights of western blots of the indicated brain regions from control or susceptible animals. Solid lines represent average pixel intensity across the group; dotted lines represent 95% confidence intervals. C) Average protein levels for FosB, ΔFosB, and Δ2ΔFosB in each brain region normalized to control animals. (n=6-11 mice per group; *: p<0.05; error bars represent SEM)
3.4 Fluoxetine induction of specific FosB gene products in stressed animals
Because the pattern of FosB gene products induced by chronic fluoxetine and chronic stress exposure differ, we sought to determine whether fluoxetine would induce a similar pattern of FosB gene products in stressed and non-stressed animals. We exposed 25 mice to CSDS, and four mice were found to be resilient to stress and were dropped from the study. The remaining 21 mice were deemed susceptible (“depressed”) based on the social interaction (SI) test as they exhibited decreased time interacting with a target mouse (Fig 5, day 1, both defeat groups; F(11, 97)=8.376; p<0.0001). We then began daily fluoxetine or saline treatment as above, and retested social interaction on days 10 and 20 of treatment. We found that after 20 days, fluoxetine-treated animals had social interaction scores that were no longer significantly different from controls, while saline treated animals remained defeated (p<0.05). Importantly, fluoxetine treatment had no effect on the behavior of control animals, as has been previously reported (Berton et al., 2006; Krishnan et al., 2007).
Figure 5. Chronic fluoxetine rescues the social defeat phenotype.
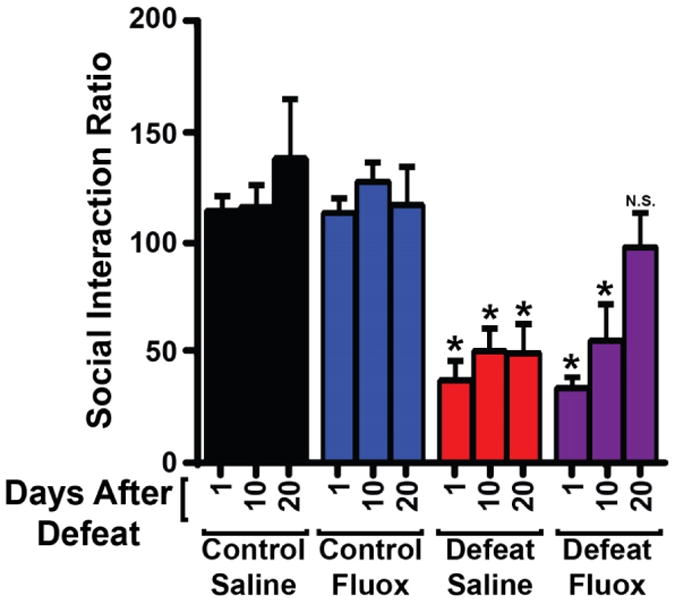
Social interaction ratios of control mice and mice susceptible to defeat after 1, 10, or 20 days of saline or fluoxetine treatment. All defeated mice had reduced social interaction compared to control mice, and this effect was reversed only by 20 days of fluoxetine treatment. (n=8-10 mice per group; *: p<0.05 compared to control saline day 1; error bars represent SEM)
24 hours following the day-20 social interaction test, brains were removed and Western blotting was used to measure the expression of FosB gene products as above. Two-way ANOVA revealed a significant effect of fluoxetine on ΔFosB (F(1,26)=7.065;p=0.0133) but not FosB (F(1,27)=3.721) or Δ2ΔFosB (F(1,25)=0.3145) in NAc; a significant effect of fluoxetine on ΔFosB (F(1,29)=8.471;p=0.0069) and FosB (F(1,29)=6.091;p=0.0197) but not Δ2ΔFosB (F(1,30)=0.4072) in PFC; and a significant effect on ΔFosB (F(1,30)=17.82;p=0.0002), FosB (F(1,32)=5.830;p=0.0216), and Δ2ΔFosB (F(1,32)=8.027;p=0.0079) in hippocampus (Fig 6). No significant effect of stress or interaction between drug and stress was revealed in any brain region for any isoform. It is important to note that, in these animals, protein expression was assessed 20 days after the last defeat episode, and those shown in figure 4 were measured only 24 hours following defeat. Therefore, these data suggest that, though the defeat phenotype can persist 20 days or more (Fig 5 and see (Berton et al., 2006; Vialou et al., 2010)), accumulation of FosB gene products in response to stress does not persist for the same length of time.
Figure 6. Induction of FosB isoforms in select brain regions by fluoxetine in stressed animals.
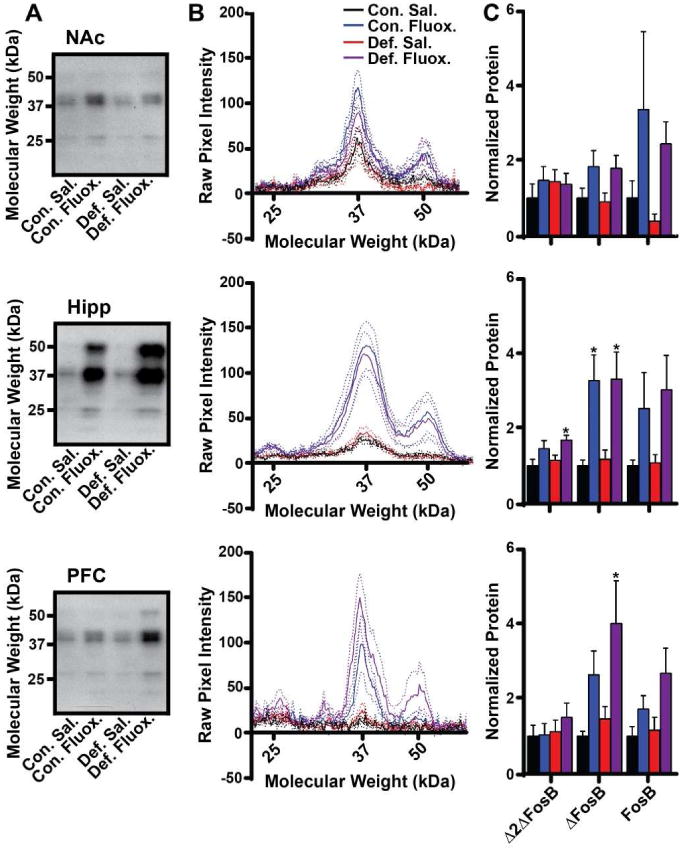
A) Representative Western blots of full-length FosB (50-52 kDa), ΔFosB (35-37 kDa), and Δ2ΔFosB (25 kDa) in NAc, hippocampus, and PFC from control and susceptible animals treated for 20 days after the last defeat episode with daily saline (Sal.) or 20 mg/kg fluoxetine (Fluox.). B) Plots of average pixel intensity at given molecular weights of western blots of the indicated brain regions. Solid lines represent average pixel intensity across the group; dotted lines represent 95% confidence intervals. C) Average protein levels for FosB, ΔFosB, and Δ2ΔFosB in each brain region normalized to control animals treated with saline. (n=8-10 mice per group; *: p<0.05 compared to saline control by Tukey's multiple comparison; error bars represent SEM)
3.4 Correlation of ΔFosB induction with extent of social avoidance
Previous studies, along with data from this study, indicate that ΔFosB in NAc is a key mediator of resilience to CSDS in mice, but that stress itself induces NAc ΔFosB such that susceptible mice also show induction compared to controls (Fig 4 and (Vialou et al., 2010; Lobo et al., 2013)). In order to determine whether there is a direct relationship between induction of any of the FosB isoforms in any of the brain regions tested and the extent of the defeat phenotype, we analyzed the correlation between protein levels and SI ratio in untreated defeated mice 24 hours following the final defeat episode (Fig 7). We found that only the ΔFosB isoform in NAc and PFC showed an inverse correlation with SI ratio (Fig 7; NAc: F(1,11)=14.45; p=0.0029; PFC: F(1,9)=7.83; p=0.0208). These data indicate that, in the PFC and NAc, induction of the “depressive” phenotype is directly correlated with expression of the ΔFosB isoform. Within the NAc, the opposite effects of ΔFosB in promoting resilience under some circumstances, versus being correlated with susceptibility in others, can be explained by the selective induction of ΔFosB within completely distinct neuronal cell types in the NAc of resilient versus susceptible mice (Lobo et al., 2013).
Figure 7. Correlation of FosB isoforms in select brain regions with defeat phenotype.
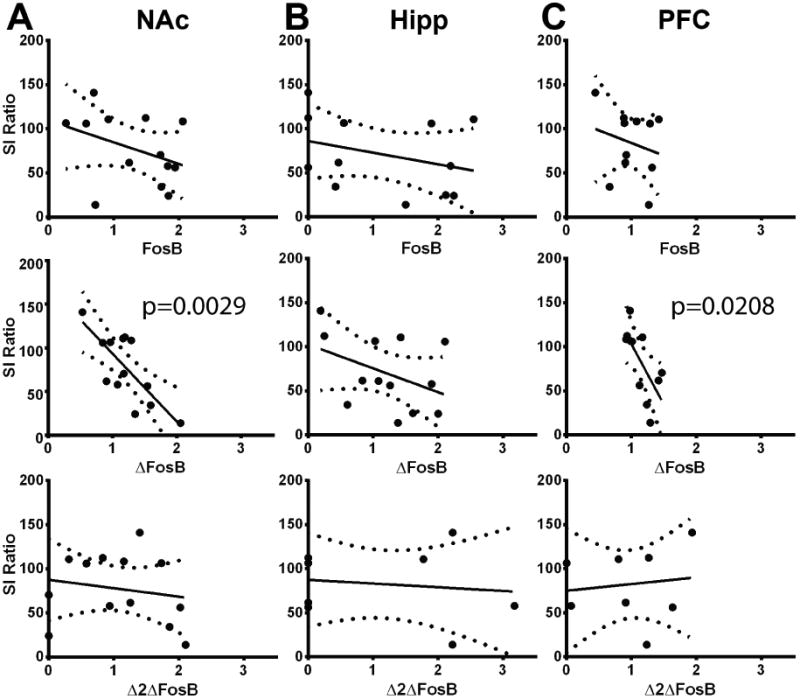
Graphs depict linear regression plots of FosB isoform levels (x-axes) by SI ratio (y-axes) in A) NAc, B) hippocampus, and C) PFC. Dotted lines represent 95% confidence intervals. Slope of linear regression plot differs significantly from 0 where indicated by p value. (n=8-13 mice; NAc ΔFosB, R2= 0.5677; PFC ΔFosB, R2=0.4652).
4. Discussion
Here, we show that FosB gene products are induced throughout the brain by chronic exposure to fluoxetine, and that the specific gene products expressed vary by brain region and between chronic stress and antidepressant treatment. Because antidepressants are administered systemically, they potentially affect signaling throughout the brain. Fluoxetine, a selective serotonin reuptake inhibitor (SSRI), could thus directly affect any brain region in which serotonin signaling occurs. The serotonin transporter (SERT) is expressed on serotonergic nerve terminals that are present throughout the brain, with strong protein levels seen in the raphe nuclei, thalamus, hypothalamus and striatum, including NAc, and moderate levels in the hippocampus and parts of the PFC, particularly cingulate cortex (Saulin et al., 2012). Moreover, because SSRIs like fluoxetine are administered chronically, and indeed require weeks of administration to produce behavioral effects in humans (Culpepper, 2010) and in CSDS mice (Berton et al., 2006), they likely alter the function of brain regions not directly affected by blockade of serotonin reuptake, but that are innervated by regions in which serotonin signaling alters activity. Thus, we did not limit our assessment of FosB-positive cells in response to fluoxetine to brain regions that are especially rich in serotonin signaling, and found that many regions that do not contain high levels of SERT (i.e., motor cortex) showed strong induction of FosB-positive cells in response to fluoxetine. Although this does not necessarily indicate that all of these varied brain regions are integral to the behavioral effects of fluoxetine, it does suggest that exploration of brain region-specific treatments, such as deep brain stimulation in humans (Wani et al., 2013) or gene therapy in pre-clinical models (Lobo et al., 2012), should not necessarily be limited to a small subset of brain areas.
The present study uses daily i.p. injection of fluoxetine to model antidepressant treatment. However, as rodents metabolize fluoxetine much more quickly than do humans (T1/2 is hours in rodents and days in humans – see (Altamura et al., 1994; Jung et al., 2013)), it is likely that daily i.p. injections in mice result in a cycle of serotonin signaling that may differ from the steady-state increase in signaling that may be seen in humans in whom fluoxetine is maintained at effective levels for long periods of time. It is possible that cycling serotonin signaling may result in a different pattern of neural activation and DFosB accumulation than steady state increases, as homeostatic scaling may more strongly dampen effects that are constant (Nelson and Turrigiano, 2008). It will be important to investigate the differences in FosB isoform accumulation in mouse brain regions using additional methods that may more closely mimic clinically observed fluoxetine levels, such as oral or osmotic minipump administration (Pawluski et al., 2014).
In previous studies with chronic exposure to drugs of abuse (Nye et al., 1995), stress (Vialou et al., 2010), or electroconvulsive stimulation (Chen et al., 1995), the major FosB gene product seen in NAc 24 hours after the final treatment is overwhelmingly ΔFosB, and our results with CSDS here show a similar pattern (Fig 4). However, we found that chronic exposure to fluoxetine caused accumulation of multiple FosB gene products in the NAc at 24 hours after the final injection, and were surprised to find that the full-length FosB gene product, which has a half-life in cells of around 1.6 hours (Carle et al., 2007), was strongly induced in NAc under basal conditions (Fig 2) and in hippocampus and PFC in control and stressed animals under social defeat conditions (Fig 6). Because full-length FosB is an immediate early gene product thought to accumulate only when cells are repeatedly activated, these data indicate that chronic treatment with fluoxetine causes a persistent increase in activation of multiple brain regions. This could be a direct result of increased serotonin signaling causing increased cell activation, but may also be the result of increased glutamatergic signaling, possibly due to synergistic glutamatergic signaling between PFC and Hippocampus and into NAc (Robison and Nestler, 2011). Because all three areas show increased FosB gene product accumulation after chronic fluoxetine exposure, it seems likely that the connections between these brain regions are being activated more often leading to increased strength, or even that new connections are being formed between these regions. Future studies that track brain activity longitudinally during chronic stress or antidepressant exposure, perhaps using small animal fMRI, will be useful to determine regional changes in brain activity and the path of their progression throughout the brain during treatment.
Previous studies indicate that ΔFosB is produced throughout the PFC in response to CSDS, and that it accumulates in the prelimbic cortex of susceptible, but not resilient, mice, where it mediates enhanced stress susceptibility through induction of cholecystokinin (CCK) (Vialou et al., 2014). Here, we also saw specific accumulation of ΔFosB in the PFC of susceptible mice, and now report a correlation between PFC accumulation of ΔFosB, but not FosB or Δ2ΔFosB, and the extent of social avoidance (Fig 7). In contrast, chronic fluoxetine treatment caused an accumulation of both ΔFosB and full-length FosB in the PFC (Fig 1 and main effect of drug Fig 6). As systemically-administered fluoxetine clearly promotes enhanced resilience, not susceptibility, to stress, these data suggest that full-length FosB may prevent or counteract the transcriptional effects of ΔFosB in the PFC, perhaps at the level of the CCK receptor gene (Vialou et al., 2014) or through modulation of other genes. Alternatively, the changes caused by fluoxetine in other brain regions may be sufficient to overcome the behavioral effects of ΔFosB in the PFC. Novel tools that allow chromatin immunoprecipitation assays specific to full-length FosB or specific to ΔFosB will be required to determine whether and how FosB products control gene transcription in the PFC in response to chronic fluoxetine treatment, and whether such changes modulate behavior. Expression of specific FosB isoforms in hippocampus has not yet been extensively studied. Ongoing work from our group suggests that spatial learning causes induction of FosB gene products in hippocampal neurons (Eagle et al., 2013), though their function in these neurons is only now being investigated. Here, we demonstrate that chronic fluoxetine causes a very strong induction of FosB isoforms in hippocampus (Fig 2 and 6). Saline-treated control animals, which never left their home cages, had no detectable FosB gene product expression. In contrast, animals exposed to CSDS showed no induction of any FosB gene product, but this is clearly due to the increased basal levels of all three FosB gene products in the CSDS control animals. This difference in basal FosB gene product expression can be explained by the difference in treatment of control animals. While saline-treated control animals never left their home cages, CSDS control animals are placed in novel cages each day that do not contain an aggressor animal (Golden et al., 2011), in order to control for novel environment exposure. Thus, repeated exposure to novel environments, a process known to activate the hippocampus, appears to drive FosB gene product accumulation in this brain region. Ongoing studies will determine whether this FosB gene product expression contributes to spatial learning.
It is interesting to note that animals undergoing CSDS have an elevation of DFosB in the NAc and PFC 24 hours after the final stress episode (Fig 4) but not 20 days after the final stress episode (compare saline-treated control to saline-treated defeat animals in Fig 6). However, the behavior of the animals is similar under these two conditions: the mice show social avoidance both 24 hrs and 20 days after the final stress episode compared to control mice (Figs 3&5). This may indicate that initial changes mediated by FosB gene products are transformed into stable changes in gene expression over time, perhaps through DNA or histone modification, or it may indicate that the effects of ΔFosB in susceptible mice are negligible, and ΔFosB exerts its behavioral effects only in resilient or antidepressant-treated animals.
In the present study, we demonstrate that both chronic stress and antidepressant treatment induce differential expression of FosB gene products in a number of mood- and reward-related brain structures. As deep-brain stimulation of NAc and PFC have been demonstrated to cause antidepressant effects (Schmuckermair et al., 2013; Delaloye and Holtzheimer, 2014), it is clear that understanding the specific gene expression changes in these brain regions that mediate their role in the depressive phenotype will be critical to development of new therapeutic treatments. Although the gene targets of some of these FosB proteins in some brain regions are known and their roles in mood and reward have been studied – for instance, AMPA receptor subunits (Vialou et al., 2010), calcium/calmodulin-dependent protein kinase II (Robison et al., 2013), and the CCKB receptor (Vialou et al., 2014) – uncovering novel gene targets for the individual FosB gene products in each brain region remains a promising avenue for discovery of novel pharmacological targets for intervention in depressive disorders.
Highlights.
- Fluoxetine induces FosB gene products in ∼25 distinct regions of adult mouse brain
- Patterns of FosB gene products induced by fluoxetine differ by brain region
- FosB gene product induction by fluoxetine differs from induction by stress
- Only ΔFosB levels in PFC and nucleus accumbens correlate with behavioral response to stress
Acknowledgments
The research was supported by the Whitehall Foundation (AJR), the Multidisciplinary Training in Environmental Toxicology grant (ALE; T32-ES007255), and a 2014 NARSAD Young Investigator Award from the Brain and Behavior Research Foundation (ALE). The authors would like to thank Kenneth Moon for outstanding technical support.
This work was supported by the National Institute of Mental Health (NIMH) (E.J.N.), and the Whitehall Foundation (A.J.R.).
Footnotes
The authors declare no competing financial interests.
Publisher's Disclaimer: This is a PDF file of an unedited manuscript that has been accepted for publication. As a service to our customers we are providing this early version of the manuscript. The manuscript will undergo copyediting, typesetting, and review of the resulting proof before it is published in its final citable form. Please note that during the production process errors may be discovered which could affect the content, and all legal disclaimers that apply to the journal pertain.
References
- Altamura AC, Moro AR, Percudani M. Clinical pharmacokinetics of fluoxetine. Clinical pharmacokinetics. 1994;26:201–214. doi: 10.2165/00003088-199426030-00004. [DOI] [PubMed] [Google Scholar]
- Berton O, McClung CA, Dileone RJ, Krishnan V, Renthal W, Russo SJ, Graham D, Tsankova NM, Bolanos CA, Rios M, Monteggia LM, Self DW, Nestler EJ. Essential role of BDNF in the mesolimbic dopamine pathway in social defeat stress. Science. 2006;311:864–868. doi: 10.1126/science.1120972. [DOI] [PubMed] [Google Scholar]
- Carle TL, Ohnishi YN, Ohnishi YH, Alibhai IN, Wilkinson MB, Kumar A, Nestler EJ. Proteasome-dependent and -independent mechanisms for FosB destabilization: identification of FosB degron domains and implications for DeltaFosB stability. Eur J Neurosci. 2007;25:3009–3019. doi: 10.1111/j.1460-9568.2007.05575.x. [DOI] [PubMed] [Google Scholar]
- Chen J, Nye HE, Kelz MB, Hiroi N, Nakabeppu Y, Hope BT, Nestler EJ. Regulation of delta FosB and FosB-like proteins by electroconvulsive seizure and cocaine treatments. Mol Pharmacol. 1995;48:880–889. [PubMed] [Google Scholar]
- Culpepper L. Why do you need to move beyond first-line therapy for major depression? J Clin Psychiatry. 2010;71(Suppl 1):4–9. doi: 10.4088/JCP.9104su1c.01. [DOI] [PubMed] [Google Scholar]
- Delaloye S, Holtzheimer PE. Deep brain stimulation in the treatment of depression. Dialogues Clin Neurosci. 2014;16:83–91. doi: 10.31887/DCNS.2014.16.1/sdelaloye. [DOI] [PMC free article] [PubMed] [Google Scholar]
- Duman RS, Aghajanian GK. Synaptic dysfunction in depression: potential therapeutic targets. Science. 2012;338:68–72. doi: 10.1126/science.1222939. [DOI] [PMC free article] [PubMed] [Google Scholar]
- Eagle AL, Gajewski PA, Kennedy PJ, Robison AJ. Role of Hippocampal ΔFosB in Associations of Cocaine with Environment. American College of Neuropsychopharmacology Annual Meeting; Fort Lauderdale, FL. 2013. [Google Scholar]
- Eisch AJ, Petrik D. Depression and hippocampal neurogenesis: a road to remission? Science. 2012;338:72–75. doi: 10.1126/science.1222941. [DOI] [PMC free article] [PubMed] [Google Scholar]
- Flint J, Kendler KS. The genetics of major depression. Neuron. 2014;81:484–503. doi: 10.1016/j.neuron.2014.01.027. [DOI] [PMC free article] [PubMed] [Google Scholar]
- Golden SA, Covington HE, 3rd, Berton O, Russo SJ. A standardized protocol for repeated social defeat stress in mice. Nat Protoc. 2011;6:1183–1191. doi: 10.1038/nprot.2011.361. [DOI] [PMC free article] [PubMed] [Google Scholar]
- Jung E, Kang YP, Yoon IS, Kim JS, Kwon SW, Chung SJ, Shim CK, Kim DD. Effect of permeation enhancers on transdermal delivery of fluoxetine: in vitro and in vivo evaluation. International journal of pharmaceutics. 2013;456:362–369. doi: 10.1016/j.ijpharm.2013.08.080. [DOI] [PubMed] [Google Scholar]
- Kessler RC, Chiu WT, Demler O, Merikangas KR, Walters EE. Prevalence, severity, and comorbidity of 12-month DSM-IV disorders in the National Comorbidity Survey Replication. Arch Gen Psychiatry. 2005;62:617–627. doi: 10.1001/archpsyc.62.6.617. [DOI] [PMC free article] [PubMed] [Google Scholar]
- Krishnan V, et al. Molecular adaptations underlying susceptibility and resistance to social defeat in brain reward regions. Cell. 2007;131:391–404. doi: 10.1016/j.cell.2007.09.018. [DOI] [PubMed] [Google Scholar]
- Lobo MK, Nestler EJ, Covington HE., 3rd Potential utility of optogenetics in the study of depression. Biol Psychiatry. 2012;71:1068–1074. doi: 10.1016/j.biopsych.2011.12.026. [DOI] [PMC free article] [PubMed] [Google Scholar]
- Lobo MK, et al. DeltaFosB induction in striatal medium spiny neuron subtypes in response to chronic pharmacological, emotional, and optogenetic stimuli. J Neurosci. 2013;33:18381–18395. doi: 10.1523/JNEUROSCI.1875-13.2013. [DOI] [PMC free article] [PubMed] [Google Scholar]
- Nelson SB, Turrigiano GG. Strength through diversity. Neuron. 2008;60:477–482. doi: 10.1016/j.neuron.2008.10.020. [DOI] [PMC free article] [PubMed] [Google Scholar]
- Nye HE, Hope BT, Kelz MB, Iadarola M, Nestler EJ. Pharmacological studies of the regulation of chronic FOS-related antigen induction by cocaine in the striatum and nucleus accumbens. J Pharmacol Exp Ther. 1995;275:1671–1680. [PubMed] [Google Scholar]
- Ohnishi YN, Ohnishi YH, Hokama M, Nomaru H, Yamazaki K, Tominaga Y, Sakumi K, Nestler EJ, Nakabeppu Y. FosB is essential for the enhancement of stress tolerance and antagonizes locomotor sensitization by DeltaFosB. Biol Psychiatry. 2011;70:487–495. doi: 10.1016/j.biopsych.2011.04.021. [DOI] [PMC free article] [PubMed] [Google Scholar]
- Pawluski JL, van Donkelaar E, Abrams Z, Houbart V, Fillet M, Steinbusch HW, Charlier TD. Fluoxetine dose and administration method differentially affect hippocampal plasticity in adult female rats. Neural Plast. 2014;2014:123026. doi: 10.1155/2014/123026. [DOI] [PMC free article] [PubMed] [Google Scholar]
- Paxinos G, Franklin KBJ. The mouse brain in stereotaxic coordinates. Compact 2nd. Amsterdam; Boston: Elsevier Academic Press; 2004. [Google Scholar]
- Paxinos G, Franklin KBJ, Franklin KBJ. The mouse brain in stereotaxic coordinates. 2nd. San Diego: Academic Press; 2001. [Google Scholar]
- Perrotti LI, Hadeishi Y, Ulery PG, Barrot M, Monteggia L, Duman RS, Nestler EJ. Induction of deltaFosB in reward-related brain structures after chronic stress. J Neurosci. 2004;24:10594–10602. doi: 10.1523/JNEUROSCI.2542-04.2004. [DOI] [PMC free article] [PubMed] [Google Scholar]
- Perrotti LI, Weaver RR, Robison B, Renthal W, Maze I, Yazdani S, Elmore RG, Knapp DJ, Selley DE, Martin BR, Sim-Selley L, Bachtell RK, Self DW, Nestler EJ. Distinct patterns of DeltaFosB induction in brain by drugs of abuse. Synapse. 2008;62:358–369. doi: 10.1002/syn.20500. [DOI] [PMC free article] [PubMed] [Google Scholar]
- Price JL, Drevets WC. Neural circuits underlying the pathophysiology of mood disorders. Trends Cogn Sci. 2012;16:61–71. doi: 10.1016/j.tics.2011.12.011. [DOI] [PubMed] [Google Scholar]
- Robison AJ, Nestler EJ. Transcriptional and epigenetic mechanisms of addiction. Nat Rev Neurosci. 2011;12:623–637. doi: 10.1038/nrn3111. [DOI] [PMC free article] [PubMed] [Google Scholar]
- Robison AJ, Vialou V, Sun HS, Labonte B, S AG, Dias C, Turecki G, Tamminga C, Russo S, Mazei-Robison M, Nestler EJ. Fluoxetine Epigenetically Alters the CaMKIIalpha Promoter in Nucleus Accumbens to Regulate DeltaFosB Binding and Antidepressant Effects. Neuropsychopharmacology. 2013 doi: 10.1038/npp.2013.319. [DOI] [PMC free article] [PubMed] [Google Scholar]
- Saulin A, Savli M, Lanzenberger R. Serotonin and molecular neuroimaging in humans using PET. Amino Acids. 2012;42:2039–2057. doi: 10.1007/s00726-011-1078-9. [DOI] [PubMed] [Google Scholar]
- Schmuckermair C, Gaburro S, Sah A, Landgraf R, Sartori SB, Singewald N. Behavioral and neurobiological effects of deep brain stimulation in a mouse model of high anxiety- and depression-like behavior. Neuropsychopharmacology. 2013;38:1234–1244. doi: 10.1038/npp.2013.21. [DOI] [PMC free article] [PubMed] [Google Scholar]
- Vialou V, Feng J, Robison AJ, Nestler EJ. Epigenetic mechanisms of depression and antidepressant action. Annual review of pharmacology and toxicology. 2013;53:59–87. doi: 10.1146/annurev-pharmtox-010611-134540. [DOI] [PMC free article] [PubMed] [Google Scholar]
- Vialou V, Bagot RC, Cahill ME, Ferguson D, Robison AJ, Dietz DM, Fallon B, Mazei-Robison M, Ku SM, Harrigan E, Winstanley CA, Joshi T, Feng J, Berton O, Nestler EJ. Prefrontal cortical circuit for depression- and anxiety-related behaviors mediated by cholecystokinin: role of DeltaFosB. J Neurosci. 2014;34:3878–3887. doi: 10.1523/JNEUROSCI.1787-13.2014. [DOI] [PMC free article] [PubMed] [Google Scholar]
- Vialou V, et al. DeltaFosB in brain reward circuits mediates resilience to stress and antidepressant responses. Nat Neurosci. 2010;13:745–752. doi: 10.1038/nn.2551. [DOI] [PMC free article] [PubMed] [Google Scholar]
- Wani A, Trevino K, Marnell P, Husain MM. Advances in brain stimulation for depression. Annals of clinical psychiatry: official journal of the American Academy of Clinical Psychiatrists. 2013;25:217–224. [PubMed] [Google Scholar]