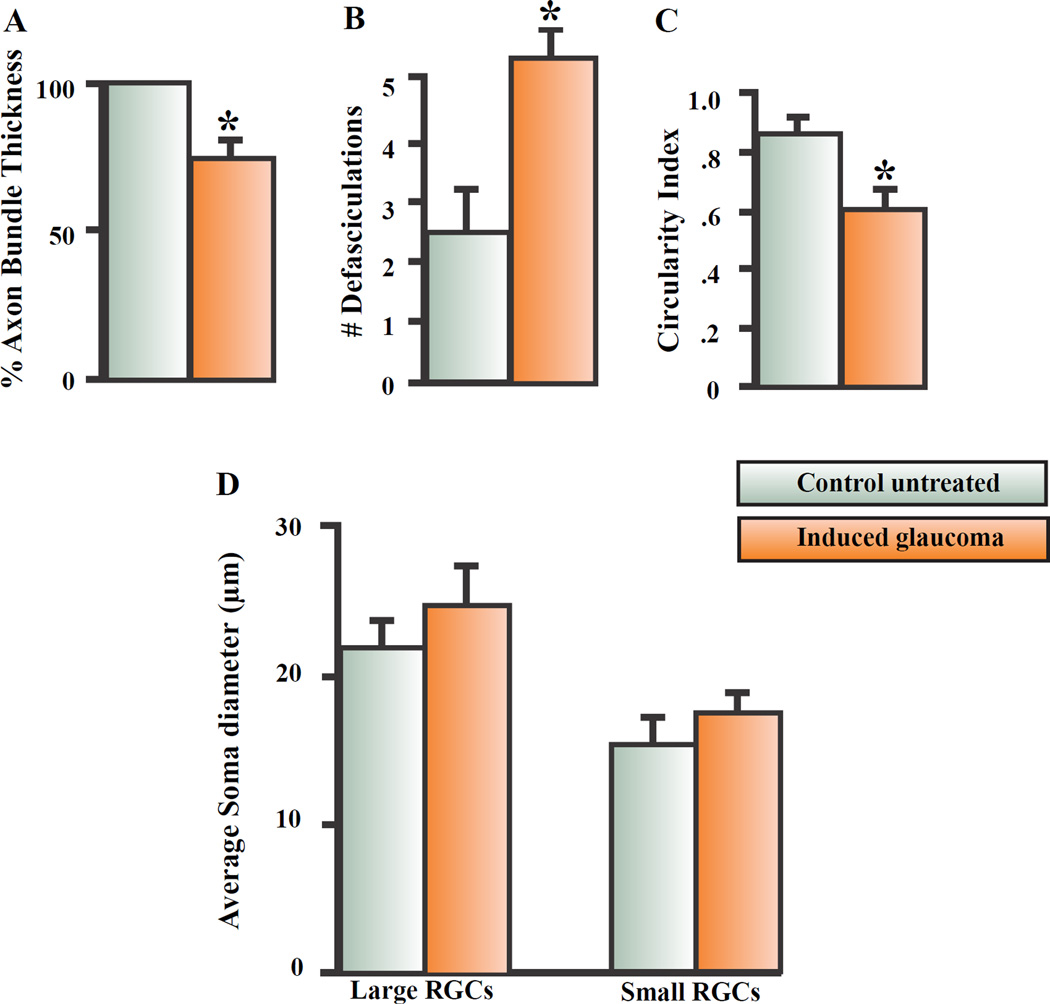
Figure 2.
Summary of effects on nerve fiber layer and RGC morphology. 2A represents the average change in axon bundle thickness that occurred one month after inducing glaucomalike conditions in adult Long Evan rats. 2B summarizes the average effect of defasciculating axon strands off the main axon one month after inducing glaucoma-like conditions. 2C summarizes the average change in RGC soma circularity and 2D represents the average change in large and small RGC soma diameter that occurred one month after inducing glaucoma-like conditions. The star represents significant differences from the control untreated condition. Error bars represent S.E.

