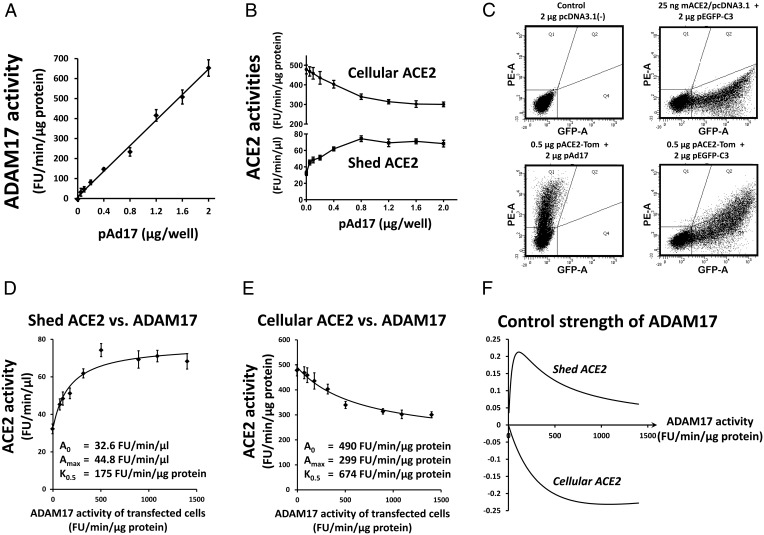
Figure 5.
Determination of the control strength of ADAM17 on ACE2 activity. 832/13 cells were cotransfected with 25 ng/well mACE2/pcDNA3.1 and 2 μg/well of a mix of pAd17 and pAd17E406A. The pAd17 content in the mix were 0, 0.4, 0.8, 1.2, 1.6, and 2 μg/well in four experiments and 0, 0.05, 0.1, 0.2, 0,4, and 2 μg/well in eight experiments. ADAM17 activities (A) and ACE2 activities (B) were measured. C, For estimation of transfection efficiencies, green fluorescent 832/13 cells transfected with 2 μg pEGFP-C3 and 25 ng mACE/pcDNA3.1 were determined as in the upper right panel compared with control cells in the upper left panel. To estimate cotransfection efficiency, cells cotransfected with a plasmid encoding the red fluorescent tdTomato and pAd17 (lower left panel) were compared to cells cotransfected with plasmids for eGFP and tdTomato expression (lower right panel). For the different amounts of pAd17 used in the transfection experiments, shed ACE2 (D) and cellular ACE2 (E) were plotted against the estimated ADAM17 activity of the transfected cells, ie, corrected for the transfection efficiency. Curves describing saturation kinetics were fitted to the data. F, Based on the model fits, the control strengths were calculated and plotted as a function of the ADAM17 activity of transfected cells.

