Significance
The full extent to which centrosome amplification might directly contribute to human disease is poorly understood. We generated a mouse model for the induction of centrosome amplification in the skin, a tissue that remains proliferative even after its development. We uncover defects in stratification of the epidermis during development, which can be attributed to mitotic errors. The skin exhibits remarkable resiliency by clearing out these defective cells via a cell death program, however. Despite sustained centrosome amplification, adult animals are healthy and do not develop tumors or skin abnormalities. Our findings challenge the role for centrosome amplification in the initiation of skin tumorigenesis and demonstrate that certain tissues are better able to cope with its burden.
Keywords: centrosome amplification, epidermal development, Plk4, mitosis
Abstract
As nucleators of the mitotic spindle and primary cilium, centrosomes play crucial roles in equal segregation of DNA content to daughter cells, coordination of growth and differentiation, and transduction of homeostatic cues. Whereas the majority of mammalian cells carry no more than two centrosomes per cell, exceptions to this rule apply in certain specialized tissues and in select disease states, including cancer. Centrosome amplification, or the condition of having more than two centrosomes per cell, has been suggested to contribute to instability of chromosomes, imbalance in asymmetric divisions, and reorganization of tissue architecture; however, the degree to which these conditions are a direct cause of or simply a consequence of human disease is poorly understood. Here we addressed this issue by generating a mouse model inducing centrosome amplification in a naturally proliferative epithelial tissue by elevating Polo-like kinase 4 (Plk4) expression in the skin epidermis. By altering centrosome numbers, we observed multiciliated cells, spindle orientation errors, and chromosome segregation defects within developing epidermis. None of these defects was sufficient to impart a proliferative advantage within the tissue, however. Rather, impaired mitoses led to p53-mediated cell death and contributed to defective growth and stratification. Despite these abnormalities, mice remained viable and healthy, although epidermal cells with centrosome amplification were still appreciable. Moreover, these abnormalities were insufficient to disrupt homeostasis and initiate or enhance tumorigenesis, underscoring the powerful surveillance mechanisms in the skin.
Centrosomes play crucial functions within the cell by organizing microtubules and by participating in the assembly of the primary cilium, an antenna-like structure that senses the cellular environment and transmits signaling cues. On a structural basis, each centrosome consists of orthogonally positioned centrioles and its surrounding protein-rich pericentriolar material (PCM). The majority of mammalian cells contain one centrosome throughout interphase (G1), and then replicate during S-phase of the cell cycle in preparation for mitosis (1). Centrosomes generally template their own duplication, and they keep their numbers in check through tight posttranslational regulation of the duplication process itself. Through licensing mechanisms, centrosomal reduplication is prevented, and by virtue of their role in nucleating a bipolar mitotic spindle, centrosomes are faithfully partitioned into each daughter cell at the end of mitosis (2, 3).
Mutations and misregulation of centrosomal proteins have been associated with various human disorders, including ciliopathies, obesity, neurologic disorders, and miscarriages (4–6). Numerical aberrations in centrosome numbers have been demonstrated to alter ciliary signaling and have been proposed to be the underlying cause for certain defects in tissue organization (7, 8). In addition, recent genetic studies on the master regulator of centrosome number, polo-like kinase 4 (PLK4), have shown that, whether too few or too many, perturbations in centrosome numbers can directly impede brain development, leading to microcephaly both in mice and in humans (9, 10). PLK4 mutations also have been associated with mitotic-origin aneuploidy in human embryos, suggestive of a possible link among PLK4, aneuploidy, and pregnancy loss (6).
Centrosome amplification, or the condition of having more than a cell’s customary pair of such structures, has garnered attention for more than a century (11). Given the enhanced apoptosis resulting from centrosome amplification in the brain, it is intriguing that centrosome amplification was originally noted for its presence in cancer cells (9). Indeed, increased centrosome number is a hallmark of many cancers, and it correlates with poor clinical prognoses in some malignancies, including those of epithelial origin (12, 13). In flies, centrosomal alterations have been found to expand the pool of proliferative progenitors in serial neuroblast transplantation assays, a phenomenon attributed to an imbalance in asymmetric divisions (14, 15). In mammals, however, despite the strong correlation with hyperproliferative disorders, whether centrosomal abnormalities are the cause, the consequence, or a neutral bystander of cancer remains unclear (16, 17).
Based on the assumption that centrosome amplification results in multipolar mitoses, initial research efforts focused on drawing mechanistic links to chromosomal instability (18–20). Surprisingly, however, at least in various cancer cell lines examined in vitro, multipolar divisions turned out to be rare and typically inviable (21). Instead, these cells seemed to have developed strategies to cope with extra centrosomes, including clustering them together such that a bipolar spindle could still form (22–25). That said, even within a bipolar spindle network, chromosome segregation errors involving merotelic attachment have been observed, and these can contribute to chromosomal instability if the mitotic checkpoint is bypassed (21, 26). Taken together, these studies underscore the importance of delving more deeply into the physiological relevance of centrosome amplification in additional mammalian tissues in vivo, and to parse out the centrosomal contribution to tissue function.
Mammalian epidermis offers an excellent opportunity to evaluate the various proposed cellular mechanisms in which centrosome amplification affects tissue development, homeostasis, and tumorigenesis. During embryogenesis, it begins as a single layer of proliferative progenitors, which divide laterally to accommodate embryonic growth, and also perpendicularly to give rise to a stratified, differentiating tissue (27). Only the innermost basal layer retains progenitor status, which relies on integrin-mediated attachment to an underlying basement membrane rich in extracellular matrix. Perpendicular divisions are asymmetric, involving differential Notch and ciliary signaling for proper morphogenesis (28–30). The epidermis matures shortly before birth, and at this stage proliferative basal cells give rise to spinous, granular, and surface stratum corneum cells, which are sloughed and continually replaced by inner cells differentiating upward to maintain homeostasis. In the adult, the epidermis is exposed to a variety of environmental assaults and must undergo frequent turnover to maintain the body’s protective barrier. These features contribute to the skin accounting for the most common cancers worldwide.
In the present work, we evaluated centrosome dysfunction in the context of centrosome amplification in mouse epidermis. To do so, we generated mice that induce PLK4 overexpression in the basal layer. PLK4 is the key to initiating centriole duplication, and at elevated levels, this kinase is capable of replicating more than a single centriole on the existing one (31–34). After establishing that the epidermis acquires an excess of centrosomes, we examined the consequences on growth and differentiation, cilia and Notch signaling, mitotic spindle formation and orientation, mitotic error-induced DNA damage response/aneuploidy, and p53-mediated apoptosis. Finally, because our mice remained viable, we could evaluate the effects of sustained centrosome amplification on tissue integrity. Our findings reveal a remarkable resilience of the skin epidermis in coping with abnormalities induced by centrosome amplification. Moreover, despite the longevity of animals that overexpress PLK4 in the skin epidermis, this did not lead to an increased propensity of these mice to initiate or promote tumorigenesis in the skin.
Results
Conditional Overexpression of PLK4 Induces Centrosome Amplification in the Epidermis.
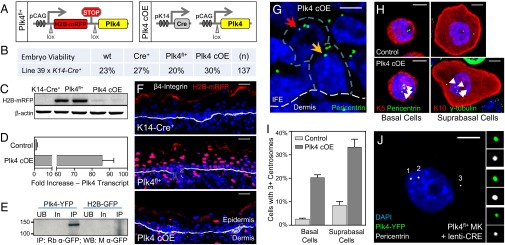
The design of our conditional targeting strategy is shown in Fig. 1A. The transgene consisted of a ubiquitously expressed promoter driving a floxed histone H2B tagged to monomeric red fluorescent protein (H2B-mRFP) reporter followed by a promoterless Plk4 (35). To induce epidermal-specific Plk4 overexpression, transgenic Plk4fl/+ animals were bred to K14-Cre+ mice, which activates Cre recombinase by ∼embryonic day (E) 14.5 in basal progenitors (36).
Fig. 1.
Mice overexpressing Plk4 have extra centrosomes in cells of the interfollicular epidermis (IFE). (A) Transgene expression cassette for the induction of Plk4, and epidermal-specific activation of the transgene. Note that Plk4 contains a YFP tag added to its C terminus, which proved useful in vitro and also for Western blotting, but not epifluorescence imaging, of frozen skin sections. (B) Genotype percentages of F1 generation mice at time of birth when Plk4fl+ animals are mated to mice expressing Cre driven by the epidermal-specific K14 promoter. (C) Immunoblot of transgene reporter H2B-mRFP expression in isolated E17.5 epidermis from corresponding genotypes, with β-actin as a loading control. (D) Quantification by qRT-PCR of Plk4 expression levels in isolated epidermis of eight control and three Plk4 cOE embryos. Error bars indicate SEM. (E) Immunoblot of YFP-tagged Plk4 expressed in cultured keratinocytes and immunoprecipitated using an anti-GFP antibody. H2B-GFP was transfected into keratinocytes as a control for the immunoprecipitation scheme. UB, unbound fraction; In, input fraction; IP, immunoprecipitated fraction. (F) Immunofluorescence images of IFE sections demonstrating expression of the H2B-mRFP reporter in the dermis and epidermis. DAPI is in blue. (Scale bar: 25 μm.) (G) Immunofluorescence images of Plk4-overexpressing skin demonstrating the presence of cells with extra centrosomes in both the basal layer (yellow arrow) and the suprabasal layer (red arrow) of the epidermis, exemplified by the presence of more than two foci marked by pericentrin, a centrosomal marker. The white dashed line represents the basement membrane. The blue dashed line demarcates the cell periphery. DAPI is in blue. (Scale bar: 5 μm.) (H and I) Images (H) and quantification (I) of centrosome number in isolated cells of the basal (K5+) and suprabasal (K10+) layers of the IFE, after dissociation, cytospinning, and immunostaining. Basal cells: eight control and four Plk4 cOE embryos; suprabasal cells: six control and four Plk4 cOE embryos. DAPI is in blue. Error bars represent SEM. (Scale bar: 5 μm.) (J) Immunofluorescence images of primary keratinocytes (MK) cultured from Plk4fl+ mice and infected with lentivirus expressing Cre. These cells express Plk4-YFP and have extra centrosomes, as numbered and depicted in the enlarged panels (top to bottom, 1–3). (Scale bar: 10 μm.)
Plk4fl+;K14-Cre+ (Plk4 cOE) mice were viable at birth and remained healthy (Fig. 1B). Cre-dependent activation of Plk4 was substantiated by the loss of expression of H2B-mRFP in epidermal cells where the K14 promoter is known to be active (Fig. 1C). Quantitative RT-PCR (qRT-PCR) showed a >80-fold increase in Plk4 at the transcriptional level, validating the overexpression (Fig. 1D). Moreover, we tagged the Plk4 transgene with yellow fluorescent protein (YFP), and although we were unable to detect the epifluorescence in frozen skin sections, we did note a band of expected size for PLK4-YFP in Western blots of protein immunoprecipitated from cultured keratinocytes (Fig. 1E). Epidermal-specific loss of H2B-mRFP throughout the tissue was >92% complete by E17.5 (Fig. 1 C and F).
Importantly, by E17.5, overexpression of PLK4 in the developing skin led to the presence of epidermal cells with extra centrosomes, visualized by pericentrin immunolabeling of skin sections (Fig. 1G). Immunolabeling keratinocytes dissociated from epidermal tissue afforded more accurate quantification of centrosome numbers (Fig. 1H). The smaller basal cell keratinocytes were readily distinguished from their larger suprabasal counterparts. Overall, there was an ∼20% increase in the numbers of basal and suprabasal cells displaying signs of centrosome amplification (Fig. 1I). In addition, PLK4-YFP colocalized with the extra centrosomes when cultured primary keratinocytes derived from Plk4fl+ epidermis were transduced with lentivirus harboring Cre recombinase (Fig. 1J).
Centrosome Amplification Produces a Growth Defect in the Stratified Layers of the Epidermis.
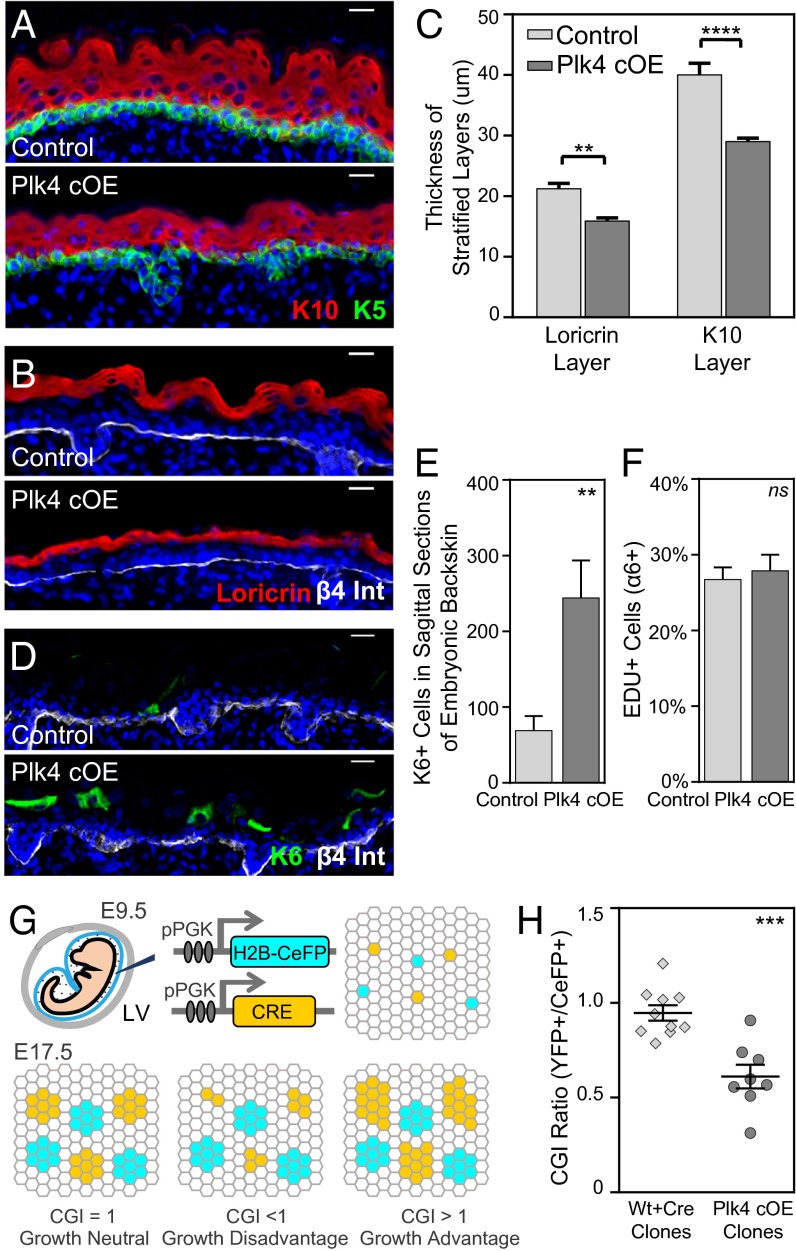
Having established an in vivo mouse model to ascertain the consequences of centrosome amplification, we proceeded to evaluate epidermal development. Stratification commences at E12.5, when the first suprabasal cells appear (28). By E17.5, terminally differentiating cells occupy several spinous layers and a granular layer. Plk4 cOE embryos induced epidermal differentiation and stratification on cue, analogous to control tissue (either wt or a K14-Cre+ or Plk4fl+ transgenic background). Similarly, markers for each of these compartments [keratin5 (K5), basal layer; keratin10 (K10), spinous layer; loricrin, granular layer] were all expressed in their appropriate layers (Fig. 2 A and B). That said, at E17.5, both spinous and granular layers were thinner relative to their normal compartments (Fig. 2C). This was accompanied by suprabasal expression of keratin6 (K6), a marker induced in many disease states in which homeostasis is perturbed (Fig. 2 D and E) (37).
Fig. 2.
Growth and stratification is impaired in embryonic epidermal tissue with extra centrosomes. (A–C) Immunofluorescence images and quantifications of reduced stratification in the spinous layer (K10+) and granular layer (Loricrin+) of E17.5 Plk4 cOE epidermis compared with control (seven control and four Plk4 cOE embryos). DAPI is in blue. Error bars represent SEM. (Scale bar: 20 μm.) (D and E) Immunofluorescence images and quantification of induced K6 expression in E17.5 epidermis (seven control and four Plk4 cOE embryos). DAPI is in blue. Error bars represent SEM. (Scale bar: 20 μm.) (F) Quantification of EdU+ cells of FACS-sorted epidermal cell population in E17.5 back skin (31 control and 10 Plk4 cOE embryos from three litters). Error bars represent SEM. (G) Schematic summary of the CGI assay. A combination of lentiviruses, one expressing Cre and the other expressing CeFP, was injected into the amniotic sac of embryos (either wt or Plk4fl+) with a Rosa26 lox-STOP-loxYFP/+ background to transduce the epidermis on a clonal scale at E9.5. The outgrowth of the clones was evaluated at E17.5 by FACS, and the ratio of YFP+/CeFP+ was calculated to obtain a CGI. (H) Calculated CGI ratios of R26YFP;wt and R26YFP;Plk4fl+ embryos transduced with Cre to produce wt/Cre and Plk4 cOE clones (10 wt and 8 Plk4fl+ embryos from two litters). Error bars indicate SEM.
To further understand the nature of the aberrant homeostasis, we labeled mice with nucleotide analog 5-ethynyl-2′-deoxyuridine (EdU) for 4 h and then analyzed the skin for actively cycling S-phase cells. Surprisingly, however, we found no significant differences between Plk4 cOE epidermal cells and control genotypes (Fig. 2F).
One possible explanation consistent with the data at hand is that Plk4 overexpression affected epidermal cells in a heterogeneous fashion, such that a growth defect in some of the cells was offset by proliferation of neighbors. To address this possibility, we used our in utero lentiviral delivery system in which purified virus was injected into amniotic sacs of E9.5 embryos to transduce the single-layered epithelium (38). We injected progeny from a mating of Rosa26 Lox-STOP-LoxYFP/YFP to Plk4fl+/wt with a combination of two low-titer lentiviruses at equal proportion. One of these viruses expressed H2B-mCerulean (CeFP) as an internal injection control, and the other expressed Cre recombinase to induce Plk4 overexpression on a clonal scale, which would be marked by YFP. The ratio of YFP+ cells to CeFP+ cells should reflect a measure of growth advantage or disadvantage (Fig. 2G), yielding a cellular growth index (CGI) score (39).
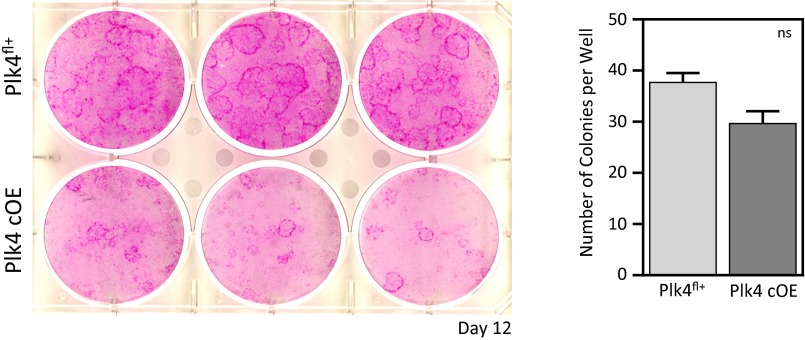
At 8 d after injection, the CGI was 0.58 in Plk4 cOE clones, indicating a clear growth and/or viability disadvantage (Fig. 2H). These findings were also supported in vitro by colony-forming assays in which Plk4 cOE cells formed ∼20% fewer and smaller colonies (Fig. S1). Given that proliferation rates within the tissue were unchanged, we attribute this disadvantage to a loss of viability in Plk4-overexpressing cells, an issue that we will revisit.
Fig. S1.
Colony formation efficiency is not altered in Plk4 cOE cells, but smaller colonies indicate growth deficiency. Colony formation assays from cultured keratinocytes comparing growth capabilities of either control (Plk4fl+; n = 3 embryos) or Plk4-overexpressing cells (Plk4 cOE; n = 3 embryos). Error bars represent SEM.
Multiple Cilia Can Occur in Epidermal Cells with Extra Centrosomes, but These Do Not Impinge on Global Activation of NOTCH Signaling Within Differentiating Tissue Layers.
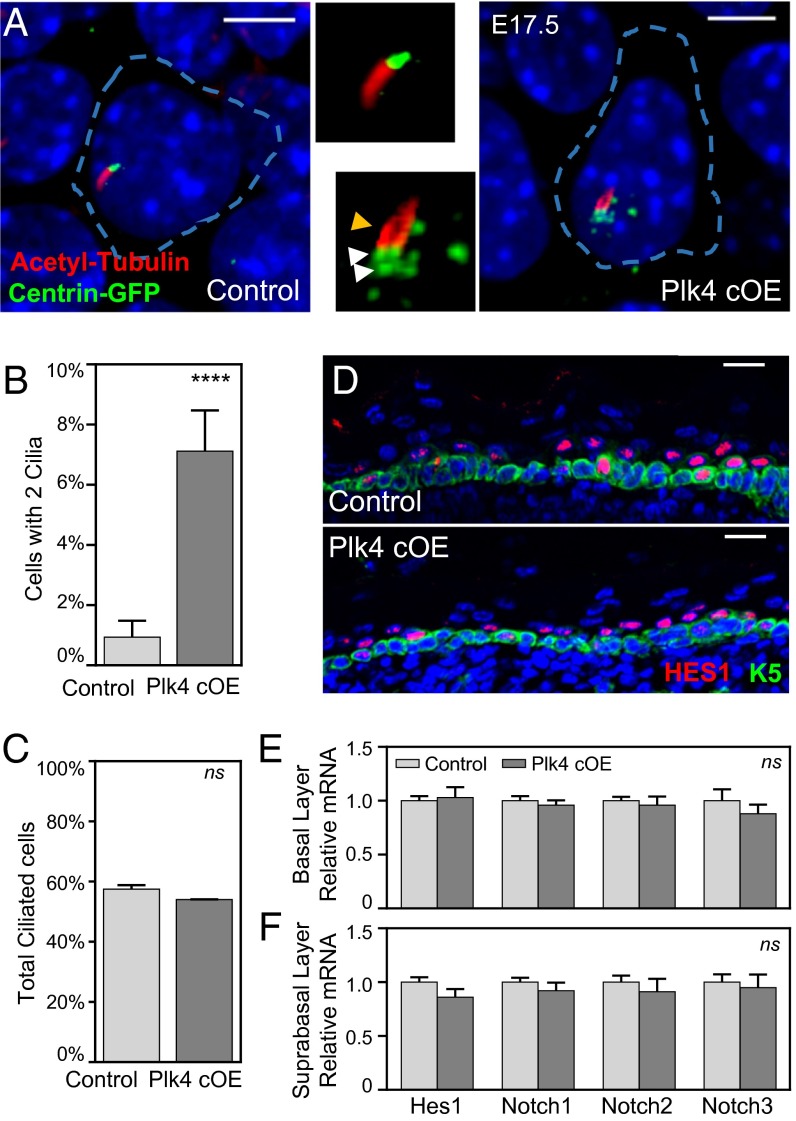
To identify the underlying root of the defective epidermal stratification, we turned to the ascribed cellular functions of centrosomes, first addressing ciliagenesis and ciliary signaling. Because the older centrosome constitutes the basal body from which the primary cilium forms (40), we evaluated whether ciliary morphology is perturbed in cells with supernumary centrosomes. We visualized cilia by staining for acetylated α-tubulin in whole-mounted E17.5 epidermis isolated from transgenic mice expressing centrin-GFP (28). A second appendage emanating from a nearby centriole was detected in only a few (7%) epidermal cells, with no overall difference in ciliated cell numbers (Fig. 3 A–C).
Fig. 3.
Centrosome amplification induces morphological defects in cilia in a small fraction of cells, with no global effect on Notch signaling. (A) Immunofluorescence images with enlarged panels of E17.5 whole-mount epidermis depicting cells with extra centrosomes that have a second cilium emanating from a nearby centriole. White arrowheads point to extra centrosomes; the yellow arrowhead points to second cilium. Blue dashed lines mark cell boundaries based on E-cadherin staining. DAPI is in blue. (Scale bar: 5 μm.) (B) Quantitation of the number of cilia per basal cell; 320 control and 365 Plk4 cOE cells were counted from at least two embryos. Error bars indicate SEM.) (C) Quantitation of the total number of ciliated cells in the basal layer; 161 control and 180 Plk4 cOE cells were counted from at least two embryos. Error bars indicate SEM. (D) Immunofluorescence images of HES1 within the E17.5 epidermis demonstrates unperturbed Notch pathway activation. DAPI is in blue. (Scale bar: 20 μm.) (E and F) Quantification of Notch by qRT-PCR of purified basal epidermal cells (E) and suprabasal cells (F) from 12 control and 4 Plk4 cOE embryos. Error bars represent SEM.
Extra cilia perturb sonic hedgehog signaling and epithelial organization in spheroid cultures of kidney cells (7), whereas loss of cilia (29) in skin also perturbs NOTCH signaling, which in turn affects epidermal differentiation (30, 41–43). That said, these few superciliated cells did not compromise NOTCH signaling globally within the epidermis, based on a normal immunofluorescence pattern of HES1, a downstream target of NOTCH, and by the lack of changes in Notch or Hes1 expression by qRT-PCR (Fig. 3 D–F). Irrespective of whether or not the small fraction of cells with extra cilia themselves may have had defective NOTCH signaling, this did not appear to account for the gross changes in epidermal thickness and CGI arising from Plk4 cOE.
Spindle Orientation Within the Epidermis Is Affected by the Presence of Extra Centrosomes in the Absence of NOTCH Signaling Defects.
Given the multifaceted roles for centrosomes in mediating spindle orientation and cell fate specification now being uncovered (14, 44–47), we next examined whether asymmetric cell divisions were affected in Plk4 cOE epidermal tissue. Before stratification, the majority of the divisions within the epidermis are oriented parallel to the basement membrane and compose symmetric divisions. Stratification is then concomitant with a shift in mitotic spindle orientation (28, 48, 49). By E17.5, perpendicular spindle orientations relative to the basal epidermal plane are accompanied by asymmetric cell divisions, giving rise to selective suprabasal NOTCH signaling (30). Guiding this shift in spindle orientation is polarization of the basal cells, with the polarity marker PAR3 localized to the apical surface and demarcating the cortical assembly site of ACD machinery proteins LGN, mINSC, and NuMA (28, 30, 49, 50).
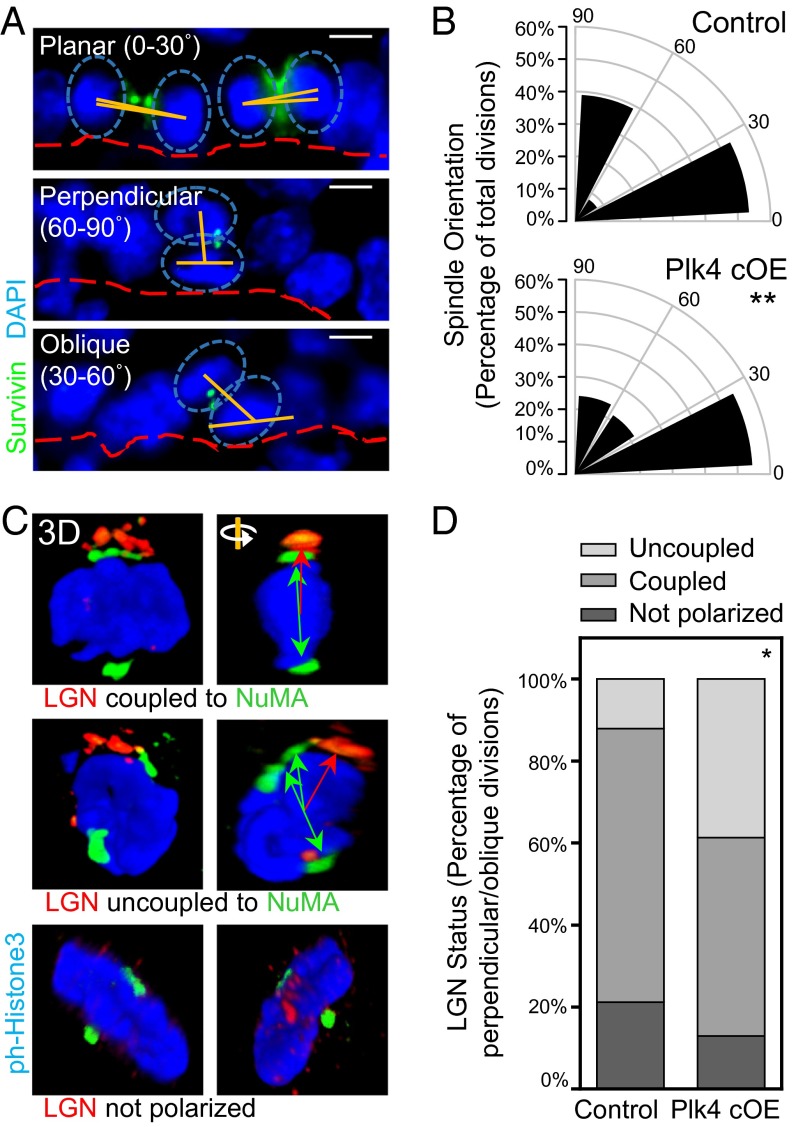
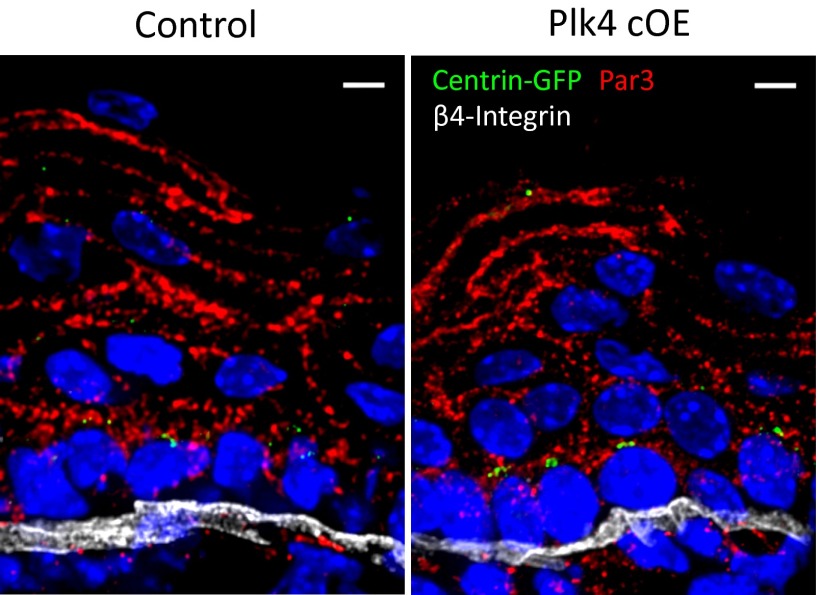
We first addressed whether an imbalance in symmetric versus asymmetric divisions could be noted in cells with extra centrosomes. We measured the orientation of the mitotic spindle relative to the basement membrane in E17.5 dividing basal cells (Fig. 4 A and B). Although the proportion of symmetrically dividing cells remained intact, asymmetric divisions were skewed from a robust perpendicular alignment toward a more oblique orientation (30°–60°). To identify the underlying cause of the observed spindle orientation defect, we scrutinized whether the apicobasal polarity of the epidermis was altered, and found that PAR3 localization at the apical membrane was unchanged, and centrosomes remained apically situated (Fig. 1G and Fig. S2).
Fig. 4.
Centrosome amplification induces defects in spindle orientation by uncoupling the spindle from cortical cues. (A and B) Immunofluorescence images (A) and quantification (B) of IFE basal cells undergoing planar, perpendicular, and oblique divisions, as determined by the angle of spindle orientation (90 control and 79 Plk4 cOE divisions from three embryos each). The proportion of perpendicularly oriented spindles is skewed toward oblique orientations in Plk4 cOE tissue. Cells were stained for β4-integrin to mark the basement membrane, and with survivin to mark the linkage between two dividing cells in either anaphase or telophase. Spindle orientation was measured by the relative angle (orange lines) between the two centers of mass of DNA (blue ovals) and the basement membrane (red dashed lines). Statistical significance was established with Fisher’s exact t test. (Scale bar: 5 μm.) (C and D) Immunofluorescence images with 3D confocal reconstruction (C) and quantification (D) of LGN crescents and relative NuMA localization (69 control and 67 Plk4 cOE mitotic cells from three embryos each.) In wt skin, asymmetric cell divisions, accompanied by NOTCH/HES1 suprabasal signaling, occur when the two are coupled. In Plk4 cKO skin, there is a greater fraction of cells in which the two are uncoupled. Green double-headed arrows represent the orientation of spindle poles, and red arrows represent the corresponding alignment with the cortical LGN crescent. Statistical significance was established with Fisher’s exact t test.
Fig. S2.
Centrosome amplification does not induce defects in apicobasal polarity. Immunofluorescence images of E17.5 epidermis demonstrating that apicobasal polarity is intact in Plk4 overexpressing tissue. DAPI is in blue: (Scale bar: 5 μm.)
We then examined the localization of NuMA and LGN both at the spindle poles and in the apical crescent. Despite the shift in spindle orientation, LGN was still apical and cortical; however, the spindle poles were no longer coupled to LGN in the cortical cap (Fig. 4 C and D). These data, together with our finding of intact suprabasal HES1, suggest that NOTCH signaling and fate commitment were retained in Plk4 cOE epidermis. These features are in contrast to what occurs upon depletion of LGN or NuMA (30), and make it unlikely that the alterations in spindle orientations could account for the diminished stratification in the Plk4 cOE epidermis.
Chromosome Segregation Errors During Mitosis Lead to DNA Damage, Aneuploidy, and P53-Mediated Cell Death.
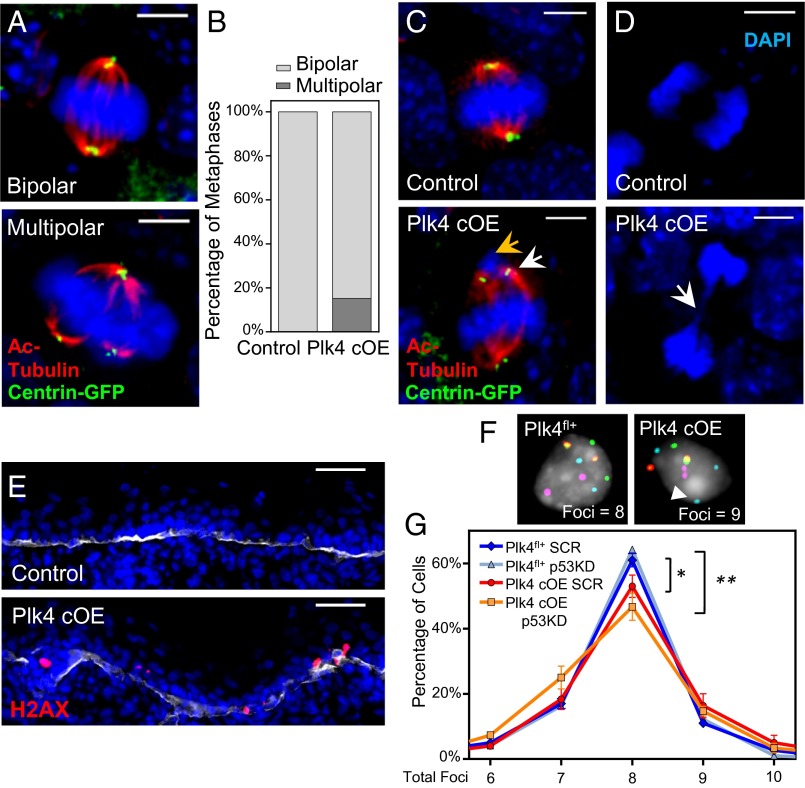
Because the perturbations in ciliary signaling and spindle orientation did not seem sufficient to account for the centrosome amplification defects within the Plk4 cOE epidermis, we focused on the classical mitotic roles of centrosomes, namely bipolar spindle formation and chromosome segregation. Quantification of spindles in metaphase spreads of whole-mount tissue revealed that ∼15% of mitotic cells were in a multipolar configuration (Fig. 5 A and B). Although centrosomal clustering might have resolved some of these spindles into a bipolar arrangement during metaphase progression, we still observed chromosome attachment errors, indicative of defective mitosis.
Fig. 5.
Centrosome amplification induces mitotic errors during cell division in the IFE, resulting in DNA damage and aneuploidy. (A, C, and D) Immunofluorescence images of mitotic cells in E17.5 whole-mounted epidermis. Images highlight multipolar mitoses in cells with extra centrosomes (A), misaligned chromosomes (yellow arrow) resulting from the formation of bipolar spindles when extra centrosomes cluster together (white arrow) (C), and chromatin bridges (white arrow) of sheared chromosomes (D). DAPI is in blue. (Scale bar: 5 μm.) (B) Quantification of mitotic cells at the metaphase stage in either bipolar or multipolar configuration; 32 control and 33 Plk4 cOE mitotic cells, from two embryos each. (E) Immunofluorescence images of epidermis stained for γ-H2AX as a measure of DNA damage. DAPI is in blue; β4-integrin is in white. (Scale bar: 40 μm.) (F and G) Representative images (F) and quantification (G) of FISH analysis using four chromosomal probes to gauge aneuploidy, measured by the presence of more than two or less than two foci per probe (white arrowhead); 100+ cells scored from each of three embryos per genotype/shRNA. Plk4 cOE cells have an increased frequency of aneuploid cells, which is further exacerbated when p53 levels are reduced. Error bars represent SEM.
In particular, we noted syntelically oriented chromosomes, in which the kinetochores of the chromosome are attached to spindles likely emanating from the same pole (Fig. 5C). Attachments of this sort can be generated in advance of proposed merotelic attachment, in which a single kinetochore is attached to tubules emanating from both poles (21). We also observed the presence of chromatin bridges in anaphase cells, possibly arising from the shearing force of microtubules pulling apart incorrectly tethered chromosomes (Fig. 5D).
To assess the cellular damage that chromosome segregation errors might be imparting on proliferative epidermal cells, we assayed for DNA damage and aneuploidy as indicators of chromosomal instability. Immunolabeling for the modified histone γ-H2AX revealed wide-spread DNA damage foci within the basal layer (Fig. 5E), consistent with the notion that DNA damage is acquired as a consequence of chromosome attachment errors (51). To assess the extent of aneuploidy, we used fluorescence in situ hybridization (FISH) against four chromosomes, with the expectation that euploid cells would have two foci for each probe. Epidermal cells from E17.5 Plk4 cOE embryos displayed an 8.1% increase in the frequency of mismatched probes compared with Plk4fl+ littermate controls (Fig. 5 F and G). Taken together, these data indicate that centrosome amplification induces mitotic defects in the epidermis, which in turn cause DNA damage and aneuploidy in the proliferative basal cell population.
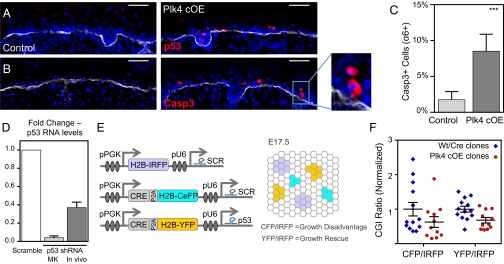
To account for the loss of viability of Plk4 cOE cells measured in our CGI assay (Fig. 2H), we asked whether cells that had accumulated DNA damage and aneuploidy were undergoing cell death. This was particularly pertinent considering that the equivalent rates of EdU incorporation among control and Plk4 cOE tissues seemed to discount a role for G1-based cellular senescence (Fig. 2F). Supporting this conclusion, both nuclear p53 protein and cleaved (activated) caspase-3 were readily detected in the basal and first suprabasal layers of the Plk4 cOE epidermis (Fig. 6 A–C). Often two adjacent cells were immunolabeled, suggestive of divisions that may have gone awry (Fig. 6B; boxed region, enlarged at right). Based on these data, we surmise that aneuploidy and/or DNA damage subsequent to multipolar mitoses activates a p53-dependent apoptotic pathway as a means of removing these cells from the tissue.
Fig. 6.
Centrosome amplification induces p53-mediated activation of caspase-3, but reduced p53 levels rescue growth deficiency only minimally. (A and B) Immunofluorescence images of E17.5 IFE, stained for p53 (A) and cleaved caspase3 (B) to mark the apoptotic cells. Apoptotic cells can often be found adjacent to each other (Inset), suggesting a recent division. DAPI is in blue; β4-integrin is in white. (Scale bar: 40 μm.) (C) Quantification of apoptotic cells in purified epidermal cells; 30 control and 12 Plk4 cOE embryos from three litters. Error bars represent SEM. (D) Quantification of p53 knockdown efficiency in cultured keratinocytes (in vitro) and in cells isolated from embryos (in vivo) by qRT-PCR. (in vitro, three replicate experiments; in vivo, four embryos each of with and without knockdown. Error bars represent SEM. (E) Schematic of the modified CGI assay to assess the growth capacity of Plk4 cOE clones in a p53 knockdown background compared with scramble control. A combination of three lentiviruses was injected as depicted, with H2B-IRFP serving as an internal control. (F) Calculated CGI ratios of either wt (n = 11) or Plk4fl+ (n = 13) embryos transduced with Cre to produce wt/Cre or Plk4 cOE clones. Error bars represent SEM.
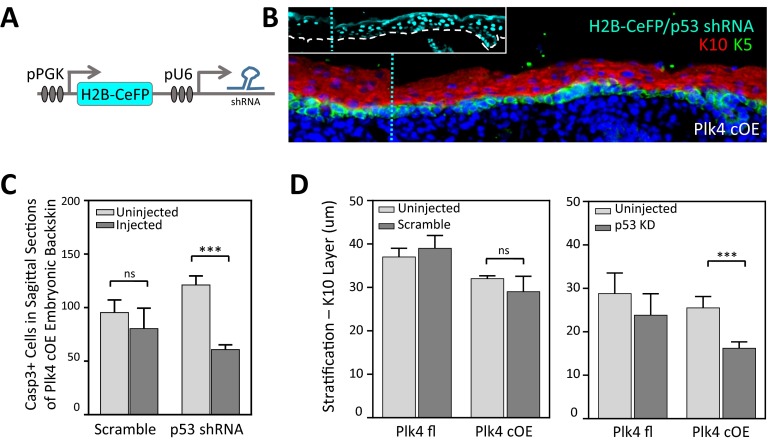
To further probe the contribution of p53 in the removal of cells with DNA alterations, we transduced Plk4 cOE embryos in utero with a lentivirus expressing a H2B-CeFP reporter and a Trp53 shRNA (Fig. S3 A and B), which was effective in reducing p53 levels in vitro and in vivo (Fig. 6D). Transduced E17.5 embryos exhibited reduced numbers of caspase-3+ epidermal cells (Fig. S3C), consistent with partial rescue of damaged cells from cell death. Surprisingly, however, the epidermis was even thinner in Trp53 shRNA-transduced Plk4 cOE skin than in Plk4 cOE skin alone (Fig. S3D). Cells of Trp53 shRNA-transduced Plk4 cOE embryos displayed a further increase in aneuploid cells (Fig. 5G), possibly accounting for the phenomenon. Our findings recapitulate similar observations during brain development, in which the knockout of Trp53 in combination with centrosome amplification reportedly causes premature differentiation in neurons (9).
Fig. S3.
p53 knockdown does not rescue stratification defect. (A) Schematic of shRNA-expressing lentiviral constuct to transduce epidermis, with CeFP reporter. (B) Immunofluorescence image of lentivirus-infected Plk4 cOE epidermis with p53 knockdown. (Inset) Regions of low and high infectivity, delineated by the blue dashed line. DAPI is in blue. (C and D) Quantification of apoptotic cells in sagittal sections (C) and spinous layer stratification (D) in embryos transduced with lentivirus expressing either Scramble control or p53 shRNA. Error bars represent SEM.
To further assess the growth potential of Trp53 shRNA-transduced Plk4 cOE cells, we next modified our CGI assay to compare the growth potential of Plk4 cOE cells that also express either a scrambled shRNA (SCR) or a Trp53 shRNA. We added a Cre-P2A-H2B-CeFP (SCR) and Cre-P2A-H2B-YFP (Trp53) bicystronic reporter to these two lentiviral vectors for the purpose of clonal analyses of transduced progeny, and used an H2B-IRFP lentivirus harboring the SCR hairpin as an internal control. We then transduced the epidermis of either wt or Plk4fl+ embryos with a combination of these three lentiviruses, each at low titer (Fig. 6E). In this iteration of the CGI assay, we anticipated, and indeed observed (CGI = 0.52), that the ratio of CeFP+ to IRFP+ cells reproduced the growth impairment of Plk4 cOE clones compared with wt. In contrast, the ratio of YFP+ to IRFP+ cells revealed the extent of Trp53KD rescue efficiency. Our calculated CGI ratio of 0.65 indicates a small and insignificant rescue (Fig. 6F). These findings suggest that although p53 is involved in activating apoptosis to clear away cells that have accumulated DNA damage and aneuploidy, additional mechanisms exist to detect and remove these cells. Given the diversity of chromosomal abnormalities, that a greater rescue was not achieved is not so surprising.
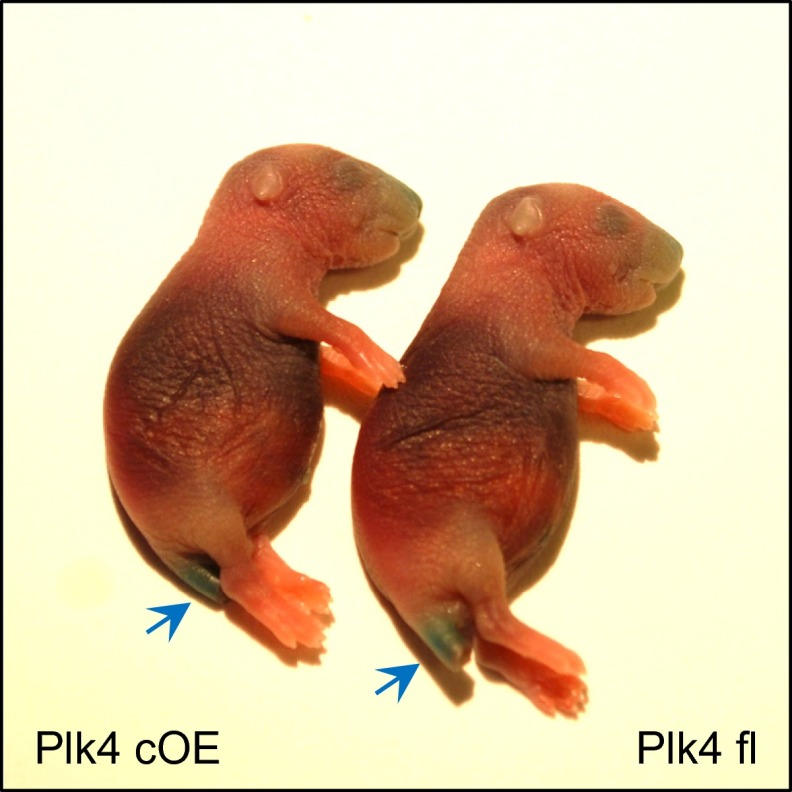
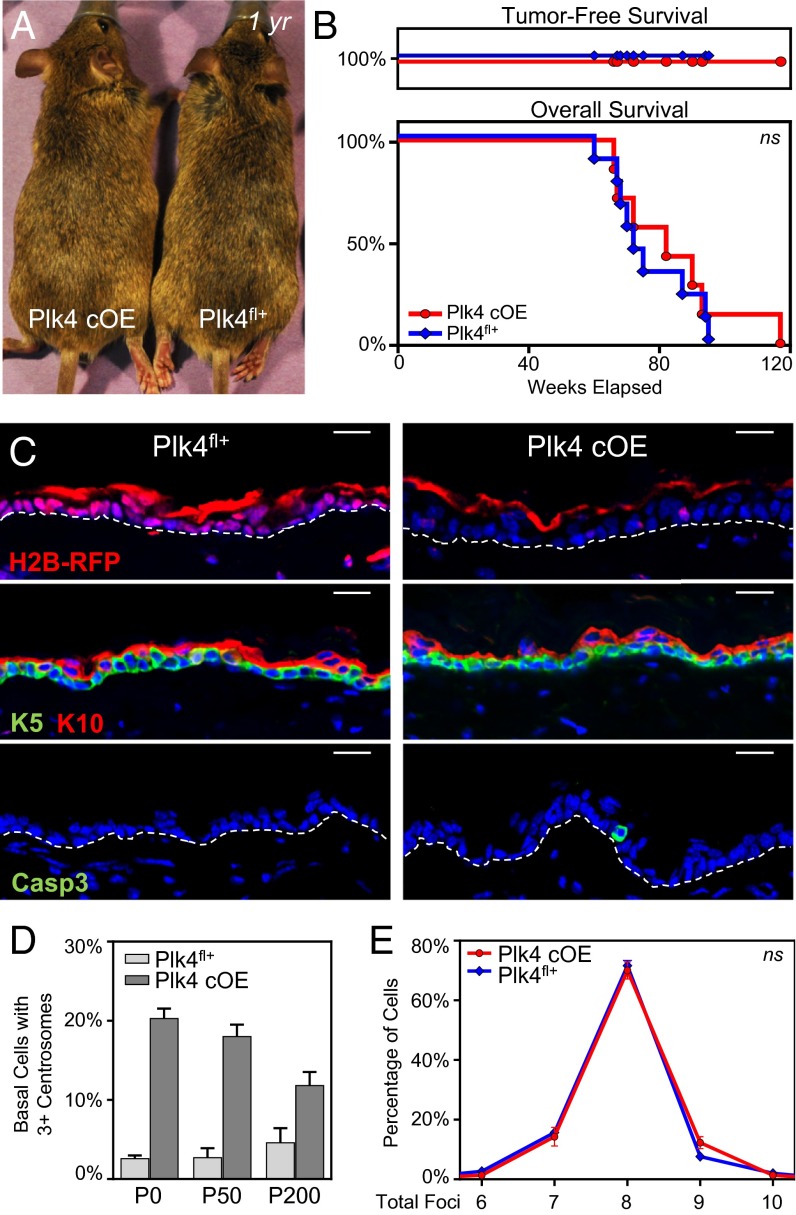
Despite the marked thinning of the epidermis in embryos, Plk4 cOE animals remained viable after birth, had a functional barrier (Fig. S4), and had similar longevity as their Plk4fl+ littermates (Fig. 7 A and B). These features allowed us to assess whether prolonged maintenance of cells with extra centrosomes could lead to a proliferative advantage in an otherwise unperturbed genetic background. Skin and hair in the aged Plk4 cOE mice were visually normal and devoid of notable defects in follicle morphogenesis. Moreover, the animals showed no signs of spontaneous tumor development during their lifetime (Fig. 7 A–C).
Fig. S4.
Skin barrier function is not compromised in animals overexpressing Plk4. Images of Plk4fl+ and Plk4 cOE newborn pups subjected to outside-in barrier assay. Compromised epidermis stains blue, as observed in the clipped tail segment (blue arrow). Absence of stain denotes a functional barrier.
Fig. 7.
Plk4 cOE adult mice do not develop spontaneous tumors and have normal skin and hair. (A) Images of mice aged 1 year with a full hair coat, demonstrating normal hair and skin. (B) Kaplan–Meier curves of tumor-free (Upper) and overall (Lower) survival of aged Plk4 cOE mice (nine Plk4fl+ and seven Plk4 cOE animals). (C) Immunofluorescence images of epidermis from aged mice stained for mRFP to demonstrate transgene expression, K5 and K10 to highlight the epidermal layers, and caspase3 to mark apoptotic cells. White dashed lines depicts basement membrane. DAPI is in blue. (Scale bar: 20 um.) (D) Quantification of centrosome number in basal cells of adult mice at postnatal time points P0 (eight Plk4fl+ and four Plk4 cOE animals), P50 (three Plk4fl+ and three Plk4 cOE P50 animals), and P200 (three Plk4fl+ and three Plk4 cOE animals). Error bars represent SEM. (E) Aneuploidy analysis by FISH in epidermal cells isolated from aging mice; 100+ cells scored from each of three animals per genotype. Error bars represent SEM.
Further analysis of the Plk4 cOE adult epidermis revealed maintenance of the transgene in aging animals (Fig. 7C). Additionally and importantly, cells with extra centrosomes were still present, albeit at a decreasing frequency over time (Fig. 7D). Only occasional cleaved caspase-3+ cells were seen in aging Plk4 cOE epidermis, however (Fig. 7C). The reduced number of apoptotic cells in adult skin likely reflects the tempered rates of basal cell proliferation necessary to balance the rate of turnover required for tissue maintenance. Their presence suggests that Plk4 cOE cells that still cycle and encounter chromosome segregation errors undergo caspase-mediated cell death and are removed from the tissue. Supporting this conclusion, FISH analysis of epidermal cells from aged animals revealed no differences in the frequency of aneuploid cells detected in Plk4 cOE animals and their Plk4fl+ control littermates (Fig. 7E). From these data, we conclude that surveillance mechanisms exist within the tissue to remove cells with chromosomal defects.
Finally, we asked how our Plk4 cOE mice might respond when challenged with a proliferative stimulus. For this, we turned to the classical skin carcinogenesis model in which topical application of the chemical mutagen 7,12-dimethylbenz(a)anthracene (DMBA) is followed by multiple applications of the tumor-promoter 12-O-tetradecanoyl-phorbol-13-acetate (TPA) (52). In Vitre et al., we show that Plk4 cOE animals do not enhance chemical carcinogenesis-induced tumorigenesis. Whether centrosome amplification might promote skin malignancy at later stages is an interesting question beyond the scope of the present study. Based on our present findings, however, we conclude that the skin epithelium is equipped with robust surveillance mechanisms, involving but not exclusive to p53, that would need to be crippled for this to happen.
Discussion
Being naturally proliferative during embryogenesis and in adult mice, the skin epidermis provided an excellent model for studying the direct consequences of centrosome amplification on tissue development and maintenance. Our findings show that like cancer cell lines in vitro (22–25), epidermal keratinocytes have intrinsic coping strategies for extra centrosomes, facilitating the formation of a bipolar spindle; however, as has been shown with other cells (21, 26), potentially harmful chromosome segregation errors can still occur in epidermal keratinocytes that harbor excess centrosomes.
Indeed, we found not only chromosomal segregation defects, but also defects in ciliary formation and spindle orientation in the developing epidermis. Remarkably, however, in the face of sustained centrosome amplification, epidermal tissue architecture remained intact, differentiation-promoting NOTCH signaling was only minimally affected, and barrier function was established. This resilience and the ability not only to survive, but also to develop into healthy mice, could not exist without additional surveillance mechanisms that enable the epidermis to cope with this excess of centrosomes.
The first clues to the presence of additional coping strategies came from our CGI assays of mosaic Plk4 cOE animals showing a clear growth disadvantage in Plk4 cOE clones despite the lack of change in basal cell proliferation. Considering that ciliary and spindle orientation defects did not appear to sufficiently account for the thinning of embryonic stratified layers or the growth disadvantages that we measured, we considered the possibility that cell death might be occurring and counterbalanced by proliferation. This indeed proved to be the case.
Both in vivo and in vitro, centrosome amplification is deleterious to the individual wt cells. In addition, it is becoming increasingly clear, based on both our own in vivo studies on the embryonic and adult epidermis and studies of others on neuronal development, that this can impart a growth disadvantage to the tissue at large, unless a mechanism is in place to clear the tissue of dysfunctional cells and replace them with cells in which divisions occurred without crisis. For the skin epidermis, regardless of the gamut of cellular defects observed, the loss of fidelity in chromosome segregation initiates a cell death program to effectively rid defective cells from tissue.
In the epidermis as in cell lines in culture (53, 54), the roots of cleaved caspase-3–mediated apoptosis in cells coping with extra centrosomes stems, at least in part, from DNA damage and the subsequent activation of p53. That said, at least from our lentiviral Trp53 knockdown studies in vivo, this did not fully rescue the apoptotic defects that we observed. We cannot rule out the possibility that low levels of p53, below our limit of detection, were sufficient to activate the apoptotic machinery in the Plk4 cOE epidermis. That said, given the multitude of different defects surfacing in our epidermal cells with amplified centrosomes, it seems equally plausible that the skin epidermis has an additional, as-yet unidentified backup mechanism for clearing out damaged cells.
Indeed, from our studies, it seems most likely that although p53 can enable the further accumulation of aneuploid cells in the short term within the tissue, the cumulative defects do not permit the cells to cycle indefinitely. In this regard, our findings complement those of Marthiens et al. (9), who showed that p53 can suppress cell death in neurons with extra centrosomes, but that this ultimately promotes tissue degeneration. Irrespective of the underlying mechanism, this behavior is in stark contrast to that of cultured cancer cells, where removal of p53 can overcome cell cycle arrest and facilitate reentry into mitosis in both aneuploid cells and cells with extra centrosomes (21, 55, 56).
Our results highlight both the commonalities and differences in how complex tissues can handle defects arising from centrosome amplification. In the case of neuronal tissue, multipolar divisions lead to microcephaly, with death occurring soon after birth (9); however, the skin seems more tolerant to chromosome segregation errors and aneuploidy (57) and is able to perform its barrier function despite an initial stratification shortage.
A priori, epigenetic silencing of the Plk4 transgene could have been a contributing factor to tolerance. The reduction in basal cells with excess centrosomes did not change dramatically with age, however, suggesting that other mechanisms account for the difference. Spindle orientation defects in the skin did not lead to a loss of basal cells, where the balance of symmetric and asymmetric divisions may have contributed to tissue survival. Postdevelopment, the rate of turnover is also considerably slower in the adult epidermis than in the embryo, which, along with additional clearance mechanisms, may ensure the maintenance of homeostasis.
Finally, the tolerance of the skin to maintaining cells with extra centrosomes allowed us to test whether centrosome amplification per se can initiate tumorigenesis, and then whether the epidermis can still cope with centrosomal amplification when proliferation is enhanced. The lack of spontaneous tumors in the adult Plk4 cOE skin argues against the tumor-initiating potential of centrosome amplification in this tissue. The lack of enhanced tumorigenesis in our Plk4 cOE mice in response to chemical carcinogenesis also suggests that the epidermis can still cope with its excess centrosomes (35).
Our findings help reshape our view of why centrosome amplification is so intricately associated with cancer. If a tumor-initiating role is excluded, could it be a driver of tumorigenesis once sufficient genetic mutations have been acquired? In the case of Ras-induced tumors of the DMBA/TPA model, centrosome amplification was again insufficient to enhance tumor growth or to push benign papillomas into more aggressive and invasive squamous cell carcinomas, as we show in the accompanying paper (35). Whereas p53 may increase survival, this pathway also seemed insufficient to unleash any tumorigenic effects of centrosomal amplification. Rather, our findings that even in embryonic Plk4 cOE skin, only 20–30% of cells had more than two centrosomes, and that the reduction in cells with excess centrosomes did not change dramatically with age, merit consideration. Based on this line of reasoning, we surmise that unleashing the deleterious effects of centrosomal amplification on cancer will be rooted in mechanisms that not only endow the cells with an enhanced ability not only to survive and proliferate, but to do so with an increased capability of resolving chromosomal segregation without triggering a crisis.
Materials and Methods
Mice.
Plk4fl+ transgenic animals were derived on a C57BL/6 background and are described in greater detail in Vitre et al. Plk4 floxed animals were maintained either as fl+/wt or fl+/fl+ (double copy). Animals were mated to K14-Cre (CD1) to generate Plk4 cOE mice (36). Additional strains used included Rosa Lox-STOP-Lox YFP (58), and K14-Centrin-GFP (28). Mice were housed and cared for in an Association for Assessment and Accreditation of Laboratory Animal Care-accredited facility, and all animal experiments were conducted in accordance with Institutional Animal Care and Use Committee-approved protocols.
Cell Culture.
Primary mouse keratinocytes were isolated from dispase-treated back skin from wt and Plk4fl+ mice, and then cultured with E medium containing 15% FBS and 50 μM CaCl2. Cells were maintained at 7.5% CO2 environment at 37 °C and infected with lentivirus encoding for Cre recombinase, scramble control, or shRNA hairpins.
Immunofluorescence and Antibodies.
For sagittal sections, whole embryos were embedded fresh-frozen in OCT mounting medium. Embryos were sliced into 10- to 12-μm sections using a Leica cryostat, mounted onto Superfrost Plus slides (VWR), and fixed in 4% paraformaldehyde (PFA) in PBS. For whole-mount preparation, dissected back skin was treated with dispase to separate away the dermis, and then floated onto 4% PFA/PBS for fixation. Tissue was immunostained as described previously (29), and then mounted with ProLong Gold Antifade with DAPI.
Antibodies used for immunofluorescence included guinea pig anti-RFP (1:2,000 dilution; E. Fuchs), chicken anti-GFP (1:2,000; Abcam), rabbit anti-pericentrin (1:1,000; Covance), mouse anti–γ-tubulin (1:500; Sigma-Aldrich), mouse anti-acetylated tubulin (1:500; Sigma-Aldrich), rabbit anti-survivin (1:1,000; Cell Signaling), guinea pig anti-LGN (1:500, E. Fuchs), rabbit anti-NuMA (1:250; Abcam), rabbit anti-Par3 (1:200; Millipore), rat anti–phospho-H3 (1:300; Sigma-Aldrich), rabbit anti–phospho-H2AX (1:300; Cell Signaling), rat anti–β4-integrin (1:1,000; BD Biosciences); rat anti–E-cadherin and guinea pig anti-K5 (1:500; E. Fuchs), rabbit anti-K10 (1:1,000; Covance), rabbit anti-loricrin (1:3,000; Covance), rabbit anti-K6 (1:1,000; E. Fuchs); rabbit anti-HES1 (1:500; E. Fuchs); rabbit anti-p53 (1:200; Leica); and rabbit anti-cleaved caspase-3 (1:500; Cell Signaling). When superimposed on images, dermis-to-epidermis boundaries (white dashed lines) were delineated by staining the basement membrane with β4-integrin. Cell borders (blue dashed lines) were distinguished based on E-cadherin staining.
Imaging and Image Processing.
Images were captured using a Zeiss AxioPlan2 widefield microscope with Plan Apochromat 20×/0.8 or 63×/1.4 objective, a Zeiss AxioObserver Z.1 wide-field microscope with an ApoTome.2 structured illumination system for optical sectioning and Plan Apochromat 20×/0.8 and 63×/1.4 objectives, a PerkinElmer Volocity spinning disk confocal with a Nikon CFI Plan Apochromat 60×/1.4 objective, and a Zeiss Inverted LSM 780 laser scanning confocal microscope with a 63×/1.4 objective. Images were processed using Fiji software. When Z-stacks were generated, images were maximally projected to produce a single composite image with structures and foci in focus.
Flow Cytometry, EdU, and Casp3 Quantification.
Dispase-treated and trypsin-dissociated single epidermal cell suspensions were stained with a dead cell exclusion marker DAPI (Sigma-Aldrich), TO-PRO-3 (Fisher Scientific), or LIVE/DEAD staining kit (Molecular Probes); cell surface markers α6/CD49f (clone GoH3), CD34 (clone RAM34), CD117 (clone 2B8), CD45 (clone A20), CD140a (clone APA5) and either a Click-iT EdU Flow Cytometry Assay Kit (Molecular Probes) or an Active Caspase-3 Apoptosis Kit (BD Biosciences), according to the manufacturer’s protocol. Samples were acquired on an LSRII flow cytometer (BD Biosciences) and processed using FlowJo software. Plots were gated on α6/CD49f+ live cells (basal cells), with exclusion of CD34+ cells (bulge cells), CD117+ cells (melanocytes), CD45+ cells (immune cells), and CD140a+ cells (fibroblasts), before analyzing frequencies of Edu+ cells, caspase-3+ cells, or fluorescent reporter. Cells were similarly sorted and collected using a BD FACSAria and processed for RNA, FISH, or cytospin/immunofluorescence.
Lentiviral Constructs, Infections and Injections.
Production, concentration, transduction, and ultrasound-guided in utero delivery of lentivirus have been described in detail previously (38, 59). The lentiviruses described herein code for iCre recombinase with NLS sequence, shRNAs, and histone H2B conjugated to mCerulean, yellow, or infrared fluorescent proteins, and were cloned into a modified pLKO vector backbone. shRNAs with the greatest knockdown efficiency were cloned into a pLKO vector backbone encoding for a designated fluorescent reporter.
shRNAs, RNA Quantification, and qRT-PCR.
Trp53 shRNA (5′-CCACTACAAGTACATGTGTAA-3′), and scramble hairpin (5′-CAACAAGATGAAGAGCACCAA-3′) were obtained from the Broad Institute’s Lentiviral TRC library, and were tested for knockdown efficiency in keratinocytes. Cells were harvested after 48 h of 2 μM puromycin selection. RNA was isolated using the Direct-zol RNA MiniPrep Kit (Zymo Research), and cDNA was produced using a SuperScript III First-Strand Synthesis System (Invitrogen). Knockdown efficiency was tested by qRT-PCR using a SYBR Green PCR MasterMix (Applied Bioscience). Gene transcript levels were normalized against peptidylprolyl isomerase B (PPIB) to calculate ΔΔCt values, and quantified using the following oligos (5′-3′): PPIB (GTGAGCGCTTCCCAGATGAGA, TGCCGGAGTCGACAATGATG), Plk4 (GGTTCTTCATTCTTCCCTATAATCG, ACAGCAGCTTGGGTCCAC), Notch1 (CAAACTGGCCTGGGTGGGGACAT, AAAAGGCCAGAAAGAGCTGCCCTGAG), Notch2 (GCAGCCGGAGCTCCCCAGACG, GTCCCCGCTGACCGCCTCCAC), Notch3 (TGAGCTTGGGAAATCTGCCTTACA, CTTCTTGCCCCGACCACGAGTTCC), Hes1 (AGTGGTGCCGGCTCCTGA, TTCCGCCACGGTCTCCAC), and Trp53 (GCAACTATGGCTTCCACCTG, TGAGGGGAGGAGAGTACGTG).
Western Blot and Immunoprecipitation Analyses.
Samples for Western blot analyses were prepared by resuspending cells in RIPA buffer with protease inhibitors, sonicating briefly, and then boiling for 10 min. Cell lysates were loaded for equal protein content. Immunoprecipitations were performed using Dynabeads Protein G Immunoprecipitation Kit (Novex/Life Technologies) according to the manufacturer’s protocol, and samples were loaded for equal volume. Antibodies used include rabbit anti-GFP (Invitrogen), mouse anti-GFP (Roche), rabbit anti-RFP (MBL), and mouse anti–β-actin (Sigma-Aldrich).
FISH Analysis.
α6/CD49f+CeFP+ sorted single-cell suspensions were obtained from E17.5 embryos injected with either CeFP-H2B-scramble or CeFP-H2B-p53shRNA lentivirus at E9.5. Cells from adult mice (age 1 y) were obtained from collagenase- and trypsin-treated biopsy specimens and sorted as described above. Cells, either embryonic or adult, were adhered to coverslides using a cytospin. Samples were air-dried, fixed in methanol:acetic acid at a 3:1 ratio, and gradually dehydrated in ethanol (70–85–100%) for 2 min at room temperature. In situ hybridization was performed by the Memorial Sloan-Kettering Cytogenetics core facility using probes generated against chromosomes 4, 12, 16, and 17 and conjugated to spectrum red/orange/green/and aqua fluorophores. Cells were stained for DAPI as well.
Quantification and Statistical Analysis.
Epidermal thickness was calculated as described previously (30) and quantified using Metamorph software. Spindle orientation quantification was performed as described previously (50). In brief, sagittal sections were stained for survivin to mark cells in anaphase and telophase, with β4-integrin to mark the basement membrane, and with DAPI to stain DNA. Angles of division were drawn in relation to the basement membrane directly basal to the dividing cells and the center of the two segregated masses of DNA. Angles were quantified using Fiji software. Angles were binned into categories using GraphPad Prism software and graphically represented using Origins 2015 software.
Statistical analysis was performed using GraphPad Prism software. An unpaired t test was applied except where nothed otherwise. Significant differences between two groups were denoted by asterisks (*P < 0.05; **P < 0.01; ***P < 0.001; ns, not significant).
Acknowledgments
We thank N. Stokes, L. Polak, D. Oristian, and J. Levorse for their valuable assistance with animal husbandry and lentiviral injections; members of the Fuchs laboratory, Y. Ge, R. Adams, and I. Matos for their help with certain phases of the research; and A. Mertz for assistance with statistics. We also thank the Rockefeller Flow Cytometry Resource Center and Bioimaging Facilities and the Memorial Sloane Kettering Cytogenetics Core. A.K. was funded by a Jane Coffins Child Postdoctoral Fellowship. This work was supported by a MERIT award to E.F. from the National Institutes of Health (Grant R37-AR27883).
Footnotes
The authors declare no conflict of interest.
This article contains supporting information online at www.pnas.org/lookup/suppl/doi:10.1073/pnas.1518376112/-/DCSupplemental.
References
- 1.Nigg EA, Stearns T. The centrosome cycle: Centriole biogenesis, duplication and inherent asymmetries. Nat Cell Biol. 2011;13(10):1154–1160. doi: 10.1038/ncb2345. [DOI] [PMC free article] [PubMed] [Google Scholar]
- 2.Tsou MF, Stearns T. Mechanism limiting centrosome duplication to once per cell cycle. Nature. 2006;442(7105):947–951. doi: 10.1038/nature04985. [DOI] [PubMed] [Google Scholar]
- 3.Fırat-Karalar EN, Stearns T. The centriole duplication cycle. Philos Trans R Soc Lond B Biol Sci. 2014;369(1650):20130460. doi: 10.1098/rstb.2013.0460. [DOI] [PMC free article] [PubMed] [Google Scholar]
- 4.Bettencourt-Dias M, Hildebrandt F, Pellman D, Woods G, Godinho SA. Centrosomes and cilia in human disease. Trends Genet. 2011;27(8):307–315. doi: 10.1016/j.tig.2011.05.004. [DOI] [PMC free article] [PubMed] [Google Scholar]
- 5.Nigg EA, Raff JW. Centrioles, centrosomes, and cilia in health and disease. Cell. 2009;139(4):663–678. doi: 10.1016/j.cell.2009.10.036. [DOI] [PubMed] [Google Scholar]
- 6.McCoy RC, et al. Common variants spanning PLK4 are associated with mitotic-origin aneuploidy in human embryos. Science. 2015;348(6231):235–238. doi: 10.1126/science.aaa3337. [DOI] [PMC free article] [PubMed] [Google Scholar]
- 7.Mahjoub MR, Stearns T. Supernumerary centrosomes nucleate extra cilia and compromise primary cilium signaling. Curr Biol. 2012;22(17):1628–1634. doi: 10.1016/j.cub.2012.06.057. [DOI] [PMC free article] [PubMed] [Google Scholar]
- 8.Bazzi H, Anderson KV. Acentriolar mitosis activates a p53-dependent apoptosis pathway in the mouse embryo. Proc Natl Acad Sci USA. 2014;111(15):E1491–E1500. doi: 10.1073/pnas.1400568111. [DOI] [PMC free article] [PubMed] [Google Scholar]
- 9.Marthiens V, et al. Centrosome amplification causes microcephaly. Nat Cell Biol. 2013;15(7):731–740. doi: 10.1038/ncb2746. [DOI] [PubMed] [Google Scholar]
- 10.Martin CA, et al. Mutations in PLK4, encoding a master regulator of centriole biogenesis, cause microcephaly, growth failure and retinopathy. Nat Genet. 2014;46(12):1283–1292. doi: 10.1038/ng.3122. [DOI] [PMC free article] [PubMed] [Google Scholar]
- 11.Boveri T. Concerning the origin of malignant tumours by Theodor Boveri. Translated and annotated by Henry Harris. J Cell Sci. 2008;121(Suppl 1):1–84. doi: 10.1242/jcs.025742. [DOI] [PubMed] [Google Scholar]
- 12.Chan JY. A clinical overview of centrosome amplification in human cancers. Int J Biol Sci. 2011;7(8):1122–1144. doi: 10.7150/ijbs.7.1122. [DOI] [PMC free article] [PubMed] [Google Scholar]
- 13.Lingle WL, et al. Centrosome amplification drives chromosomal instability in breast tumor development. Proc Natl Acad Sci USA. 2002;99(4):1978–1983. doi: 10.1073/pnas.032479999. [DOI] [PMC free article] [PubMed] [Google Scholar]
- 14.Basto R, et al. Centrosome amplification can initiate tumorigenesis in flies. Cell. 2008;133(6):1032–1042. doi: 10.1016/j.cell.2008.05.039. [DOI] [PMC free article] [PubMed] [Google Scholar]
- 15.Castellanos E, Dominguez P, Gonzalez C. Centrosome dysfunction in Drosophila neural stem cells causes tumors that are not due to genome instability. Curr Biol. 2008;18(16):1209–1214. doi: 10.1016/j.cub.2008.07.029. [DOI] [PubMed] [Google Scholar]
- 16.Noatynska A, Gotta M, Meraldi P. Mitotic spindle (DIS)orientation and DISease: Cause or consequence? J Cell Biol. 2012;199(7):1025–1035. doi: 10.1083/jcb.201209015. [DOI] [PMC free article] [PubMed] [Google Scholar]
- 17.Godinho SA, Pellman D. Causes and consequences of centrosome abnormalities in cancer. Philos Trans R Soc Lond B Biol Sci. 2014;369(1650):20130467. doi: 10.1098/rstb.2013.0467. [DOI] [PMC free article] [PubMed] [Google Scholar]
- 18.Lingle WL, Salisbury JL. The role of the centrosome in the development of malignant tumors. Curr Top Dev Biol. 2000;49:313–329. doi: 10.1016/s0070-2153(99)49015-5. [DOI] [PubMed] [Google Scholar]
- 19.Lingle WL, Lukasiewicz K, Salisbury JL. Deregulation of the centrosome cycle and the origin of chromosomal instability in cancer. Adv Exp Med Biol. 2005;570:393–421. doi: 10.1007/1-4020-3764-3_14. [DOI] [PubMed] [Google Scholar]
- 20.Fukasawa K. Centrosome amplification, chromosome instability and cancer development. Cancer Lett. 2005;230(1):6–19. doi: 10.1016/j.canlet.2004.12.028. [DOI] [PubMed] [Google Scholar]
- 21.Ganem NJ, Godinho SA, Pellman D. A mechanism linking extra centrosomes to chromosomal instability. Nature. 2009;460(7252):278–282. doi: 10.1038/nature08136. [DOI] [PMC free article] [PubMed] [Google Scholar]
- 22.Kwon M, et al. Mechanisms to suppress multipolar divisions in cancer cells with extra centrosomes. Genes Dev. 2008;22(16):2189–2203. doi: 10.1101/gad.1700908. [DOI] [PMC free article] [PubMed] [Google Scholar]
- 23.Silkworth WT, Nardi IK, Scholl LM, Cimini D. Multipolar spindle pole coalescence is a major source of kinetochore mis-attachment and chromosome mis-segregation in cancer cells. PLoS One. 2009;4(8):e6564. doi: 10.1371/journal.pone.0006564. [DOI] [PMC free article] [PubMed] [Google Scholar]
- 24.Ring D, Hubble R, Kirschner M. Mitosis in a cell with multiple centrioles. J Cell Biol. 1982;94(3):549–556. doi: 10.1083/jcb.94.3.549. [DOI] [PMC free article] [PubMed] [Google Scholar]
- 25.Brinkley BR. Managing the centrosome numbers game: From chaos to stability in cancer cell division. Trends Cell Biol. 2001;11(1):18–21. doi: 10.1016/s0962-8924(00)01872-9. [DOI] [PubMed] [Google Scholar]
- 26.Cimini D, et al. Merotelic kinetochore orientation is a major mechanism of aneuploidy in mitotic mammalian tissue cells. J Cell Biol. 2001;153(3):517–527. doi: 10.1083/jcb.153.3.517. [DOI] [PMC free article] [PubMed] [Google Scholar]
- 27.Kulukian A, Fuchs E. Spindle orientation and epidermal morphogenesis. Philos Trans R Soc Lond B Biol Sci. 2013;368(1629):20130016. doi: 10.1098/rstb.2013.0016. [DOI] [PMC free article] [PubMed] [Google Scholar]
- 28.Lechler T, Fuchs E. Asymmetric cell divisions promote stratification and differentiation of mammalian skin. Nature. 2005;437(7056):275–280. doi: 10.1038/nature03922. [DOI] [PMC free article] [PubMed] [Google Scholar]
- 29.Ezratty EJ, et al. A role for the primary cilium in Notch signaling and epidermal differentiation during skin development. Cell. 2011;145(7):1129–1141. doi: 10.1016/j.cell.2011.05.030. [DOI] [PMC free article] [PubMed] [Google Scholar]
- 30.Williams SE, Beronja S, Pasolli HA, Fuchs E. Asymmetric cell divisions promote Notch-dependent epidermal differentiation. Nature. 2011;470(7334):353–358. doi: 10.1038/nature09793. [DOI] [PMC free article] [PubMed] [Google Scholar]
- 31.Habedanck R, Stierhof YD, Wilkinson CJ, Nigg EA. The Polo kinase Plk4 functions in centriole duplication. Nat Cell Biol. 2005;7(11):1140–1146. doi: 10.1038/ncb1320. [DOI] [PubMed] [Google Scholar]
- 32.Peel N, Stevens NR, Basto R, Raff JW. Overexpressing centriole-replication proteins in vivo induces centriole overduplication and de novo formation. Curr Biol. 2007;17(10):834–843. doi: 10.1016/j.cub.2007.04.036. [DOI] [PMC free article] [PubMed] [Google Scholar]
- 33.Kleylein-Sohn J, et al. Plk4-induced centriole biogenesis in human cells. Dev Cell. 2007;13(2):190–202. doi: 10.1016/j.devcel.2007.07.002. [DOI] [PubMed] [Google Scholar]
- 34.Bettencourt-Dias M, et al. SAK/PLK4 is required for centriole duplication and flagella development. Curr Biol. 2005;15(24):2199–2207. doi: 10.1016/j.cub.2005.11.042. [DOI] [PubMed] [Google Scholar]
- 35.Vitre B, et al. Chronic centrosome amplification without tumorigenesis. Proc Nat Acad Sci USA. 2015;112:E6321–E6330. doi: 10.1073/pnas.1519388112. [DOI] [PMC free article] [PubMed] [Google Scholar]
- 36.Vasioukhin V, Degenstein L, Wise B, Fuchs E. The magical touch: Genome targeting in epidermal stem cells induced by tamoxifen application to mouse skin. Proc Natl Acad Sci USA. 1999;96(15):8551–8556. doi: 10.1073/pnas.96.15.8551. [DOI] [PMC free article] [PubMed] [Google Scholar]
- 37.Mansbridge JN, Knapp AM. Changes in keratinocyte maturation during wound healing. J Invest Dermatol. 1987;89(3):253–263. doi: 10.1111/1523-1747.ep12471216. [DOI] [PubMed] [Google Scholar]
- 38.Beronja S, Livshits G, Williams S, Fuchs E. Rapid functional dissection of genetic networks via tissue-specific transduction and RNAi in mouse embryos. Nat Med. 2010;16(7):821–827. doi: 10.1038/nm.2167. [DOI] [PMC free article] [PubMed] [Google Scholar]
- 39.Beronja S, et al. RNAi screens in mice identify physiological regulators of oncogenic growth. Nature. 2013;501(7466):185–190. doi: 10.1038/nature12464. [DOI] [PMC free article] [PubMed] [Google Scholar]
- 40.Kim S, Dynlacht BD. Assembling a primary cilium. Curr Opin Cell Biol. 2013;25(4):506–511. doi: 10.1016/j.ceb.2013.04.011. [DOI] [PMC free article] [PubMed] [Google Scholar]
- 41.Blanpain C, Lowry WE, Pasolli HA, Fuchs E. Canonical notch signaling functions as a commitment switch in the epidermal lineage. Genes Dev. 2006;20(21):3022–3035. doi: 10.1101/gad.1477606. [DOI] [PMC free article] [PubMed] [Google Scholar]
- 42.Rangarajan A, et al. Notch signaling is a direct determinant of keratinocyte growth arrest and entry into differentiation. EMBO J. 2001;20(13):3427–3436. doi: 10.1093/emboj/20.13.3427. [DOI] [PMC free article] [PubMed] [Google Scholar]
- 43.Moriyama M, et al. Multiple roles of Notch signaling in the regulation of epidermal development. Dev Cell. 2008;14(4):594–604. doi: 10.1016/j.devcel.2008.01.017. [DOI] [PubMed] [Google Scholar]
- 44.Yamashita YM, Mahowald AP, Perlin JR, Fuller MT. Asymmetric inheritance of mother versus daughter centrosome in stem cell division. Science. 2007;315(5811):518–521. doi: 10.1126/science.1134910. [DOI] [PMC free article] [PubMed] [Google Scholar]
- 45.Wang X, et al. Asymmetric centrosome inheritance maintains neural progenitors in the neocortex. Nature. 2009;461(7266):947–955. doi: 10.1038/nature08435. [DOI] [PMC free article] [PubMed] [Google Scholar]
- 46.Paridaen JT, Wilsch-Bräuninger M, Huttner WB. Asymmetric inheritance of centrosome-associated primary cilium membrane directs ciliogenesis after cell division. Cell. 2013;155(2):333–344. doi: 10.1016/j.cell.2013.08.060. [DOI] [PubMed] [Google Scholar]
- 47.Pelletier L, Yamashita YM. Centrosome asymmetry and inheritance during animal development. Curr Opin Cell Biol. 2012;24(4):541–546. doi: 10.1016/j.ceb.2012.05.005. [DOI] [PMC free article] [PubMed] [Google Scholar]
- 48.Smart IH. Variation in the plane of cell cleavage during the process of stratification in the mouse epidermis. Br J Dermatol. 1970;82(3):276–282. doi: 10.1111/j.1365-2133.1970.tb12437.x. [DOI] [PubMed] [Google Scholar]
- 49.Poulson ND, Lechler T. Robust control of mitotic spindle orientation in the developing epidermis. J Cell Biol. 2010;191(5):915–922. doi: 10.1083/jcb.201008001. [DOI] [PMC free article] [PubMed] [Google Scholar]
- 50.Williams SE, Ratliff LA, Postiglione MP, Knoblich JA, Fuchs E. Par3-mInsc and Gαi3 cooperate to promote oriented epidermal cell divisions through LGN. Nat Cell Biol. 2014;16(8):758–769. doi: 10.1038/ncb3001. [DOI] [PMC free article] [PubMed] [Google Scholar]
- 51.Janssen A, van der Burg M, Szuhai K, Kops GJ, Medema RH. Chromosome segregation errors as a cause of DNA damage and structural chromosome aberrations. Science. 2011;333(6051):1895–1898. doi: 10.1126/science.1210214. [DOI] [PubMed] [Google Scholar]
- 52.Filler RB, Roberts SJ, Girardi M. Cutaneous two-stage chemical carcinogenesis. CSH Protoc. 2007 doi: 10.1101/pdb.prot4837. [DOI] [PubMed] [Google Scholar]
- 53.Thompson SL, Compton DA. Examining the link between chromosomal instability and aneuploidy in human cells. J Cell Biol. 2008;180(4):665–672. doi: 10.1083/jcb.200712029. [DOI] [PMC free article] [PubMed] [Google Scholar]
- 54.Ganem NJ, et al. Cytokinesis failure triggers hippo tumor suppressor pathway activation. Cell. 2014;158(4):833–848. doi: 10.1016/j.cell.2014.06.029. [DOI] [PMC free article] [PubMed] [Google Scholar]
- 55.Thompson SL, Compton DA. Proliferation of aneuploid human cells is limited by a p53-dependent mechanism. J Cell Biol. 2010;188(3):369–381. doi: 10.1083/jcb.200905057. [DOI] [PMC free article] [PubMed] [Google Scholar]
- 56.Holland AJ, et al. The autoregulated instability of Polo-like kinase 4 limits centrosome duplication to once per cell cycle. Genes Dev. 2012;26(24):2684–2689. doi: 10.1101/gad.207027.112. [DOI] [PMC free article] [PubMed] [Google Scholar]
- 57.Foijer F, et al. Spindle checkpoint deficiency is tolerated by murine epidermal cells but not hair follicle stem cells. Proc Natl Acad Sci USA. 2013;110(8):2928–2933. doi: 10.1073/pnas.1217388110. [DOI] [PMC free article] [PubMed] [Google Scholar]
- 58.Srinivas S, et al. Cre reporter strains produced by targeted insertion of EYFP and ECFP into the ROSA26 locus. BMC Dev Biol. 2001;1:4. doi: 10.1186/1471-213X-1-4. [DOI] [PMC free article] [PubMed] [Google Scholar]
- 59.Beronja S, Fuchs E. RNAi-mediated gene function analysis in skin. Methods Mol Biol. 2013;961:351–361. doi: 10.1007/978-1-62703-227-8_23. [DOI] [PMC free article] [PubMed] [Google Scholar]


