

Significance
A molecular model is used to calculate the free energy of formation of ordered and disordered copolymer morphologies. We rely on advanced methodologies to identify the minimum free energy pathways that connect such states of the material. Our predictions for defect formation and annealing are compared with experimental observations. Our results provide a detailed molecular view of isolated block copolymer defects, which measure approximately 5 nm and represent isolated events in large areas. They are true “needles in the hay stack” that can only be studied by concerted molecular simulations and dedicated access to production-level fabrication tools. We show that defect annealing is an activated process, where defects are eliminated by operating near the order−disorder transition.
Keywords: directed self-assembly, copolymer, defect, minimum free energy path, string method
Abstract
Over the last few years, the directed self-assembly of block copolymers by surface patterns has transitioned from academic curiosity to viable contender for commercial fabrication of next-generation nanocircuits by lithography. Recently, it has become apparent that kinetics, and not only thermodynamics, plays a key role for the ability of a polymeric material to self-assemble into a perfect, defect-free ordered state. Perfection, in this context, implies not more than one defect, with characteristic dimensions on the order of 5 nm, over a sample area as large as 100 cm2. In this work, we identify the key pathways and the corresponding free energy barriers for eliminating defects, and we demonstrate that an extraordinarily large thermodynamic driving force is not necessarily sufficient for their removal. By adopting a concerted computational and experimental approach, we explain the molecular origins of these barriers and how they depend on material characteristics, and we propose strategies designed to overcome them. The validity of our conclusions for industrially relevant patterning processes is established by relying on instruments and assembly lines that are only available at state-of-the-art fabrication facilities, and, through this confluence of fundamental and applied research, we are able to discern the evolution of morphology at the smallest relevant length scales—a handful of nanometers—and present a view of defect annihilation in directed self-assembly at an unprecedented level of detail.
Over the last decade, the directed self-assembly (DSA) of block copolymers has rapidly evolved from mere intellectual curiosity (1–4) to a potentially crucial step in the commercial fabrication of next-generation electronic circuits. Indeed, the characteristic length scale of ordered self-assembled copolymer domains is in the range of 5–50 nm. Furthermore, their size and shape can be manipulated through simple processing steps, thereby making them attractive for the production of semiconductor devices, nanofluidic devices, or high-density storage media (5, 6). The general idea behind copolymer DSA is that a surface pattern—chemical or topographic—can be used to guide the assembly of a polymeric material into an ordered, device-like structure that is free of defects. In so-called “density multiplication” patterning strategies (7, 8), the spacing or pitch of the surface features can be much larger than the characteristic dimensions of the copolymer of interest. One can thus prepare coarse surface patterns, which are easier to create, and rely on the copolymer to self-assemble into features whose density is considerably larger. Fig. 1 shows a schematic representation of the process for obtaining a lamellar morphology on a stripe-patterned substrate under a one-to-three (or 3X) density multiplication strategy. Patterned stripes interact preferentially with one of the blocks and guide the assembly of thin copolymer films into ordered lamellae that are perpendicular to the substrate. Because the glass transition temperature of polymers is often well above room temperature, DSA is generally enabled by elevated temperatures (thermal annealing), by addition of solvents (solvent annealing), or through combined strategies (9).
Fig. 1.

(A) Schematic representation of 3X density multiplication of block copolymers on chemical patterns and (B) experimental SEM image of DSA structure after thermal annealing showing an isolated defect.
Because of its simplicity, thermal annealing remains the more widely studied means for achieving perfect assembly, and, for that reason, it is also the approach considered here. Also note that recent studies indicate that results for solvent annealing can be mapped onto those of thermal annealing (10) through the proper renormalization of material parameters (11). Fig. 1 shows an experimental scanning electron microscopy (SEM) image where, after thermal annealing, one can appreciate large areas of ordered lamellae that are interdispersed with rare, isolated defects.
The original literature on copolymer lithography implicitly assumed that the final morphologies that emerge in DSA represent equilibrium states of the material. Recent studies have challenged that view and suggest that DSA structures often represent metastable states of matter, whose characteristics depend on the process of assembly. For applications in the semiconductor industry, defects can only be tolerated at the level of approximately one per 100 cm2 area. Experimentally observed defect densities, however, can be much higher than those predicted from the corresponding defect free energies, which are on the order of hundreds of thermal energy units, (12, 13). Experiments also indicate that, for long annealing times, defect density decays with temperature (14). Taken together, such observations lead us to believe that the defects that arise in DSA represent kinetically trapped, nonequilibrium structures that cannot be explained by equilibrium thermodynamics alone. For emerging applications in nanotechnology, it is essential that their stability and, more importantly, their pathways for removal be understood.
In this study, we address three fundamental questions that are central to deployment of DSA in commercial technologies: (i) What is the free energy of defects in DSA during density multiplication? (ii) Is defect removal an activated process and, if so, (iii) how do the kinetic pathways for defect removal depend on material and pattern characteristics? To examine these issues, we rely on experiments and a 3D model of the thermodynamics and kinetics of the copolymer. We evaluate the free energy landscape as a function of the local composition, and we identify the minimum free energy paths (MFEP) between defective and ordered states, along with underlying transition states or saddle points. The results of simulations are validated through comparison with detailed images from fully 3D, transmission-electron-microscopy (TEM) tomography in thin copolymer films. We conclude this introductory section by noting that although our focus is thermal annealing, a future study will consider the more specialized problem of how thermal pathways can be altered (or not) through controlled addition of solvents (11, 15, 16).
Model and Methods
The model considered here relies on a particle-based representation of the copolymer molecules but adopts the same Hamiltonian H as that generally used in self-consistent field theory (17, 18). Such a model has been described in the literature and need not be recounted here. For completeness, however, a more extensive discussion is provided in SI Text. Importantly, the model has been shown to provide a representation of copolymer thin films that is in good agreement with available experimental data (19, 20). We rely on the string method to identify the MFEP between two metastable states on a free energy landscape (21–27). An initial string is constructed by linear interpolation between the two end states. In this work, we connect a defective morphology, , and a defect-free lamellar morphology, . As explained in SI Text, at each iteration of the string method, the mean force at discretized nodes along the string is numerically estimated by conducting field-theoretic umbrella sampling simulations. After each iteration, the string is updated according to the potential of mean force perpendicular to the string.
Results
MFEP for Edge Dislocation Dipole.
As can be appreciated in Fig. 1, the most commonly observed defects in block copolymer thin films are edge dislocations that have either an A or a B block core (13, 28). They consist of a half-domain of A or B material terminated in the middle of the regular lamellar domain, with distorted nearby planes of the internal AB interfaces. A single dislocation is a topological defect that cannot disappear by itself. However, pairs of dislocations with opposing Burgers vectors (dislocation dipoles) can cancel each other and disappear by transferring a defect core from one lamellar domain to a neighboring stripe of the smectic structure (gliding motion). In this study, we focus on dislocation dipoles with cores of the same-species block.
Fig. 2A shows the free energy difference, , along the MFEP between a defective morphology, , and a defect-free, lamellar morphology, , in units of . The MFEP exhibits two barriers and one shoulder at α = , , and , respectively. The morphologies for these three points along the MFEP are shown in Fig. 2B. The red contours correspond to the internal AB interfaces where A and B species having a vanishing local density difference.
Fig. 2.

(A) MFEP between a defective (apposing pair of dislocations) and a defect-free lamellar structure for . The abscissa represents the reaction coordinate along the pathway, . The ordinate corresponds to the free energy difference from the starting defective morphology, in units of . Inset shows defect morphology where darker shaded regions correspond to areas where the chemical guiding pattern acts. Numbers indicate positions of sequential morphological changes, discussed in MFEP for Edge Dislocation Dipole. (B) Morphologies at , , , , and 1.
A first transition state is observed at ; it has the highest free energy barrier along the path. A commitor probability analysis, according to procedures outlined in SI Text, indicates that this first transition state does correspond to a commitor probability of 0.5 (Fig. S1). The first transition state corresponds to the formation of a partial connection (a “bridge”) between one edge dislocation and the neighboring bent A layer (marked as 1 in Fig. 2A, Inset). A full connection will then break the branched B domain that surrounds the A core and transfer the edge dislocation by half a lamellar period, hereby switching into a B core edge dislocation (gliding motion). We emphasize here that the position of the peak in the MFEP corresponds to the incipient state connecting the A domains from two different regions, where a molecular bridge is built between them; the “transition” bridge typically comprises a handful of molecules, and a more detailed molecular-level analysis of its characteristics is provided in SI Text and in Fig. S2. The downhill descent after that first peak corresponds to the growth of the bridge. Once it attains a certain size—but before it detaches from the B domain—it enters a long-lived metastable state.
Fig. S1.

Mean commitor probability (probability that unconstrained MC simulations starting from an initial state fall into the defect-free side basin of the free energy) along with the MFEP between a defective and a defect-free lamellar structure for . The commitor probabilities are the numbers in the Inset.
Fig. S2.
Molecular-level image of a representative configuration for the first transition state. B blocks correspond to the semitransparent blue region, and A blocks are represented by beads on a string. It can be seen that the bridge at the transition state is formed by multiple polymer chains (an average of 13), and not by an individual molecule.
Bridge formation incurs an enthalpic penalty, associated with A blocks straddled over a chemically incompatible B-rich domain. The formation of the excess interfacial area during the annihilation process contributes to the free energy barrier. However, the precise position of the local maximum (plateau) of the interfacial area is located slightly after the barrier of the MFEP. The corresponding changes in the total bonded energy (chain stretching) and interfacial energy along the reaction path are shown in Fig. S3. Those energies reveal that, in addition to the energetic contributions incurred by a growing interface, the narrow connection of the A domains that is necessary to initiate the bridge alters the molecules’ configurations, which become stretched. This behavior is reminiscent of what is seen when polymer chains transfer between a double potential well (29). As can be seen in Fig. S4, the interfacial area increases after defect annihilation, but the decrease in the magnitude of the bonded energy is larger than the increase in the interfacial energy, leading to an overall decrease of the free energy along the pathway. Note that the magnitude of the difference in the sum of bonded and interfacial energy between the defective () and defect-free () states matches the defect formation energy estimated from the MFEP, serving to provide a consistency check on the analysis presented here. Also note that the transition state for the incipient connection between the A domains can occur at either the top (air surface) or the bottom (nonpreferential substrate) of the lamellae. Bridge formation in the middle of the polymer film is less advantageous than near the surface; this is due to the neutrality of the bottom and top surfaces, and the higher probability of finding a chain end near the surface (for entropic reasons). Moreover, the depletion layer that arises near a hard wall leads to fewer polymer segments, thereby facilitating bridge formation in a region that exhibits fewer AB contacts.
Fig. S3.
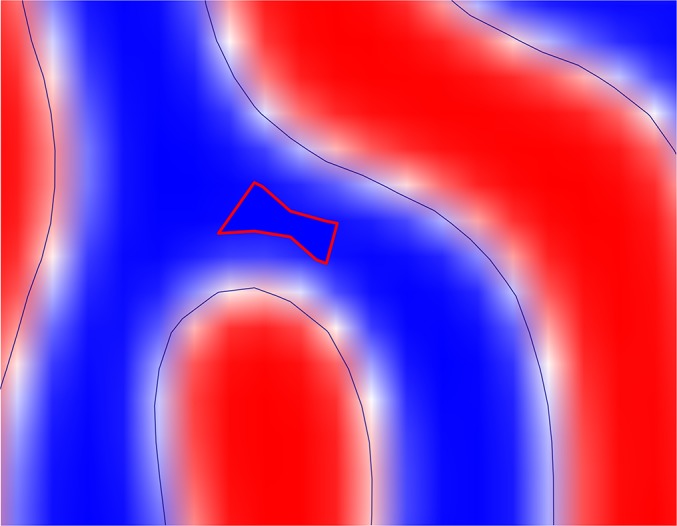
Illustration of the bridge domain, defined as having a volume fraction of PMMA (blue) above 95 in region 1 of Fig. 2A.
Fig. S4.

(Top) Total bonded energy and interfacial energy in units of as a function of reaction coordinate α and (Bottom) MFEP between a defective and a defect-free lamellar structure at . The vertical dashed line corresponds to the position of the first transition state.
Once a bridge is formed, it can grow more easily via the parallel motion of polymer chains along the AB interface; chains can migrate into the intermediate B domain by moving along the newly formed interface, without incurring unfavorable contacts between A and B segments. The possibility of having chains cross the domain through the bridge is presumably higher than that of crossing without a bridge, by an amount proportional to (27).
For completeness, we also compare the results of our string calculation to those of unrestrained, dynamic Monte Carlo (MC) simulations. Note that MC simulations with single-bead displacements have been demonstrated to capture the time evolution of morphological changes in block copolymer melts (30, 31); some of our diffusive MC simulation results for defect annihilation are shown in Fig. 3A. One can see that the sequence of morphologies identified here for different values of α along the MFEP are qualitatively consistent with those observed in MC simulations. This agreement serves to indicate that the order parameter adopted here for MFEP calculations is appropriate, and that there are no additional bottlenecks in the kinetics that arise from the single-chain dynamics in the complex morphology of the transition state. Also note that, when is small, is comparable to the thermal energy, and the concept of the MFEP as the typical, well-defined transformation path breaks down.
Fig. 3.

(A) Defect annihilation in diffusive MC simulations. (B and C) Center-of-mass trajectories of chains near the first transition state. (B) Trajectories before the bridge is formed, and (C) trajectories for the same chains after the bridge has formed.
The MC simulations can also be used to examine single-chain, center-of-mass trajectories during the transition period. Fig. 3 B and C shows center-of-mass trajectories for chains located near the bridge area during a fixed time interval. Fig. 3B depicts trajectories before the bridge is formed, and Fig. 3C presents trajectories for the same chains after the bridge has formed. The simulations confirm that the chains cross the domain after the bridge has been formed; otherwise, they move primarily along the interfaces. This view is supported by simulations and experiments on diffusion of block copolymer chains in bulk lamellar morphologies; diffusion is anisotropic, and is slower along the direction perpendicular to the interface than along the direction parallel to the interface (32, 33).
Once the A block wets the surface completely (either from the bottom or the top), but before it completely fills region 1 (compare Fig. 2A) with A segments across the entire film, the MFEP exhibits a second free energy barrier, , corresponding to the formation of a bridge on the other core of the A dislocation. This second bridge is formed in a manner analogous to that of the first transition state. Bridge formation leads to depletion of A blocks in the bent region (indicated by number “3”), thereby facilitating the connection of the B domain (bright region) in the middle; the third peak corresponds to B bridge formation in region 3, but has a much smaller height (or is a shoulder).
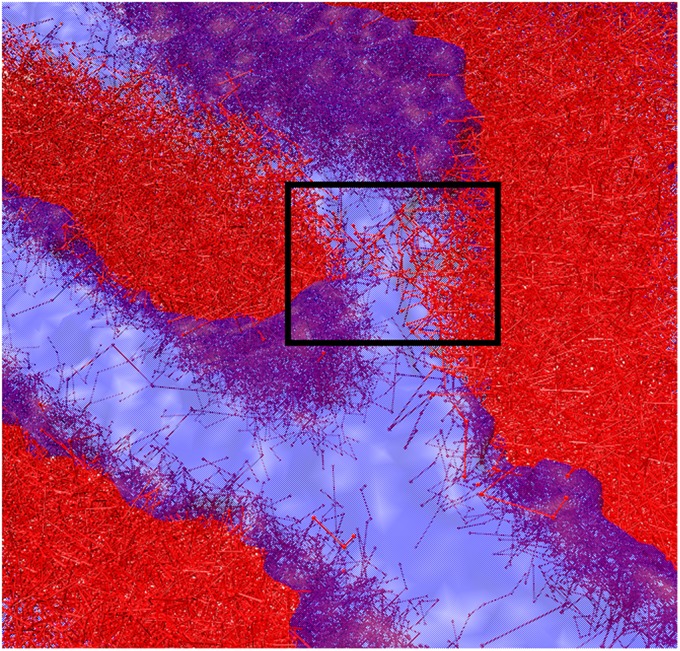
Note that the MFEP follows the 3D kinetic pathway not only for the transition states but also for long-lasting metastable states that may exist in between. Traditional experimental SEM images of the top of the film are unable to reveal the morphological changes that occur across the film. These changes, however, can be extracted from a recent experimental technique, namely 3D TEM tomography (34). Experimental details are provided in SI Text. Our measurements are shown in Fig. 4, along with the corresponding simulated morphologies, and confirm the existence of the 3D metastable states identified by the MFEP.
Fig. 4.

The 3D structure of DSA dislocation defects obtained from TEM tomography (Top), along with predicted metastable state along the MFEP (Bottom). For clarity, the region corresponding to the evolving defect is highlighted with a yellow contour in both simulations and experiments. For 3D TEM tomography, alumina was grown in three cycles of sequential infiltration synthesis (SIS); the polymer was then etched using oxygen plasma, leaving behind an alumina nanostructure that follows the polymethyl methacrylate (PMMA) domains.
Effect of Segregation Strength.
Having established the validity of our pathway predictions by comparison with experiment and dynamic simulation, we now examine in a systematic manner the effect of material characteristics, in the form of the segregation strength, , on the barriers, , along the MFEP and the excess free energy, , of defects. The periodicity and width of the guiding stripes are properly rescaled according to the natural domain spacing of lammellar, , corresponding to different . The effects of additional chain compression and stretching of chains (12, 35) are therefore excluded here. Fig. S5 shows the MFEPs for =20, 25, 30, and 37. For all considered here, the MFEPs between a dislocation dipole and a defect-free lamellar morphology exhibit three peaks (or two peaks and one shoulder at smaller ), showing that, regardless of , the system follows a unique topological pathway for defect removal, but with different and . Fig. 5 presents (black) from the first peak and (blue) as a function of . The solid line corresponds to results for 3X guiding stripes of and (see Fig. 2), whereas the dashed lines correspond to assembly without chemical patterns, on homogeneous neutral substrates. As discussed in MFEP for Edge Dislocation Dipole, the free energy barrier is related to the penalty associated with A blocks bridging the B domain. Fig. 5 shows that the free energy barriers decrease as the segregation strength decreases, because the free energy penalty is proportional to . Moreover, as becomes smaller and approaches the order–disorder transition (ODT), the width of AB interfaces becomes wider and the magnitude of fluctuations also increases, making it much easier for chains to make connections with neighboring domains. At the same time, the thermodynamic driving force decreases monotonically as decreases, because the excess free energy due to the distorted internal AB interface decreases. Note that past self-consistent simulations of graphoepitaxy in two dimensions (12) and chemoepitaxy in three dimensions (27) predicted that and depend almost linearly on . Also note that such self-consistent field calculations predict a vanishing before reaches the ODT (by extrapolation of the vs. curve for a neutral substrate) (27). Similarly, our particle-based simulations show that free energy barrier heights decrease linearly with for both chemically patterned (solid black line in Fig. 5) and neutral substrates (dashed black line). In agreement with these self-consistent field calculations and computer simulations (13), is found to be large—on the order of 100 —even for smallest where defects exist; again, this result emphasizes that the probability of forming defects at equilibrium is extremely small. In experiments, defects arise in the process of structure formation (via spin casting, for example); defect removal is an activated process, and free energy barriers proportional to help stabilize them.
Fig. S5.

MFEP between a defective (a pair of dislocations) structure and a defect-free lamellar structure for different values of . The x axis represents the reaction coordinate along the pathway, . The y axis is the free energy difference with respect to the defective, starting morphology in units of .
Fig. 5.

Free energy difference between defective and defect-free lamellar structures, (blue), and highest free energy barrier height (first transition state), (black), in units of , as a function of . Simulation data for 3X DSA (circles) and neutral substrates (triangles) are fitted with solid and dashed lines, respectively.
One important practical consideration is to identify optimal annealing processes for defect removal. The segregation strength, , can be manipulated through temperature or solvent concentration, and these two variables can be controlled in experiments to achieve optimal results, i.e., low defectivity in short processing times. Ideally, one would seek to find conditions having small and large . Li et al. suggest that the region around for neutral substrates (or larger values for dense guiding patterns) provides the best condition for defect annihilation on nonpreferential substrates or dense guiding patterns (27) because the excess free energy of defects significantly exceeds the thermal energy , yet the free energy barrier , which separates the metastable defect from the perfectly ordered structure, is small compared with , i.e., there exists a certain range of temperature—or solvent concentration or molecular weight—where thermal fluctuations remove defects but do not create new ones. In the following, we explore the defect removal mechanisms for guiding patterns with density multiplication and more complex defect structures by computer simulation.
Fig. 5 shows that a chemical pattern with 3X density multiplication helps decrease and increase for all , thereby facilitating defect annihilation. Results for and for different substrate conditions at =25 are summarized in Table S1. At this point, it is important to emphasize that the strain field that accompanies a dislocation decays with the distance from the core. These strain field-mediated forces result in an attraction between dislocations with opposite Burgers vectors, and the metastable dislocation dipoles correspond to situations where these forces disappear. Previous studies of the free energy associated with isolated dislocations relied on thermodynamic integration (13) and examined finite-size effects. Such studies confirmed that the defect formation free energy, , reaches its asymptotic value for sample sizes comparable to those considered here. For a dislocation pair having opposite Burgers vectors, a screening of the strain fields is expected in the far field. Strain field effects are therefore smaller for dislocation pairs, and the excess free energy and the barrier should not exhibit significant finite-size effects. These predictions are confirmed by results from simulations of adjacent dislocation dipoles in simulation boxes of varying sizes. When the simulation box size is small, the interaction and distortion by neighboring dislocation dipoles (via the periodic boundary conditions) increases the defect formation energy, , and destabilizes the defects (the free energy barrier height is smaller). However, when the system size is sufficiently large, at approximately , our calculations show that both and reach their asymptotic limits, thereby leading us to place the characteristic dimension of the strain field at around . All results reported here are from simulations with .
Table S1.
Defect formation energy and free-energy barrier height for different guiding patterns for
| No pattern | ||||
| 8.85 0.99 | 7.18 0.54 | 8.06 0.46 | 6.72 0.59 | |
| 237.66 4.32 | 245.84 2.58 | 238.46 1.05 | 245.71 2.66 |
In contrast to the case with a homogeneous substrate, 3X guiding stripes that attract the A block with reduce by about . The magnitude of , which is proportional to the time scale for crossing the first transition state and reaching the second metastable state, decreases by a factor of five with respect to the transition time observed on the neutral substrate. This result shows that guiding stripes on a chemically patterned substrate facilitate defect annihilation significantly, even when those defects are not directly on top of the guiding stripe.
Importantly, calculations for guiding stripes that deviate from perfect commensurability reveal that the thermodynamic equilibrium morphology is not affected, but that the kinetics of DSA (i.e., the time required for defect removal) can vary considerably. As explained in SI Text, we also considered the magnitude of barrier heights as a function of the relative position of a defect to the guiding stripes. Surprisingly, we found that when one of the edge dislocations lies on the guiding stripe, it is harder to remove the associated defect than when it is on a neutral background (Fig. S6 and Table S2).
Fig. S6.

(Top) MFEP between a defective (a pair of dislocations) and a defect-free lamellar structure for different values of the distance D between the center of a pair of dislocation and the guiding stripe. The x axis represents the reaction coordinate along the pathway, . The y axis is the free energy difference with the starting morphology (defective) in units of . (Bottom) The initial defective structures for D = 1.5, 0.5, 1, and 0.
Table S2.
Defect formation energy and free energy barrier height for different values of D
| D | ||||
| 0 | 0.5 | 1 | 1.5 | |
| 0 | 5.82 0.38 | 3.07 0.04 | 3.98 0.41 | |
| 184.51 1.19 | 142.58 1.79 | 164.89 0.41 | 150.80 1.36 | |
A block copolymer with = 20 was used for these calculations.
Dislocation Dipoles Separated by Multiple Lamellae.
At this point, it is instructive to note that, although the kinetic barriers for adjacent dislocation dipoles are predicted to be small for low values of , experimentally observed defect densities can, in some cases, be large. The answer to this apparent contradiction is that previous studies were limited to cases where the two edge dislocations were located next to each other. Generally, the initial stages of structure formation lead to dislocation dipoles that are apart in both the perpendicular and parallel directions to the stripes. The strain energy of dislocations leads to an attractive force between them, causing them to gradually approach each other by a “climbing” or a “gliding” motion (36). Here, climbing refers to an edge dislocation displacement along the stripes, and perpendicular to the Burgers vector; gliding describes a defect movement perpendicular to the internal AB interfaces. Unlike the defects in solid crystals, in which climbing by the emission or absorption of vacancies is more difficult, defects in block copolymer thin films are expected to exhibit a slower gliding motion, because gliding necessarily involves interdiffusion across domain boundaries and interface destruction, a highly unfavorable process due to the enthalpic penalty for block mixing mentioned earlier. Climbing motion, on the other hand, can be achieved via relatively inexpensive chain displacements parallel to the interfaces. These views are confirmed by recent experiments by Tong and Sibener, who monitored the dynamics of layered structures of cylinder-forming block copolymers confined in a channel (36).
In response to the strain field-mediated interactions, dislocation cores with opposite Burgers vectors attract each other and climb along the stripes until they reach a metastable, force-free configuration. Here we therefore focus on gliding motion out of this metastable configuration, and examine how barrier heights vary for each of the peaks as the perpendicular distance between edge dislocations varies.
Fig. 6 presents the MFEP of dislocation dipoles separated by two lamellar periods at . As shown in the representative configurations of the initial defect configuration, two edge dislocations are located right next to the A-attractive guiding stripes, and intermediate curved domains are located on top of the neutral domain. Along the defect annihilation path, there is a small first barrier that corresponds to bridge formation of the bright B blocks, followed by a downhill descent corresponding to the growth of the bridge (increasing the wetting layer of B). Another small barrier and a downhill section follow as the bridge of the B block on the other side forms and grows. Approximately at the reaction coordinate α = 0.3, the system reaches a 3D metastable structure. Beyond that structure, the free energy rises again. This uphill process is associated with the formation of the B bridge, and is followed by transition states with a large barrier height. This first transition state has a slight connection of the red A domain, which occurs after the B bridge increases on one side, as shown in the fifth morphology of Fig. 6B. When the connected A domain vanishes completely, the B core edge dislocation is transferred into an A core edge dislocation. A similar transition occurs on the other side, and eventually results in a dislocation dipole with a reduced distance of . The morphology of this dislocation dipole is the same as that of the initial defect structure (tight dislocation dipole) studied in MFEP for Edge Dislocation Dipole, and the subsequent portion of the MFEP is the same as the black curve in Fig. S4 for =20. We would like to emphasize that, although the barrier height for annihilation of dislocation dipoles that are adjacent to each other is predicted to be very small, if the two edges of a dislocation pair are initially apart, the system must first cross transition states having much larger barrier heights, on the order of , even for materials having a small . This is more than 3 times larger than the barrier height for dislocation dipoles that are adjacent to each other.
Fig. 6.

(A) MFEP between a dislocation dipole separated by two periods and defect-free lamellar structures . The x axis represents the reaction coordinate along the pathway, . The y axis is free energy difference with the starting morphology (defective) in units of . (B) Morphologies along the MFEP in A. All of the images correspond to bottom views.
Note, additionally, that the kinetic pathway for defect removal consists of multiple barriers and metastable states and that the probability of a metastable state going back in the direction toward the original defect state is not negligible, i.e., the system performs a stochastic jump process between the metastable states.
These observations help explain the higher defect density that is sometimes observed in experiments, and emphasizes that, for DSA, it is important to know how barrier height varies as a function of the distance between dislocations. Previous experimental studies (36, 37) that attempted to fit data using a uniform diffusion, regardless of the distance between dislocation dipoles, were unlikely to capture the diffusion of moving defects.
Conclusions
We have examined the MFEP for defect annihilation of dislocation pairs in lamellar structures of block copolymer thin films, with an emphasis on industrially relevant DSA strategies that rely on a chemically patterned substrate and density multiplication. Multiple metastable states, separated by free energy barriers, arise along the MFEP. The largest barrier height, , for a tight dislocation dipole corresponds to the formation of a first transition state in which a molecular bridge connecting the edge and the nearest curved domain is initiated. From a Kramers-like approach, the transition time is expected to be exponentially proportional to . This will therefore be the most time-consuming step along the path. MFEP and diffusive MC simulations, which can predict the evolution of morphologies, show that once a bridge is formed, it can grow rapidly as additional molecules travel through the growing bridge. The proposed mechanism of bridge formation and growth is confirmed by experimental measurements using 3D TEM tomography. As the incompatibility between blocks, , increases, the defect formation energy also increases. At the same time, however, the barrier height increases. Thus, we anticipate that even for the large thermodynamic driving forces that arise in high- materials, defect annihilation is inhibited by the presence of large kinetic barriers. We have also shown that a chemical pattern helps reduce barrier heights significantly, even for defects located on the neutral background. The annihilation time can therefore be reduced by a factor of five with respect to the case of a homogeneous surface without any guiding patterns. Finally, we showed that kinetic barriers are very sensitive to the distance between dislocations. The barrier height of a dislocation dipole separated by two layers requires more than 4 times the activation energy for them to approach each other and annihilate. This finding suggests that the density of defects separated by multiple lamellae should be much higher than that of adjacent dislocations.
SI Text
SI Model and Methods
The model considered here relies on a particle-based representation of the copolymer molecules but adopts the same Hamiltonian H as that generally used in self-consistent field theory (17, 18). Such a model has been shown to provide a representation of copolymer thin films that is in good agreement with available experimental data (19, 20). We refer to it with the “TICG” acronym, which stands for “Theoretically Informed Coarse Grained” model. For a system of n Gaussian polymer chains, each composed of N beads, bonded contributions to the Hamiltonian are given by , where denotes bond vector i on the kth chain, and is the end-to-end distance for an ideal chain. A field-theoretic Hamiltonian is used to describe nonbonded interactions according to , where denotes the normalized number density of species α. Here denotes the average segment number density, χ is the Flory parameter that determines the segregation strength between A and B blocks, and κ measures the inverse compressibility of the material.
To identify the MFEP between two metastable states on a free energy landscape, we rely on the string method (21–27), which requires that a mean force be calculated at local points, or nodes, along a string connecting two states on the landscape. The landscape is described here in terms of a high-dimensional collective variable, , along the reaction coordinate, , that parameterizes the path. Each component of the order parameter vector, , represents the normalized density difference between A and B segments in a volume around the point on a spatial grid over V (26). The potential of mean force is given by , where denotes the order parameter vector computed from the particle coordinates . The MFEP is constructed by satisfying , where represents a variation perpendicular to the path. At each iteration of the string method, the mean force at discretized nodes along the string (we use 128 nodes along the string) is numerically estimated by conducting umbrella sampling simulations that constrain the system around , with a field-theoretic umbrella potential . From the condition of , the sampling of the mean force for the constrained system satisfies . In the kth iteration, the string is therefore updated according to . Note that after every update, the nodes along the string are redistributed to maintain the same arc length between nodes. Once the string is converged, the free energy along the string is determined from .
An initial string is constructed by linear interpolation between the two end states. In this work, we connect a starting defective morphology, , and a defect-free lamellar morphology, . These two morphologies are generated by MC simulations, which include fluctuations. By adopting a method with freely moving string ends, the pathway converges to states in which both ends correspond to local minima of the free energy landscape.
For our calculations, we used the values , , , and , which provide a good representation of the Poly(styrene-block-methyl methacrylate) (PS-PMMA) materials considered in our experiments.
The lateral dimensions of the simulation box size are and the thickness is , where is the equilibrium characteristic period of the lamellar structure in the bulk (∼50 nm for the PS-PMMA copolymer materials considered in our experiments). The segregation strength between A (red) and B (white) polymer blocks is . The thin polymer film is assembled on a patterned substrate with 3X density multiplication (7, 38), i.e., every third period of the copolymer lies on top of a guiding stripe, which is shaded in gray in Fig. 2A, Inset. The guiding pattern interacts with the blocks via the surface potential , where and . This magnitude of corresponds to typical interfacial free energies between polymethyl methacrylate and patterned polymer brushes (13). Here, adopts the value 1 on the A-attractive guiding stripes and 0 on the nonpreferential, “neutral” background region. The width of the guiding stripe, , is commensurate with the lamellar structure. Two dislocation cores are located on the neutral regions of the substrate, and two A domains are placed on the guiding stripe.
SI Commitor Analysis
To corroborate the transition state identified in the MFEP determined from string method simulations, we have calculated the commitor probabilities (23, 25, 39) for the three nodes (13th, 14th, and 15th), near the first transition state (at in Fig. 2) along the string. To do so, an ensemble of 10 statistically independent microscopic initial configurations was first generated by constraining the system around the collective variable, , of the corresponding node using the same field-based umbrella potential used in the string method calculations. After that, those configurations were used to launch 10 independent, unconstrained diffusive MC trajectories from each initial configuration. We followed the system for a predefined time (5,000 iterations), which is sufficient to approach the nearest metastable states. Based on the accumulated 100 trajectories, a mean commitor probability of trajectories falling into the defect-free side of the transition was calculated. From that analysis, that mean commitor probability at the transition state was calculated to be 0.511, serving to demonstrate that such a node does correspond to a transition state.
SI Molecular-Level Details on the Transition State
Fig. S2 provides additional molecular-level details of the transition state. The image provides a representative configuration near the first transition state. For clarity, the B blocks are shown by a semitransparent blue region, and the A blocks are represented by beads on a string. It can be seen that the bridge at the transition state is formed by a handful of polymer chains, not a single one. To determine how many chains are involved in the bridge region, we analyzed over 40 independent configurations (the same that were used in the commitor analysis of SI Commitor Analysis). The average number of chains is 13.1, with an SD of 2.6. The bridge is defined by the domain where the volume fraction of PMMA (blue) is above in region 1 of Fig. 2A. In Fig. S3, we depict the actual bridge region in the context of the entire sample.
SI Bonding Energy and Interfacial Energy
Variation of total bonded energy (chain stretching) and interfacial energy along the reaction coordinate, α, for the defect annihilation process is shown in Fig. S4. Interfacial energy is estimated from Helfand’s formula (40) and the average interfacial area, defined on the surface where the local density difference between A and B vanishes. Both bonded energy and interfacial area along the path are estimated by averaging over MC iterations corresponding to 30 updates of the string. The bonded energy decreases along the annihilation process by hundreds of , but the local details cannot be discerned from the noise in the plot. The interfacial area increases until about the point where the MFEP reaches the third peak. However, the decrease in the magnitude of bonded energy is larger than the increase in the interfacial energy, leading to an overall decrease of free energy along the path, except at transition states with barriers. In the late stages of the defect removal process, both interfacial energy and bonding energy decrease, corresponding to the rapid drop in free energy shown in the MFEP curve. The magnitude of the difference in the sum of bonded and interfacial energy between defective () and defect-free () states is about 230 , and matches well with the defect formation energy determined from the MFEP. These estimates underscore the importance of chain stretching in defect formation energy. It is also interesting that interfacial area in a defective state is smaller than in the defect-free state.
A vertical dashed line in the bonded and interfacial energy plots in Fig. S4 is used to indicate the position of the first transition state. There is a rapid growth of interfacial area at the transition state, because the bridge formation at the transition state incurs in an enthalpic penalty, associated with A blocks straddled over a chemically incompatible B-rich domain. However, the precise position of the local maximum (plateau) of the interfacial area is located slightly after the barrier of the MFEP, demonstrating that the transition state that is associated with the formation of the bridge alters the molecules’ configurations, which become stretched.
SI 3D TEM Tomography
For 3D TEM tomography presented in Fig. 4, the PS-PMMA film was fabricated on a silicon wafer coated with 30 nm of silicon nitride. The block copolymer assembly was directed by a chemical pattern with W ≈ 0.7L0 and under 3X density multiplication. In order to enable TEM imaging, the silicon wafer was back etched after block copolymer assembly. Al2O3 was grown inside the PMMA domain using sequential infiltration synthesis (SIS) for etch contrast enhancement and pattern transfer. Subsequently, the block copolymer film was etched using oxygen plasma, leaving a 16-nm-thick Al2O3 nanostructure template by the PMMA domains. A tilt series of angles ranging from −65° to +65°, consisting of 45 images, was acquired using 200-kV scanning TEM. Alignment and reconstruction of the tilt series resulted in xy image series (parallel to the substrate) spanning from the top of the film to the substrate, resolving the three-dimensional nanostructure. The top row of Fig. 4 shows the Al2O3 nanostructure at three heights: z = 13.2 nm, 7.5 nm, and 2.7 nm, where z = 0 is at the substrate. After SIS etching, the film shrinks to less than 50% of the original block copolymer layer thickness, and the Al2O3 nanostructure thickness is approximately 14 nm.
SI Effect of Segregation Strength
Fig. S5 shows the MFEPs for =20, 25, 30, and 37. For all considered here, the MFEPs between a dislocation dipole and a defect-free lamellar morphology exhibit three peaks (or two peaks and one shoulder at smaller ), showing that, regardless of , the system follows a unique topological pathway for defect removal, but with different and .
SI Effect of Imperfections of the Guiding Strips
From a practical point of view, it is also of interest to consider imperfections of the guiding strips, e.g., a mismatch between the width of the pattern and the natural periodicity of the block copolymers. To do so, we vary the width of the guiding stripe to , and find that decreases to about half of the value observed for the neutral substrate. Incommensurate guiding stripes can still accelerate defect removal, but not to the same extent as “ideal,” perfectly commensurate stripes. These results are confirmed by our experimental measurements of defect densities for different values of incommensurability as a function of annealing time (41). On the other hand, when is doubled to 1 from 0.5, which corresponds to a highly selective substrate, is similar to that calculated for the case of , and decreases by about . This finding suggests that the strength of interactions with the substrate also affects the kinetics of defect removal, but thermodynamic aspects are less sensitive to it.
SI Effect of Relative Position of Dislocation Dipoles to the Guiding Stripe
Because the guiding stripes exhibit an attraction to the A block, in 3X density multiplication, one can, in fact, encounter four topologically different dislocation dipoles, each having a different distance D from the guiding stripe to the center of the dipole. Fig. S6 shows the MFEPs corresponding to these four different dislocation dipoles – D = 0, 0.5, 1.0, and 1.5 in units of the bulk periodicity —at small = 20. The starting morphologies are shown in Fig. S6, Bottom. Table S2 summarizes the results for and . Because we used a string method with free-moving ends (except for the case, where the defect is not even metastable), the starting morphology corresponds to the near-equilibrium metastable structure for any given condition.
The black curve represents the MFEP when defects are positioned symmetrically with respect to the guiding stripe, . Due to the affinity of the A block (red) for the guiding stripe, the initial morphology exhibits a wetting of the stripe; without the substrate, this is the last part to be connected (corresponding to the shoulders in the red and blue curves in Fig. S6). This preferential wetting of the guiding stripe by the A block drives the registration of the rest of the lamellar pattern, and the MFEP is always downhill, corresponding to the increase of that wetting area, pulling the A block toward the guiding stripe and pushing the B blocks away. This process will lead to the connection of the B blocks in areas 1 and 2 in Fig. 2A, Inset.
The cases D = 1.5 and 1 both correspond to edge dislocations (and curved domains in between) located on the neutral substrate, but with cores of a different polymer block. Although both cases have similar MFEPs, the MFEP for D = 1 with B-block (bright domain) edge dislocation dipoles (blue curve) exhibits a smaller and a larger than the MFEP for A-block edge dislocation dipoles (D = 1.5, red curve). This is simply due to the fact that D = 1 is located closer to the guiding stripe. Interestingly, however, when D is reduced to 0.5, where one of the edge dislocations is located on top of the guiding stripe, the energy barrier becomes higher. Had we simply assumed that the structure from the top view persists across the film and ignored any 3D transition states, we could have concluded that D =0.5 is highly unstable, because it would require a larger interfacial energy on top of the guiding stripe (28). However, our simulations indicate that the A block wets the stripe, avoiding the large surface free energy penalty. Due to this wetting, polymer chains in the bent A domains are attracted toward the guiding stripe, thereby leading to a larger barrier for bridge formation on the other edge dislocation. For this reason, D = 0.5 exhibits only one high free energy barrier, but the red and blue curves—D = 1 and 1.5—exhibit two barriers. Thus, our simulation results predict that dislocation dipoles on a chemically patterned substrate have cores that are predominantly made of the block attracted by the guiding substrate, because the A-core dislocation dipoles with D = 1.5 and 0.5 have larger on average than the B-core defects with D = 1 and 0.
Acknowledgments
This work is supported by the US Department of Energy, Office of Science, Office of Basic Energy Sciences, Materials Science and Engineering. W.L. and M.M. received financial support from the European Union Seventh Framework Programme under Grant Agreement 619793 CoLiSA.MMP. We are grateful for valuable computing resources provided on Blues, a high-performance computing cluster operated by the Laboratory Computing Resource Center at Argonne National Laboratory, and for resources provided by the Midway Research Computing Center at the University of Chicago. An award of computer time was provided by the Innovative and Novel Computational Impact on Theory and Experiment (INCITE) program of the Argonne Leadership Computing Facility at Argonne National Laboratory.
Footnotes
The authors declare no conflict of interest.
This article is a PNAS Direct Submission. C.R. is a guest editor invited by the Editorial Board.
This article contains supporting information online at www.pnas.org/lookup/suppl/doi:10.1073/pnas.1508225112/-/DCSupplemental.
References
- 1.Park M, Harrison C, Chaikin PM, Register RA, Adamson DH. Block copolymer lithography: Periodic arrays of ∼1011 holes in 1 square centimeter. Science. 1997;276(5317):1401–1404. [Google Scholar]
- 2.Rockford L, et al. Polymers on nanoperiodic, heterogeneous surfaces. Phys Rev Lett. 1999;82(12):2602–2605. [Google Scholar]
- 3.Kim SO, et al. Epitaxial self-assembly of block copolymers on lithographically defined nanopatterned substrates. Nature. 2003;424(6947):411–414. doi: 10.1038/nature01775. [DOI] [PubMed] [Google Scholar]
- 4.Segalman RA, Yokoyama H, Kramer EJ. Graphoepitaxy of spherical domain block copolymer films. Adv Mater. 2001;13(15):1152–1155. [Google Scholar]
- 5.Albert JN, Epps TH., III Self-assembly of block copolymer thin films. Mater Today. 2010;13(6):24–33. [Google Scholar]
- 6.Kim HC, Park SM, Hinsberg WD. Block copolymer based nanostructures: Materials, processes, and applications to electronics. Chem Rev. 2010;110(1):146–177. doi: 10.1021/cr900159v. [DOI] [PubMed] [Google Scholar]
- 7.Ruiz R, et al. Density multiplication and improved lithography by directed block copolymer assembly. Science. 2008;321(5891):936–939. doi: 10.1126/science.1157626. [DOI] [PubMed] [Google Scholar]
- 8.Cheng JY, Rettner CT, Sanders DP, Kim HC, Hinsberg WD. Dense self-assembly on sparse chemical patterns: Rectifying and multiplying lithographic patterns using block copolymers. Adv Mater. 2008;20(16):3155–3158. [Google Scholar]
- 9.Gotrik KW, Ross CA. Solvothermal annealing of block copolymer thin films. Nano Lett. 2013;13(11):5117–5122. doi: 10.1021/nl4021683. [DOI] [PubMed] [Google Scholar]
- 10.Nealey PF, Wan L. 2012. US patent publication US 20120202017 A1 (August 9, 2012)
- 11.Hur SM, et al. Simulation of defect reduction in block copolymer thin films by solvent annealing. ACS Macro Lett. 2015;4(1):11–15. doi: 10.1021/mz500705q. [DOI] [PubMed] [Google Scholar]
- 12.Takahashi H, et al. Defectivity in laterally confined lamella-forming diblock copolymers: Thermodynamic and kinetic aspects. Macromolecules. 2012;45(15):6253–6265. [Google Scholar]
- 13.Nagpal U, Müller M, Nealey PF, de Pablo JJ. Free energy of defects in ordered assemblies of block copolymer domains. ACS Macro Lett. 2012;1(3):418–422. doi: 10.1021/mz200245s. [DOI] [PubMed] [Google Scholar]
- 14.Welander AM, et al. Rapid directed assembly of block copolymer films at elevated temperatures. Macromolecules. 2008;41(8):2759–2761. [Google Scholar]
- 15.Jung YS, Ross CA. Solvent-vapor-induced tunability of self-assembled block copolymer patterns. Adv Mater. 2009;21(24):2540–2545. [Google Scholar]
- 16.Gotrik KW, et al. Morphology control in block copolymer films using mixed solvent vapors. ACS Nano. 2012;6(9):8052–8059. doi: 10.1021/nn302641z. [DOI] [PubMed] [Google Scholar]
- 17.Matsen MW, Schick M. Stable and unstable phases of a diblock copolymer melt. Phys Rev Lett. 1994;72(16):2660–2663. doi: 10.1103/PhysRevLett.72.2660. [DOI] [PubMed] [Google Scholar]
- 18.Fredrickson G. The Equilibrium Theory of Inhomogeneous Polymers. Oxford Univ Press; Oxford: 2006. [Google Scholar]
- 19.Detcheverry FA, Pike DQ, Nealey PF, Müller M, de Pablo JJ. Monte Carlo simulation of coarse grain polymeric systems. Phys Rev Lett. 2009;102(19):197801. doi: 10.1103/PhysRevLett.102.197801. [DOI] [PubMed] [Google Scholar]
- 20.Detcheverry FA, Liu G, Nealey PF, de Pablo JJ. Interpolation in the directed assembly of block copolymers on nanopatterned substrates: Simulation and experiments. Macromolecules. 2010;43(7):3446–3454. [Google Scholar]
- 21.E W, Ren W, Vanden-Eijnden E. String method for the study of rare events. Phys Rev B. 2002;66(5):052301. doi: 10.1021/jp0455430. [DOI] [PubMed] [Google Scholar]
- 22.Miller TF, 3rd, Vanden-Eijnden E, Chandler D. Solvent coarse-graining and the string method applied to the hydrophobic collapse of a hydrated chain. Proc Natl Acad Sci USA. 2007;104(37):14559–14564. doi: 10.1073/pnas.0705830104. [DOI] [PMC free article] [PubMed] [Google Scholar]
- 23.E W, Ren W, Vanden-Eijnden E. Simplified and improved string method for computing the minimum energy paths in barrier-crossing events. J Chem Phys. 2007;126(16):164103. doi: 10.1063/1.2720838. [DOI] [PubMed] [Google Scholar]
- 24.Cheng X, Lin L, e W, Zhang P, Shi AC. Nucleation of ordered phases in block copolymers. Phys Rev Lett. 2010;104(14):148301. doi: 10.1103/PhysRevLett.104.148301. [DOI] [PubMed] [Google Scholar]
- 25.Ting CL, Appelö D, Wang ZG. Minimum energy path to membrane pore formation and rupture. Phys Rev Lett. 2011;106(16):168101. doi: 10.1103/PhysRevLett.106.168101. [DOI] [PMC free article] [PubMed] [Google Scholar]
- 26.Müller M, Smirnova YG, Marelli G, Fuhrmans M, Shi AC. Transition path from two apposed membranes to a stalk obtained by a combination of particle simulations and string method. Phys Rev Lett. 2012;108(22):228103. doi: 10.1103/PhysRevLett.108.228103. [DOI] [PubMed] [Google Scholar]
- 27.Li W, Nealey PF, de Pablo JJ, Müller M. Defect removal in the course of directed self-assembly is facilitated in the vicinity of the order-disorder transition. Phys Rev Lett. 2014;113(16):168301. doi: 10.1103/PhysRevLett.113.168301. [DOI] [PubMed] [Google Scholar]
- 28.Kim SO, et al. Defect structure in thin films of a lamellar block copolymer self-assembled on neutral homogeneous and chemically nanopatterned surfaces. Macromolecules. 2006;39(16):5466–5470. [Google Scholar]
- 29.Sebastian KL, Paul AKR. Kramers problem for a polymer in a double well. Phys Rev E Stat Phys Plasmas Fluids Relat Interdiscip Topics. 2000;62(1 Pt B):927–939. doi: 10.1103/physreve.62.927. [DOI] [PubMed] [Google Scholar]
- 30.Edwards EW, et al. Mechanism and kinetics of ordering in diblock copolymer thin films on chemically nanopatterned substrates. J Polym Sci Part B Polym Phys. 2005;43(23):3444–3459. [Google Scholar]
- 31.Detcheverry FA, Nealey PF, de Pablo JJ. Directed assembly of a cylinder-forming diblock copolymer: Topographic and chemical patterns. Macromolecules. 2010;43(15):6495–6504. [Google Scholar]
- 32.Ramírez-Hernández A, et al. Dynamical simulations of coarse grain polymeric systems: Rouse and entangled dynamics. Macromolecules. 2013;46(15):6287–6299. [Google Scholar]
- 33.Lodge TP, Dalvi MC. Mechanisms of chain diffusion in lamellar block copolymers. Phys Rev Lett. 1995;75(4):657–660. doi: 10.1103/PhysRevLett.75.657. [DOI] [PubMed] [Google Scholar]
- 34.Segal-Peretz T, et al. Characterizing the three-dimensional structure of block copolymers via sequential infiltration synthesis and scanning transmission electron tomography. ACS Nano. 2015;9(5):5333–5347. doi: 10.1021/acsnano.5b01013. [DOI] [PubMed] [Google Scholar]
- 35.Kim B, et al. Thermodynamic and kinetic aspects of defectivity in directed self-assembly of cylinder-forming diblock copolymers in laterally confining thin channels. J Appl Polym Sci. 2014;131(24):40790. [Google Scholar]
- 36.Tong Q, Sibener SJ. Visualization of individual defect mobility and annihilation within cylinder-forming diblock copolymer thin films on nanopatterned substrates. Macromolecules. 2013;46(21):8538–8544. [Google Scholar]
- 37.Ruiz R, Bosworth JK, Black CT. Effect of structural anisotropy on the coarsening kinetics of diblock copolymer striped patterns. Phys Rev B. 2008;77(5):054204. [Google Scholar]
- 38.Liu G, Thomas CS, Craig GSW, Nealey PF. Integration of density multiplication in the formation of device-oriented structures by directed assembly of block copolymer–homopolymer blends. Adv Funct Mater. 2010;20(8):1251–1257. [Google Scholar]
- 39.Branduardi D, Faraldo-Gómez JD. String method for calculation of minimum free-energy paths in Cartesian space in freely-tumbling systems. J Chem Theory Comput. 2013;9(9):4140–4154. doi: 10.1021/ct400469w. [DOI] [PMC free article] [PubMed] [Google Scholar]
- 40.Helfand E, Tagami Y. Theory of the interface between immiscible polymers. II. J Chem Phys. 1972;56(7):3592–3601. [Google Scholar]
- 41.Liu CC, et al. Chemical patterns for directed self-assembly of lamellae-forming block copolymers with density multiplication of features. Macromolecules. 2013;46(4):1415–1424. [Google Scholar]