Abstract
The objective of this study was to determine the influence of water on the polymerization kinetics, crosslinking structure and dynamic mechanical properties of methacrylate/epoxy polymers cured by visible-light initiated free-radical/cationic ring-opening hybrid polymerization. Water-containing formulations were prepared by adding ~4–7 wt% D2O depending on the water miscibility of monomer resins. The water-containing adhesives were compared with the adhesives photo-cured in the absence of water. The results show an improved degree of conversion for both methacrylates and epoxy by adding water. The rate of the epoxy cationic ring-opening reaction is increased while the rate of free radical polymerization is decreased in the presence of water. The decreased crosslinking density noted in the presence of water suggests that the chain transfer reaction between water and epoxy competes with the hydroxyl-based chain transfer mechanism. There is potential application of this visible-light initiated hybrid polymerization in biomaterials, e.g. dental restorations and tissue engineering scaffolds.
Graphical Abstract
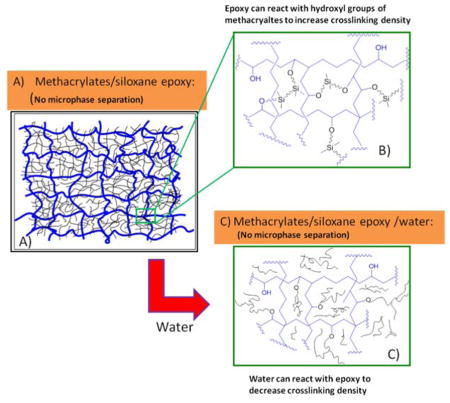
The influence of water on polymerization kinetics, crosslinking structure and dynamic mechanical properties of methacrylate/epoxy polymers cured by visible-light initiated free-radical/cationic ring-opening hybrid polymerization was studied in detail. The results show that the degree of conversion for both methacrylate and epoxy can be improved by adding water in the adhesive formulations. In the presence of water, the apparent crosslinking density of the polymer was decreased due to the chain transfer reaction between epoxy and water.
Introduction
Although UV initiated photopolymerization offers numerous advantages, such as efficiency, energy savings, and environmental friendliness,1–5 the damaging effects of UV radiation have limited its use for biological applications. Visible light photopolymerization is preferred for biological applications such as dental restorations and polymer scaffolds for tissue engineering.6, 7
Visible light photopolymerization systems can be broadly divided into two groups:7, 8 free-radical polymerization with acrylate monomers, which exhibit high reaction rates and offer a large selection of monomers and initiators; cationic polymerization with epoxides, which do not suffer from oxygen inhibition and exhibit low toxicity and less shrinkage.9–13 The hybrid photopolymerization, using both acrylates and epoxides, could combine the advantages of the two reaction pathways. Hybrid photopolymerization could offer less shrinkage, lower sensitivity to both oxygen and moisture, and improved adhesion and flexibility.14
Oxman and colleagues evaluated the visible light initiator system (CQ containing three-component initiator system) used in free-radical/cationic hybrid photopolymerization.15 Nine different electron donors were investigated to demonstrate how the basicity of additives affects the cationic polymerization, but the report provided limited information on the polymerization kinetics and crosslinking structures.
Our group has studied the complex polymerization kinetics and crosslinking structures of polymers formed by visible light initiated free-radical/cationic ring-opening hybrid polymerization.8 The results provide evidence of the important role that the chain transfer reaction, between epoxy and hydroxyl groups of the methacrylate, plays in the formation of the crosslinking network. The chain transfer reaction not only enhances the crosslinking density, it also prevents the microphase separation.
Water is a highly efficient chain transfer agent. Our previous work has shown that water can affect the polymerization kinetics as well as the dynamic mechanical properties of methacrylate-based dentin adhesives cured by visible light.5, 16–19 Cationic polymerization is known to be influenced by the presence of nucleophiles such as water. Ranaweera and colleagues reported the effect of moisture on polymerization of epoxy monomers.20 Cai and Jessop21 reported the effect of water on UV-initiated hybrid polymerization and the results showed decreased physical properties due to loss of crosslinking. To date, there is no report on the effect of water on methacrylate/epoxy-based dentin adhesives cured by visible light initiated hybrid polymerization. Surprisingly, all of the studies on the effect of water on cationic ring-opening polymerization have used very low concentrations of water, e.g. lower than 1.5 wt%.
In this paper, we studied the effect of water on polymerization kinetics and crosslinking structures formed by visible light initiated free-radical/cationic ring-opening hybrid photopolymerization. The formulations contained 4–7 wt% D2O, depending on the water miscibility of the monomer resins. A three-component initiator system was used, and the monomer system contained both methacrylates and epoxides. The effects of water concentration and monomer concentration on the polymerization kinetics were studied by FTIR. The crosslinking structures were studied by modulated DSC, and two kinds of epoxides (siloxane epoxy and oxocarbon epoxy, respectively) were employed. It is hypothesized that water can depress the chain transfer reaction between epoxy and the hydroxyl groups of methacrylates. The depressed chain transfer reaction could lead to decreased crosslinking density in the hybrid formulations. To our knowledge, this is the first study to explore the influence of water on polymerization kinetics, crosslinking structure and the chain transfer reaction with visible light initiated free-radical/cationic ring-opening hybrid polymerization.
Experimental
Materials
The chemical structures are shown in Table 1. Bisphenol A glycerolate dimethacrylate (BisGMA, Polysciences, Warrington, PA) and 2-hydroxyethylmethacrylate (HEMA) were used as received without further purification, as monomers for free-radical polymerization. Two epoxy monomers (E1 and E2) were used for cationic ring-opening polymerization. E1, a siloxane epoxy, was synthesized in our lab using a method similar to previous publications.22, 23 The synthesis and characterization have also been published by our group.8 3,4-Epoxycyclohexylmethyl (E2) was purchased from Sigma-Aldrich (St. Louis, MO, USA). Camphorquinone (CQ), ethyl-4-(dimethylamino) benzoate (EDMAB) and (4-octyloxyphenyl) phenyliodonium hexafluoroantimonate (OPPIH) were used as a three-component-photoinitiator system. OPPIH was obtained from Gelest, Inc. (Morrisville, PA). All other chemicals were purchased from Sigma-Aldrich (St. Louis, MO USA) and used without further purification.
Table 1.
Chemical structures used in the free-radical/cationic ring-opening hybrid system
| Intiator system | Monomer system | ||
|---|---|---|---|
| Photosensitizer |
 CQ |
Methacrylate |
 HEMA |
| Electron donor |
EDMAB |
BisGMA |
|
| Iodonium salt |
 OPPIH |
Epoxide |
E1 (Siloxane epoxy) |
|
E2 (oxocarbon epoxy) | |||
Preparation of adhesive formulations
The preparation of the adhesive formulations has been reported.5, 8, 24–26 As shown in Table 2, the control adhesive formulation (C0) consisted of HEMA and BisGMA with a mass ratio of 45/55, which is similar to widely used commercial dentin adhesives. This control was used as a comparison to the experimental adhesive resins (E1-x or E2-x) with methacrylate/epoxy = (100-x)/x (w/w) ratio. The methacrylate in the experimental formulations was HEMA/BisGMA = 45/55 (w/w) (Table 2). The formulations of E1-25, E1-50, E2-25 and E2-50 were also formulated with about 4~7 wt % D2O (exact value is shown in Table 2) to examine the influence of water on hybrid polymerization. Water concentration was varied based on the water miscibility of the monomer resins. A three component initiator system was used containing CQ, EDMAB and OPPIH (1.0/1.0/2.0 wt %). The resin formulations were prepared in brown glass vials and mixed for 2 days to form a homogeneous solution.
Table 2.
Adhesive formulation, degree of conversion, polymerization rate and water miscibilitya.
| Sample | Methacrylatesb (wt %) | Epoxy (wt %) | Conversion of methacrylates (%) | Polymerization rate of methacrylatesc (x 10−2 s−1) | Conversion of epoxy groups (%) | Epoxy ring- opening ratec (x 10−2 s−1) | Water miscibility (wt %) |
|---|---|---|---|---|---|---|---|
| C0 | 100 | 0 | 69.8±0.1 | 28.4±0.8 | N/A | N/A | 10.3±0.3 |
| E1-25 | 75 | 25 | 73.4±0.0d | 15.6±0.1d | N/D | N/D | 6.8±0.3d |
| E1-25-6.8%D2O | 85.1±0.6d,e | 14.0±1.0d,e | N/D | N/D | |||
| E1-50 | 50 | 50 | 68.9±0.6d,e | 11.7±0.7d,e | 68.0±0.6 | 2.1±0.1 | 4.1±0.3d,e |
| E1-50-4.1%D2O | 83.5±1.6d,e,f | 10.2±0.2d,e,f | 85.7±5.0f | 2.4±0.1f | |||
| E2-25 | 75 | 25 | 79.7±0.2d,e | 17.7±0.4d,e | N/D | N/D | 8.7±0.3d,e |
| E2-25-8.7%D2O | 87.9±0.2d,g,h | 16.6±0.3d,g,h | N/D | N/D | |||
| E2-50 | 50 | 50 | 79.3±0.0d,f,h | 15.0±0.2d,f,h | 40.1±0.1f | 1.1±0.1f | 7.2±0.5d,f,h |
| E2-50-4.1%D2O | 92.4±0.1d,i | 11.7±0.8d,i | 75.0±1.0i | 1.8±0.3i | |||
| E2-50-7.2%D2O | 97.5±0.2d,i,j | 10.8±0.5d,i,j | 91.9±0.9i,j | 2.5±0.1i,j |
E1: E1-(Silorane) containing adhesives; E2: E2-containing adhesives; E-x: x is the weight content of epoxy monomer.
Three-component-photoinitiator: CQ/EDMAB/OPPIH= 1.0/1.0/2.0 (wt %);
Methacrylates: HEMA/BisGMA =45/55;
Free-radical polymerization rate and epoxy ring-opening rate were used to represent the Rp/[M]0. Statistical analysis is done separately for each column:
Significant (p<0.05) difference from Control (C0);
Significant (p<0.05) difference from E1-25;
Significant (p<0.05) difference from E1-50.
Significant (p<0.05) difference from E1-25-6.8%D2O;
Significant (p<0.05) difference from E2-25;
Significant (p<0.05) difference from E2-50;
Significant (p<0.05) difference from E2-50-4.1%D2O.
Values are mean (± standard deviation) for n = 3 in each group. N/D: not detectable
Real-time conversion and maximum polymerization rate
Real-time in situ monitoring of the photopolymerization of the adhesive formulations was performed using an infrared spectrometer (Spectrum 400 Fourier transform infrared spectrophotometer, Perkin-Elmer, Waltham, MA) at a resolution of 4 cm−1. 18, 27 One drop of adhesive solution was placed on the diamond crystal top-plate of an attenuated total reflectance (ATR) accessory (Pike, GladiATR, Pike Technology, Madison, WI) and covered with a Mylar film. A 40-s-exposure to the commercial visible-light-polymerization unit (Spectrum 800®, Dentsply, Milford, DE, ~480–490nm28), at an intensity of 550 mW cm−2, was initiated after 50 spectra had been recorded (This polymerization is a crosslinking-curing reaction). Real-time IR spectra were recorded continuously for 600 s after light curing began. A time-resolved spectrum collector (Spectrum TimeBase, Perkin-Elmer) was used for continuous and automatic collection of spectra during curing. The experiment was replicated three times for each adhesive formulation.
To determine the degree of conversion (DC), heavy water (deuterium oxide, 99.9%, D2O) (Cambridge Isotope Laboratories, Inc., Andover, MA, USA) was used in this study to reduce interference from the overlapping water peak at 1640cm 1. The change of the band ratio profile (1637 cm−1 (C=C)/1608 cm−1 (phenyl)) was monitored for calibrating the DC of the methacrylate groups. DC was calculated using the following equation, which is based on the decrease in the absorption intensity band ratios before and after light curing. The average of the last 50 values of time-based data points is reported as the DC value at 10 minutes.
In the hybrid system, there is a second type of reaction, i.e. epoxy ring-opening reaction. A similar method, as described above, was used to calculate the DC of the ring-opening reaction.8 The difference is the band ratio profile used for DC calculation. For the monomer of E1 (siloxane epoxy), the band ratio profile of (884 cm−1 (epoxy)/1251 cm−1 (Si-C)) was monitored. Overlapping spectral features made it more difficult to use the band ratio to calculate the DC of the epoxy ring-opening reaction for the monomer of E2 (oxocarbon epoxy). The decrease in the absorption intensity at 788 cm−1 ascribed to the epoxy group was used to calculate the DC for E2.14, 21, 29–31
The kinetic data were converted to Rp/[M]0 by taking the first derivative of the time versus conversion curve,16, 32, 33 where Rp and [M]0 are the rate of polymerization and the initial monomer concentration, respectively.
Modulated DSC
Disc samples, with a thickness of 1 mm and a diameter 4 mm, were analyzed using DSC. Five specimens were prepared for each formulation. The disc samples were prepared by injecting the adhesive formulations into hermetic lids (TA instruments, T 120110, USA), covering with a round glass cover slip (Ted pella, Inc., Prod No. 26023) and polymerizing with a 40-s-exposure to the commercial visible-light-polymerization unit (Spectrum®, Dentsply, Milford, DE), at an intensity of 550 mW cm−2. The polymerized samples were stored in the dark at room temperature for two days to provide adequate time for post-curing polymerization. The disc samples were extracted from the lids and stored in a vacuum oven at 37 °C for fourteen days to remove water. The final mass of the disc specimens was about 20 mg.
As reported previously,8, 19 the thermal behavior of the adhesive polymers was measured with a TA instruments model Q100 MTDSC (New Castle, DE), equipped with a refrigerated cooling system (RCS). The DSC cell was purged with nitrogen gas at 50 mL/min, and the specimens were heated from −20 °C to 200 °C at 3 °C/min with a modulation period of 60 s and an amplitude of ± 2 °C.
Preparation of adhesive polymer specimens for dynamic mechanical analysis
The preparation of the polymer specimens has been reported.16, 17, 34–36 In brief, square beams with a side of 1 mm and a length of at least 15 mm were prepared by injecting the adhesive formulations into glass-tubing molds (Fiber Optic Center, Inc., part no.: ST8100, New Bedford, MA). Five specimens were prepared for each formulation. The samples were light polymerized with an LED light curing unit for 40s (LED Curebox, 200 mW/cm2 irradiance, Prototech, and Portland, OR). In our experiments, the kinetics study is conducted at higher light intensity (550mW/cm2, halogen light) than the beam specimen preparation conditions (LED curing box, 200 mW/cm2). It should be noted that we used LED light with lower intensity to prepare the beam specimens, which has a high efficiency to induce the photo polymerization. We have compared both light sources and the intensity setting has been adjusted so that the DC and polymerization rate are similar between the systems under these two conditions). The polymerized samples were stored in the dark at room temperature for two days to provide adequate time for post-cure polymerization. The samples were extracted from the glass tubing and stored in a vacuum oven at 37 °C for 30 days prior to characterization using dynamic mechanical analysis.
Dynamic mechanical analysis (DMA)
As described previously,16, 35, 36 the viscoelastic properties of the dentin adhesives were characterized using DMA Q800 (TA Instruments, New Castle, USA) with a 3-point bending clamp. The test temperature was varied from 0 to 250 °C with a ramping rate of 3 °C/min, a frequency of 1 Hz, an amplitude of 15 μm, and a pre-load of 0.01 N. The properties measured under this oscillating loading were storage modulus (E′) and tan δ. The E′ value represents the stiffness of a viscoelastic material and is proportional to the energy stored during a loading cycle. The ratio of the loss modulus (E″) to the storage modulus E′ is referred to as the mechanical damping, or tan δ (i.e., tan δ = E″/E′). The tan δ value reaches a maximum as the polymer undergoes the transition from the glassy state to the rubbery state. The glass transition temperature (Tg) was determined to be the position of the maximum on the tan δ vs. temperature plot. Five specimens of each adhesive formulation were measured under dry conditions, and the results from the three specimens per each formulation were averaged.
Water miscibility
Water miscibility is the property of the liquid monomer resin to mix with water, forming a homogeneous solution. In principle, the main focus is usually on the solubility of water in different formulations of the monomer resin. About 0.5 g of each neat resin was weighed into a brown vial, and water was added in increments until the mixture was visually observed to be turbid. The percentage of water in the mixture was noted (w1). The mixture was then back-titrated using the neat resin until the turbidity disappeared, and the percentage of water in the mixture was again noted (w2). Three samples were tested for each formulation and water miscibility of the liquid formulation was calculated as the average of w1 and w2.
Statistical analysis
For all experimental groups, the differences were evaluated using one-way analysis of variance (ANOVA), together with Tukey’s test at α= 0.05 to identify significant differences (Microcal Origin Version 8.0, Microcal Software Inc., Northampton, MA).
Results and discussion
The influence of water on the kinetics of the hybrid polymerization
In order to determine the effect of water on the kinetics of hybrid polymerization, the water miscibility of the monomer resins must first be determined otherwise, phase separation between water and organic monomers could happen before photo curing. Based on the previous study of hybrid polymerization,8 two formulations were selected for each epoxy-containing resin, i.e. E-25 and E-50. These formulations contain 25 and 50 wt % epoxy, respectively. Details about the formulations are shown in Table 2.
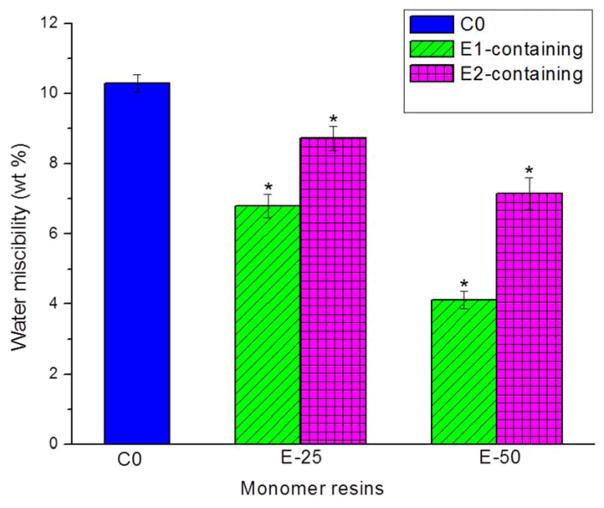
The results of the water miscibility experiment are presented in Fig. 1 and Table 2. For the control formulation, the water miscibility was 10.3 wt%. Water miscibility decreased with an increase in epoxy content. At 25 wt % E1 (siloxane-epoxy), the water miscibility was 6.8 wt % (E1-25 in Table 2). The water miscibility decreased to 4.1 wt% at 50 wt % E1 (siloxane-epoxy). At the same weight content of epoxy, the water miscibility of E2-containing formulations was higher than that of E1-containing resins. The water miscibility values for E2-25 and E2-50 were 8.7 and 7.2 wt %, respectively (Table 2). The lower water miscibility for E1-containing formulations is attributed to the hydrophobicity of siloxane chains.
Fig. 1.
Water miscibility of liquid monomer resins with different weight contents of epoxy monomers. *Significantly (p <0.05) different from the control (C0).
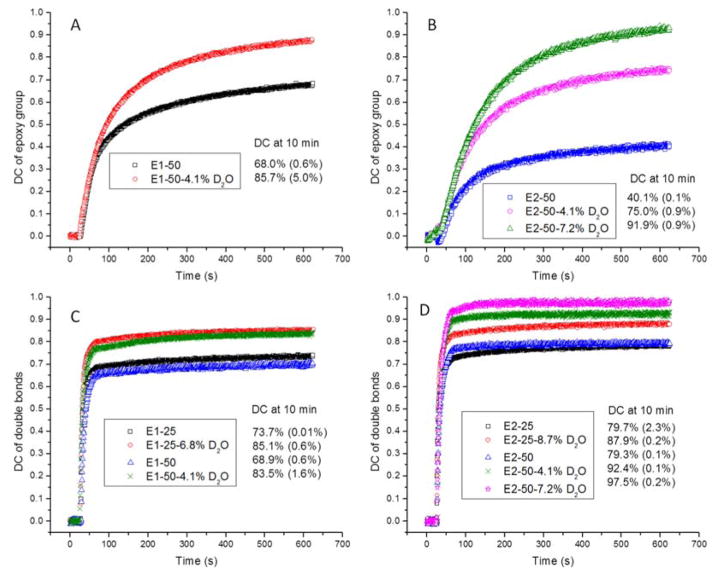
The DC for epoxy groups is shown in Figures 2A and 2B. When there is 4.1 wt % D2O, the DC of E1 was 85.7 % (E1-50-4.1% D2O), which was much higher than the same formulation without D2O (68.0 % for E1-50 shown in Figure 2A). The influence of water on DC for E2 is shown in Figure 2B. With increasing D2O content, DC increased from 40.1 % (E2-50) to 75.0 % (E2-50-4.1% D2O) and 91.9 % (E2-50-7.2 % D2O). In comparison, at the same D2O content, e.g. 4.1 wt %, the DC for E1 (85.7 %, E1-50-4.1% D2O in Figure 2A) was higher than that of E2 (75.0 %, E2-50-4.1% D2O in Figure 2B), which was attributed to the higher reactivity of E1 (siloxane-epoxy) as compared to E2 (oxocarbon-epoxy).23 It should be noted that the lowest content of the epoxy monomer for the kinetics study of the epoxy groups was 50 wt %. The FTIR spectra of the epoxy groups overlapped substantially with the absorbance peaks of the C-H bonds of the methacrylates at epoxy concentrations lower than 50 wt %.
Fig. 2.
Photopolymerization kinetics of E1-containing adhesive resins and E2-containing adhesive resins. Real-time conversion of epoxy groups (A and B) and methacrylate groups (C and D) cured in the presence of different weight contents of D2O were monitored by FTIR spectroscope for 600 s after light activation began. The adhesives were light-cured for 40 sec at room temperature using a commercial visible-light-curing unit (Spectrum® 800, Dentsply, Milford, DE. Intensity was 550 mW/cm2). The number in parentheses is the standard deviation.
The results of DC for methacrylates are shown in figure 2C and D. DC for methacrylates increased for all the D2O-containing formulations. For example, in the presence of 6.8 wt % D2O, DC of E1-containing resins increased from 73.7% (E1-25) to 85.1 % (E1-25-6.8% D2O). For E1-50, after adding 4.1 wt % D2O, DC increased from 68.9% to 83.5 %. Comparable results were noted with E2-containing formulations, Figure 2D. DC for E2-25 increased from 79.7 to 87.9% when 8.7% D2O was included in the mixture. Without D2O the DC of E2-50 was 79.3 %, the DC increased to 92.4 and 97.5 % after adding 4.1 and 7.2 wt % D2O. At the same D2O content (4.1 wt %), comparing the DC of methacrylates, E2-50-4.1 % D2O (92.4 %) is higher than that of E1-50-4.1 % D2O (83.5 %). This difference might be caused by microphase separation in the E1-containing adhesives. As reported previously,8 when there was 50 wt % E1 (siloxane-epoxy), the polymerized specimens exhibited microphase separation. The microphase separation was attributed to the poor miscibility between siloxane-containing poly-ether and poly-methacrylate.37–43 Even in the presence of water, the polymerized E1-50 beams lacked transparency, suggesting microphase separation.
There is an increase in the DC for both methacrylate and epoxy groups in the presence of water. There are several reasons for this increase including the effect of water on viscosity and the efficiency of water as a chain transfer agent. The decreased viscosity of the monomer mixture in the presence of D2O potentially leads to increased mobility of monomers and reactive species. The increased mobility of these species could be a contributory factor in the increased DC. For epoxy groups, other contributory factors include the chain transfer reaction between epoxy, hydroxyl and water. The chain transfer reaction in the hybrid formulations in the absence of water was studied in detail, in our previous publication.8 As reported previously, the DC of epoxy could be improved slightly by increasing the content of hydroxyl groups. It should be noted that in the D2O-containing formulations, the results showed an obvious increase in DC. This difference can be explained by comparing the chain transfer agents, i.e., water is a more reactive chain transfer agent than organic hydroxyl groups.
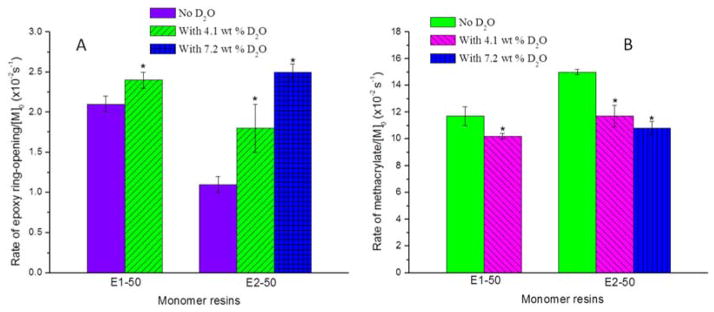
The rates of polymerization (Rp/[M]0) are shown in Figure 3 and Table 2. It should be noted that the ring-opening rate includes the cationic ring-opening polymerization rate and chain transfer rate of reaction between the epoxy, hydroxyl and water. As seen from Figure 3A, the rate of the epoxy ring-opening reaction increased when D2O was added. For E1-50, the rate increased from 2.1 × 10⁻² s−1 to 2.4 × 10⁻² s−1 (E1-50-4.1 % D2O). For E2-50, the ring-opening rate was 1.1 × 10⁻² s−1. With an increase in the D2O content from 4.1 to 7.2 wt %, the ring-opening rate increased from 1.8 × 10⁻² s−1 (E2-50-4.1 % D2O) to 2.5 × 10⁻² s−1 (E2-50-7.2 % D2O). At the same D2O content (4.1 wt %), the rate of E1 (E1-50-4.1 % D2O: 2.4 × 10⁻² s−1) was higher than that of E2 (E2-50-4.1 % D2O: 1.8 × 10⁻² s−1) due to the higher reactivity offered by siloxane-epoxy. The results in Fig. 3 indicate that the epoxy ring-opening rate can be increased by adding D2O. This increase is likely due to the higher chain transfer reaction rate between epoxy and D2O, despite the slight decrease in epoxy concentration with the addition of D2O.
Fig. 3.
(A) The comparison of maximum ring-opening rate for epoxy group, and the maximum polymerization rate for methacryalte (B) with different weight content of D2O. *Significantly (p <0.05) different from the formulation without D2O.
In contrast to the epoxy ring-opening rate, the rate of free-radical polymerization for methacrylates decreased with the addition of D2O (Figure 3B) for both E1 and E2-containing resins. The rate of polymerization for methacrylate in E1-50 decreased from 11.7 × 10⁻² to 10.2 × 10⁻² s-1 (E1-50-4.1 % D2O) with the addition of 4.1 wt % D2O. For E2-50, the rate of polymerization for methacrylate decreased from 15.0 × 10⁻² s−1 to 11.7 × 10⁻² s−1 (E2-50-4.1 % D2O) and 10.8 × 10⁻² s−1 (E2-50-7.2 % D2O) with 4.1 and 7.2 wt % D2O, respectively. The influence of water on free-radical polymerization of methacrylate was attributed solely to the dilution effect. Monomer concentration could be diluted by adding D2O therefore, the rate of free-radical polymerization was decreased with an increase in the concentration of D2O.
Interestingly, at the same D2O content (4.1 wt %), the free-radical polymerization rate of E1-50 (E1-50-4.1 % D2O) was slightly lower than that of E2-50 (E2-50-4.1 % D2O), as shown in Fig. 3B. This may be attributed to the differences in the viscosities of the epoxy monomers, since E1 has a lower viscosity than E2. (The viscosities for pure E1 and E2 are 140.0 and 381.0 cP, respectively). The maximum Rp for free-radical polymerization in our study could be associated with the autoacceleration effect of polymerization.8 It has been found that with lower viscosity, the autoacceleration effect is depressed as compared to those systems with higher viscosity. Thus, the lower viscosity of the epoxy E1 monomer could result in a lower polymerization rate.
Crosslinking structure study by Modulated DSC
Interpenetrating polymer networks (IPNs) could be formed when two distinct functional polymers become entangled at the molecular level.44 Usually phase separation will happen if the miscibility between the two different polymers is low.45 Polymerization kinetics are also expected to play an important role in the final structure and property relationships of the IPN. The kinetics could be influenced by the presence of water. To understand the influence of water on the final structures and properties of the polymers, modulated DSC was used to study the crosslinking structure.
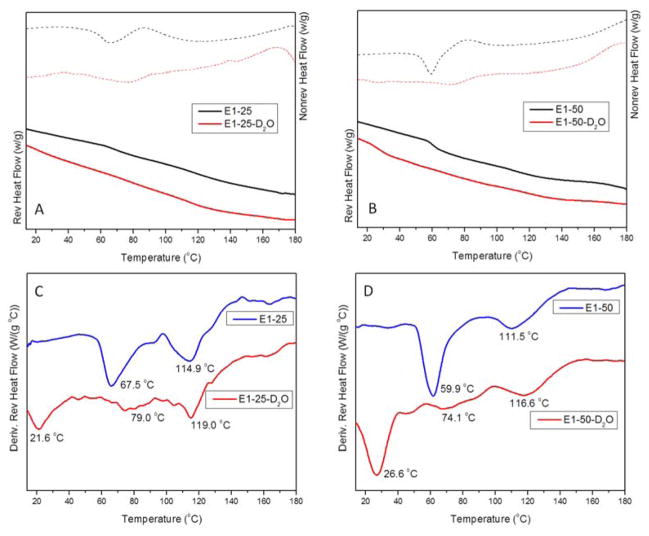
Modulated DSC, in which a small temperature modulation is applied to the underlying linear temperature program, has been used by our group to study photo-initiated acrylate-based polymer resin.8, 19 As seen from Fig. 4A and 4B, there was an exothermic peak at about 80–90 °C in the nonreversing heat flow signals (dashed curves). This exothermic peak was not obvious in the E1-25-D2O polymer or E2-25-D2O polymer, compared to that of E1-25 or E2-25 polymers. It should be noted that the exothermic peak in the nonreversing heat flow could be attributed to the post-ring-opening reaction of epoxy groups under the test conditions. These results could be correlated with the degree of conversion study by FTIR. With the addition of D2O, the DC of epoxy groups can be increased, and the concentration of unreacted epoxy monomers is reduced.
Fig. 4.
Modulated DSC analyses of E1-containing adhesives cured in presence/absence of water, cured in the presence of different weight content of E1. The traces of reversible heat flow and nonreversible heat flow are in (A and B) and derivative reversible heat flow in (C and D). D2O content in E1-25-D2O and E1-50-D2O formulations was 6.8 and 4.1 wt %, respectively.
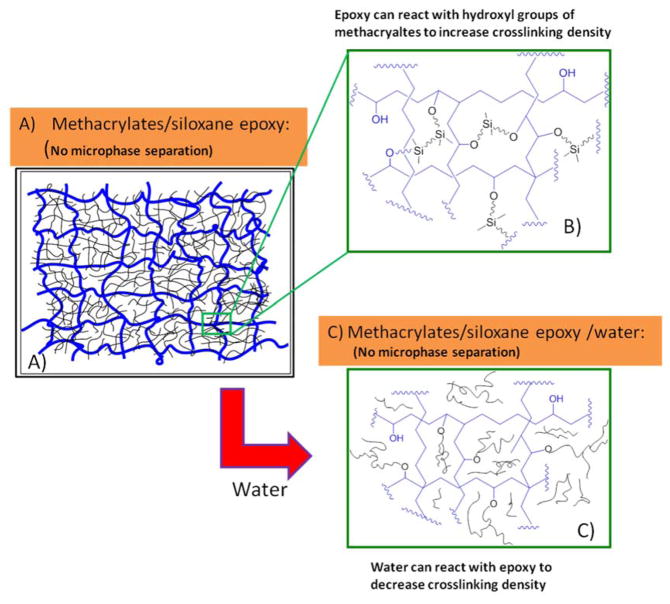
The derivative reversible heat flow results for E1-containing adhesives are shown in figure 4C and D. The glass transition temperature, which is a reversible phenomenon, is clearly observed on the derivative reversible heat flow curves. There are two transition peaks in the curves of derivative reversing heat flow (blue curves) in Fig. 4C and 4D, for the polymers cured in the absence of D2O. The curve for E1-25 in Figure 4C shows a lower transition temperature at 67.5 °C and a higher transition temperature at 114.9 °C. These two transition temperatures might be attributed to the heterogeneity of crosslinking networks, containing regions with different crosslinked structure (less densely crosslinked and highly crosslinked regions).8, 19 When there is no water in the formulation, epoxy could undergo a chain transfer reaction with the hydroxyl of methacrylate to increase the final crosslinking density.8 Therefore, there might not be a separated siloxane-containing phase. In other words, E1 monomer may act as the crosslinker to enhance the crosslinking density of the poly-methacrylate network, and the chain transfer reaction may increase the compatability by preventing microphase separation between siloxane-containing poly-ether and poly-methacrylate. This hypothesis, which was reported in our previous research,8 was shown in Figure 5A and 5B.
Fig. 5.
Schematic illustration of the influence of water on the crosslinking structure formed by free-radical/cationic ring-opening hybrid polymerization. Blue color represents chains of polymethacrylate; Black color represents chains of siloxane-containing polyether. A) After photo curing, crosslinking network was formed by poly-methacrylates from free-radical polymerization with enhanced crosslinking structure by chain transfer reaction between epoxy and hydroxyl groups in methacrylates (B, zooming in). C) When water was added to the hybrid formulations, water will compete with hydroxyl groups in methacrylates, and reduce the crosslinking density, forming a new phase (siloxane-containing polyether phase: black color).
The derivative reversible heat flow curve for E1-25-D2O with 6.8 wt % D2O is shown in figure 4C. The additional transition at 21.6 °C could be attributed to the flexible siloxane-containing poly-ether. As the results from the kinetics study suggest, water could cause a chain transfer reaction with the epoxy groups and the chain transfer reaction with the hydroxyl of methacrylate could be impeded. That is, a new siloxane-containing polyether phase could be formed by adding D2O. This hypothesis, which is shown schematically in Figure 5C, was verified by the results from the modulated DSC study. The derivative reversible heat flow curves for E1-50 and E1-50-D2O with 4.1 wt % D2O are shown in figure 4D. For the curve of E1-50, there were two peaks. The addition of D2O to E1-50 yielded results similar to those noted with E1-25-D2O and a new peak appeared at 26.6 °C. The results obtained from the derivative reversible heat flow curve for E1-50 and E1-50-D2O with 4.1 wt % D2O (Fig. 4D) could also support the hypothesis presented in Fig. 5. It is likely that a chain transfer reaction between epoxy and D2O is a reasonable explanation for this observation.
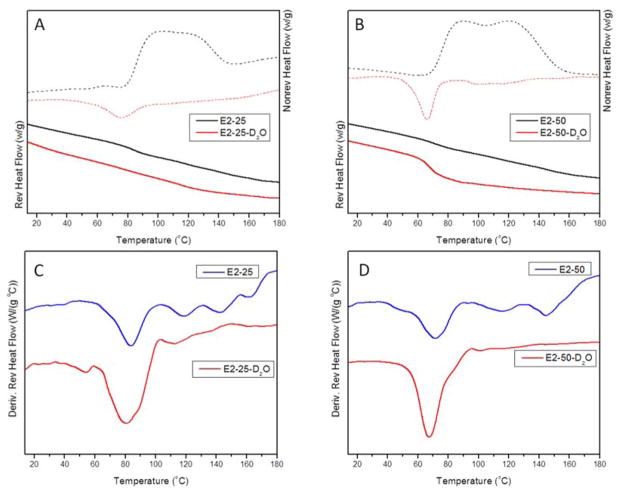
The results of modulated DSC for E2-containing adhesives are shown in figure 6. In the presence of D2O (figure 6A and B), there were almost no exothermic peaks from the nonreversible heat flow (red dash curves) due to the higher DC caused by chain transfer reaction between epoxy and D2O. In contrast, in the absence of D2O, there was a huge exothermic peak in the nonreversible heat flow curve for both E2-25 and E2-50 (black dash curves), which was attributed to the lower DC of epoxy and ring-opening reaction that happened during the heating process in DSC measurement. The results of improved DC in the presence of D2O, were consistent with the results from the E1-contaning adhesives and the FTIR-based kinetics study.
Fig. 6.
Modulated DSC analyses of E2-containing adhesives cured in presence/absence of water, cured in the presence of different weight content of E2. The traces of reversible heat flow and nonreversible heat flow are in (A and B) and derivative reversible heat flow in (C and D). D2O content in E2-25-D2O and E2-50-D2O formulations was 8.7 and 7.2 wt %, respectively.
The derivative reversible heat flow curves for E2-containing adhesives are shown in figure 6C and D. In the absence of D2O, there were several peaks at higher temperature (>100 °C), which might be caused by the post-ring-opening reaction during the test-heating process. Thus, the polymers with lower DC of epoxy groups are not ideal for the DSC test. Because the epoxy groups could undergo ring-opening reaction during the test and influence the results, we could not get the real results for the crosslinking networks. For the curves of D2O-containing formulations with E2, there was just one huge peak in each derivative reversible heat flow curve. The results might be attributed to overlap between poly-epoxy (E2-containing polymer) and polymethacrylate.
The major difference between poly-E2 and poly-E1 is the glass transition temperature. Siloxane-containing polymers always have a low glass transition temperature.8, 46, 47 Therefore, when there is phase separation, the separated siloxane-containing phase could be easily detected. In our research siloxane-epoxy monomer (E1) is very beneficial for understanding the mechanism leading to the formation of the crosslinking network.
Dynamic mechanical analysis (DMA) under dry conditions
The crosslinking structure could be influenced by introducing water in the adhesive formulation and it is likely that a change in the crosslinking structure will impact the dynamic mechanical properties. Dynamic mechanical analysis (DMA) gives information about the relaxation of molecular motions, which are sensitive to structure and variation in the stiffness of materials.35, 36 DMA can be used to provide information relevant to the relationship between mechanical properties and crosslinking structure formed by free-radical/cationic ring-opening hybrid polymerization. In this study, DMA was conducted with epoxy-containing (E1 and E2) polymer specimens cured in the presence and absence of D2O. (It should be noted that polymer beams of E1-50 and E2-50 were not tested. The beams made from these formulations were so brittle that good specimens could not be extracted from the glass template).
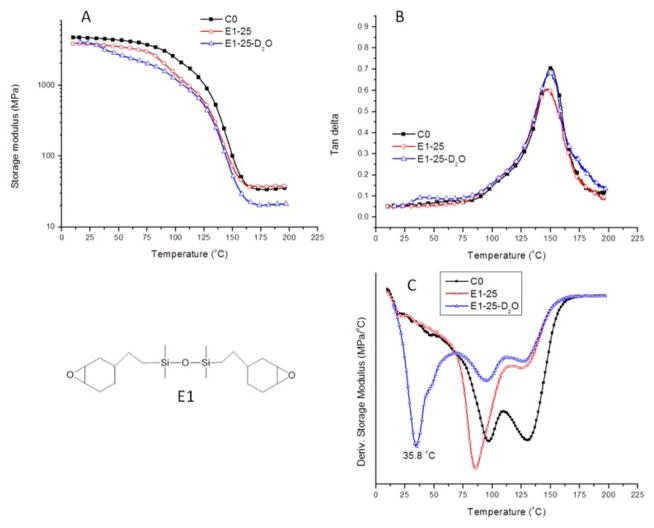
The results of DMA under dry conditions for the control and E1-containing experimental adhesives are shown in Fig. 7 and Table 3. Storage modulus (E′) as a function of temperature is shown in figure 7A. The storage modulus values for all of the samples decreased with increasing temperature. As shown in Table 3, when there was 25 wt % E1, the storage modulus at lower temperature (25 °C: 3.84 × 10³ MPa and 37 °C: 3.72 × 10³ MPa, Table 3) was slightly lower than the control adhesives (25 °C: 4.59 × 10³ MPa and 37 °C: 4.46 × 10³ MPa). This could be attributed to the flexible siloxane groups incorporated into the polymer network. At the rubbery region, the storage modulus for E1-25 (180°C: 37.4 MPa) was slightly higher than control (180°C: 33.9 MPa). This could be due to the enhanced crosslinking density from the chain transfer reaction between epoxy and hydroxyl of methacrylates.8 After adding 6.8 wt % D2O to the E1-25 formulation, the storage modulus at the rubbery region decreased to 23.1 MPa. The decreased storage modulus at the rubbery region could be attributed to the chain transfer reaction between epoxy and D2O, which could lower the crosslink density of the polymer network as shown schematically in Fig. 5.
Fig. 7.
Comparison of the storage modulus versus temperature curves for experimental adhesives with and without D2O (A) with those of the control adhesive (C0). DMA (TA instruments, Q800) with a three-point bending clamp was conducted over a temperature range of 0 to 250 °C with a ramping rate of 3 °C/min at a frequency of 1 Hz. Representative tan δ versus temperature curves were shown in (B). The intensity (height) of the tan δ peak reflects the extent of mobility of polymer chain segments at this temperature. The derivative storage modulus versus temperature curves were shown in (C). Symbols: E1-25 means the weight contents of epoxy monomer (E1) in the neat resin mixture was 25 wt %. D2O content in E1-25-D2O formulation was 6.8 wt %.
Table 3.
DMA data for control and experimental adhesives under dry conditions
| Sample | Storage modulus at 25 °C (MPa) x 103 | Storage modulus at 37 °C (MPa) x 103 | Storage modulus at 180 °C (MPa) | Tg (°C)a | Height of tan δ peak |
|---|---|---|---|---|---|
| C0 | 4.59±0.09 | 4.46±0.09 | 33.9±0.5 | 150.6±1.2 | 0.70±0.01 |
| E1-25 | 3.84±0.07b | 3.72±0.06b | 37.4±1.6b | 145.9±1.8b | 0.61±0.01b |
| E1-25-6.8%D2O | 4.19±0.12b,c | 3.66±0.09b | 23.1±1.6b,c | 128.3±0.0b,c | 0.68±0.02c |
| E2-25 | 4.64±0.05c | 4.44±0.02c | 41.6±1.5b,c | 122.9±2.5b,c | 0.74±0.01b,c |
| E2-25-8.7%D2O | 5.44±0.03b,d,e | 5.32±0.04b,d,e | 30.6±1.5b,d,e | 131.7±0.1b,d,e | 0.85±0.01b,d,e |
Values are mean (± standard deviation) for n = 3 in each group.
The glass transition temperatures (Tg) values of the polymer networks were taken to be the maximum of the tan δ versus temperature curve, which was determined by using a dynamic mechanical analyzer. Statistical analysis is done separately for each column:
Significant (p<0.05) difference from Control C0;
Significant (p<0.05) difference from E1-25;
Significant (p<0.05) difference from E2-25;
Significant (p<0.05) difference from E1-25-6.8%D2O.
The results of the tan δ versus temperature curves for C0 and E1-containing polymers with and without D2O are shown in figure 7B. The intensity of the maximum tan δ peak reflects the extent of the mobility of the polymer chain segments at this temperature. When E1 was used as the epoxy monomer incorporated with methacrylate monomers, the intensity of the maximum tan δ peak decreased from 0.70 (C0) to 0.61 (E1-25). This could be due to the enhanced entanglement by the chain transfer reaction between epoxy and hydroxyl of methacrylate. Moreover, the intensity of the maximum tan δ peak increased from 0.61 (E1-25) to 0.68 (E1-25-D2O) with the addition of 6.8 wt % D2O. These results indicate increased mobility of the polymer chains with the incorporation of D2O to the formulations. Furthermore, a new peak appeared at low temperature in the curve for E1-25-D2O (blue curve); this peak could be attributed to the siloxane poly-ether phase formed by chain transfer reaction between epoxy and D2O. This result was consistent with that obtained from modulated DSC, and supports the hypothesis proposed in Fig. 5, i.e., the flexibility of siloxane-containing poly-ether and chain transfer reaction between epoxy and more reactive D2O. At the same time, the Tg decreased from 150.6 °C (C0) to 145.9 °C (E1-25) and 128.3 °C (E1-25-D2O).
The derivative storage modulus versus temperature curves for C0 and E1-containing polymers are shown in figure 7C. There were two transition peaks for C0 and E1-25. For example, the curve for C0 showed a lower transition temperature at about 80.0 °C and a higher transition temperature at about 128.0 °C. With the incorporation of 25 wt % E1 (E1-25), the peak intensity at the lower transition temperature became very clear and the peak intensity at the higher transition temperature decreased. The increase of peak intensity at the lower temperature for E1-25 could be attributed to the chain transfer reaction between epoxy and hydroxyl groups of methacrylate. As reported, the lower temperature transition peak corresponds to the β-transition of the side-chains of the methacrylates in the polymer network.48 This result suggests that the side-chains of E1-25 polymer are different from that of the control and this difference could be caused by the chain transfer reaction between the epoxy and hydroxyl groups of the methacrylates, as discussed in our previous paper.8 Moreover, with the presence of 6.8 wt % D2O in the E1-25- D2O formulation, a new peak appeared at 35.8 °C, which could be caused by the chain transfer reaction between epoxy and D2O. This additional peak could be correlated with the lower tan δ peak shown in Fig. 7B and the results from the modulated DSC analysis in Fig. 4.
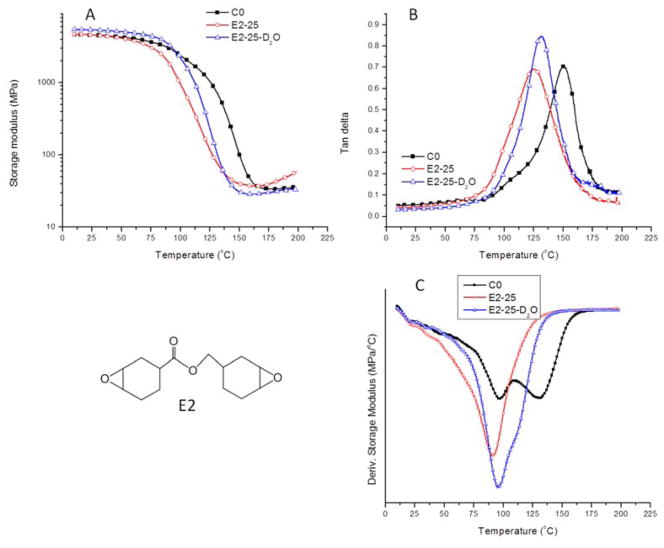
The results of DMA under dry conditions for the control and the E2-containing experimental adhesives are shown in figure 8. The storage modulus (E′) as a function of temperature is shown in fig. 8A. The storage modulus at 25 and 37 °C are similar between E2-25 (4.64 and 4.44 × 10³ MPa) and the control (4.59 and 4.46 × 10³ MPa) as shown in Table 3. With the addition of 8.7 wt % D2O to E2-25, the storage modulus increased to 5.44 × 10³ MPa and 5.32 × 10³ MPa at 25 and 37 °C, respectively. This could be explained by the higher DC for E2-containing polymer cured in the presence of D2O. In the absence of D2O, the storage modulus of E2-25 at the rubbery region was higher (41.6 MPa) than the control (33.9 MPa). However, this measurement for E2-25 might be affected by substantial post-reaction during the test, because E2-25 polymer has lower DC value. The storage modulus at the rubbery region for E2-25-D2O was slightly lower (30.6 MPa) than control (33.9 MPa), which could be attributed to the decreased crosslinking density caused by chain transfer reaction between epoxy and D2O.
Fig. 8.
Comparison of the storage modulus versus temperature curves for experimental adhesives with and without D2O (A) with those of the control adhesive (C0). DMA (TA instruments, Q800) with a three-point bending clamp was conducted over a temperature range of 0 to 250 °C with a ramping rate of 3 °C/min at a frequency of 1 Hz. Representative tan δ versus temperature curves were shown in (B). The intensity (height) of the tan δ peak reflects the extent of mobility of polymer chain segments at this temperature. The derivative storage modulus versus temperature curves were shown in (C). Symbols: E2-25 means the weight contents of epoxy monomer (E2) in the resin mixture was 25 wt %. D2O content in E2-25-D2O formulation was 8.7 wt %.
The results of the tan δ versus temperature curves for C0 and E2-containing polymers in the presence and absence of D2O are shown in fig. 8A. Tg for E2-25 was 122.9 °C, which was much lower than the control (150.6 °C). The lower Tg for E2-25 could be explained by its lower DC. By adding 8.7 wt % D2O, Tg increased to 131.7 °C, which potentially reflects the higher DC. However, this Tg value was still lower than that of the control. These results suggest that the decreased crosslinking density was caused by chain transfer reaction between epoxy and D2O. The intensity of the maximum tan δ peak for E2-25-D2O also increased to 0.85 compared with the control at 0.70, once again suggesting less crosslinking density and higher mobility of polymer chains in E2-25-D2O. The derivative storage modulus versus temperature curves are shown in fig. 8C. Only one huge peak in the curves for E2-25 and E2-25-D2O could be observed. The limited information in Fig. 8C may be due to overlapping features for poly-E2 and poly-methacrylate.
Conclusions
The influence of water on the polymerization kinetics of free-radical/cationic ring-opening hybrid polymerization under visible light was studied by FTIR spectroscopy. The results show that the degree of conversion for both methacrylate and epoxy can be improved by adding water in the adhesive formulations. The rate of epoxy cationic ring-opening reaction can be increased slightly in the presence of water while the rate of free radical polymerization of methacrylate is decreased. In addition to the difference in polymerization kinetics, the influence on crosslinking structure was also studied by modulated DSC. The results indicate that the chain transfer reaction between epoxy and D2O could decrease crosslinking density and form a new phase of poly-ether. This result was confirmed by DMA. In the absence of water, the chain transfer reaction between epoxy and hydroxyl groups of methacrylate could increase the crosslinking density of the polymer. In contrast, in the presence of water, the apparent crosslinking density of the polymer was decreased due to the chain transfer reaction between epoxy and water.
Acknowledgments
This investigation was supported by Research Grant: R01 DE022054 and DE022054-04S1 from the National Institute of Dental and Craniofacial Research, National Institutes of Health, Bethesda, MD 20892.
Notes and references
- 1.Dowbenko R, Friedlander C, Gruber G, Prucnal P, Wismer M. Prog Org Coat. 1983;11:71–103. [Google Scholar]
- 2.Rose K, Vangeneugden D, Paulussen S, Posset U. Surf Coat Int Pt B-C. 2006;89:41–48. [Google Scholar]
- 3.Schroeter SH. Annu Rev Mater Sci. 1975;5:115–133. [Google Scholar]
- 4.Senich GA, Florin RE. J Macromol Sci R M C. 1984;C24:239–324. [Google Scholar]
- 5.Spencer P, Wang Y. J Biomed Mater Res. 2002;62:447–456. doi: 10.1002/jbm.10364. [DOI] [PubMed] [Google Scholar]
- 6.Jakubiak J, Allonas X, Fouassier JP, Sionkowska A, Andrzejewska E, Linden LA, Rabek JF. Polymer. 2003;44:5219–5226. [Google Scholar]
- 7.Kim D, Stansbury JW. J Polym Sci Pol Chem. 2009;47:887–898. doi: 10.1002/pola.23252. [DOI] [PMC free article] [PubMed] [Google Scholar]
- 8.Ge XP, Ye Q, Song LY, Misra A, Spencer P. Macromol Chem Physic. 2015;216:856–872. doi: 10.1002/macp.201400506. [DOI] [PMC free article] [PubMed] [Google Scholar]
- 9.Decker C, Bianchi C, Decker D, Morel F. Prog Org Coat. 2001;42:253–266. [Google Scholar]
- 10.Sangermano M, Malucelli G, Morel F, Decker C, Priola A. Eur Polym J. 1999;35:639–645. [Google Scholar]
- 11.Chaplelow CC, Pinzino CS, Chen SS, Jeang L, Eick JD. J Appl Polym Sci. 2007;103:336–344. [Google Scholar]
- 12.Cramer NB, Stansbury JW, Bowman CN. J Dent Res. 2011;90:402–416. doi: 10.1177/0022034510381263. [DOI] [PMC free article] [PubMed] [Google Scholar]
- 13.Weinmann W, Thalacker C, Guggenberger R. Dent Mater. 2005;21:68–74. doi: 10.1016/j.dental.2004.10.007. [DOI] [PubMed] [Google Scholar]
- 14.Cai Y, Jessop JLP. Polymer. 2006;47:6560–6566. [Google Scholar]
- 15.Oxman JD, Jacobs DW, Trom MC, Sipani V, Ficek B, Scranton AB. J Polym Sci Pol Chem. 2005;43:1747–1756. [Google Scholar]
- 16.Park J, Ye Q, Singh V, Kieweg SL, Misra A, Spencer P. J Biomed Mater Res B. 2012;100B:569–576. doi: 10.1002/jbm.b.31987. [DOI] [PMC free article] [PubMed] [Google Scholar]
- 17.Park JG, Ye Q, Topp EM, Misra A, Spencer P. Dent Mater. 2009;25:1569–1575. doi: 10.1016/j.dental.2009.07.010. [DOI] [PMC free article] [PubMed] [Google Scholar]
- 18.Ye Q, Park J, Topp E, Spencer P. Dent Mater. 2009;25:452–458. doi: 10.1016/j.dental.2008.09.01. [DOI] [PMC free article] [PubMed] [Google Scholar]
- 19.Ye Q, Spencer P, Wang Y, Misra A. J Biomed Mater Res A. 2007;80A:342–350. doi: 10.1002/jbm.a.30890. [DOI] [PMC free article] [PubMed] [Google Scholar]
- 20.Ranaweera RAAU, Schuman TP, Wang R, Miller BD, Kilway KV. J Appl Polym Sci. 2015 doi: 10.1002/app.41831. [DOI] [Google Scholar]
- 21.Cai Y, Jessop JLP. Polymer. 2009;50:5406–5413. [Google Scholar]
- 22.Crivello JV, Lee JL. Acs Symposium Series. 1990;417:398–411. [Google Scholar]
- 23.Crivello JV, Lee JL. J Polym Sci Pol Chem. 1990;28:479–503. [Google Scholar]
- 24.Ye Q, Park JG, Topp E, Wang Y, Misra A, Spencer P. J Dent Res. 2008;87:829–833. doi: 10.1177/154405910808700911. [DOI] [PMC free article] [PubMed] [Google Scholar]
- 25.Song LY, Ye Q, Ge XP, Misra A, Laurence JS, Berrie CL, Spencer P. J Biomed Mater Res B. 2014;102:1473–1484. doi: 10.1002/jbm.b.33126. [DOI] [PMC free article] [PubMed] [Google Scholar]
- 26.Ge XP, Ye Q, Song LY, Misra A, Spencer P. Dent Mater. 2014;30:1073–1087. doi: 10.1016/j.dental.2014.06.004. [DOI] [PMC free article] [PubMed] [Google Scholar]
- 27.Park J, Ye Q, Topp EM, Misra A, Kieweg SL, Spencer P. J Biomed Mater Res A. 2010;93A:1245–1251. doi: 10.1002/jbm.a.32617. [DOI] [PMC free article] [PubMed] [Google Scholar]
- 28.Ye QA, Wang Y, Williams K, Spencer P. J Biomed Mater Res B. 2007;80B:440–446. doi: 10.1002/jbm.b.30615. [DOI] [PMC free article] [PubMed] [Google Scholar]
- 29.Chen Y, Li GL, Zhang HQ, Wang T. J Polym Res. 2011;18:1425–1429. [Google Scholar]
- 30.Kim JY, Patil PS, Seo BJ, Kim TS, Kim J, Kim TH. J Appl Polym Sci. 2008;108:858–862. [Google Scholar]
- 31.Dillman B, Jessop JLP. J Polym Sci Pol Chem. 2013;51:2058–2067. [Google Scholar]
- 32.Guo X, Wang Y, Spencer P, Ye Q, Yao X. Dent Mater. 2008;24:824–831. doi: 10.1016/j.dental.2007.10.003. [DOI] [PMC free article] [PubMed] [Google Scholar]
- 33.Elliott JE, Bowman CN. Abstr Pap Am Chem S. 2001;222:U321–U321. [Google Scholar]
- 34.Park J, Eslick J, Ye Q, Misra A, Spencer P. Dent Mater. 2011;27:1086–1093. doi: 10.1016/j.dental.2011.07.011. [DOI] [PMC free article] [PubMed] [Google Scholar]
- 35.Park JG, Ye Q, Topp EM, Lee CH, Kostoryz EL, Misra A, Spencer P. J Biomed Mater Res B. 2009;91B:61–70. doi: 10.1002/jbm.b.31374. [DOI] [PMC free article] [PubMed] [Google Scholar]
- 36.Parthasarathy R, Misra A, Park J, Ye Q, Spencer P. J Mater Sci-Mater M. 2012;23:1157–1172. doi: 10.1007/s10856-012-4595-5. [DOI] [PMC free article] [PubMed] [Google Scholar]
- 37.Letzel H, Vanthof MA, Vrijhoef MMA, Marshall GW, Marshall SJ. Dent Mater. 1989;5:115–121. doi: 10.1016/0109-5641(89)90141-3. [DOI] [PubMed] [Google Scholar]
- 38.Nie J, Lovell LG, Bowman CN. Abstr Pap Am Chem S. 1999;218:U441–U441. [Google Scholar]
- 39.Lovell LG, Newman SM, Bowman CN. J Dent Res. 1999;78:1469–1476. doi: 10.1177/00220345990780081301. [DOI] [PubMed] [Google Scholar]
- 40.Letzel H. J Dent. 1989;17:S10–S17. doi: 10.1016/0300-5712(89)90156-5. [DOI] [PubMed] [Google Scholar]
- 41.Dewaele M, Truffier-Boutry D, Devaux J, Leloup G. Dent Mater. 2006;22:359–365. doi: 10.1016/j.dental.2005.03.014. [DOI] [PubMed] [Google Scholar]
- 42.Lovell LG, Stansbury JW, Syrpes DC, Bowman CN. Macromolecules. 1999;32:3913–3921. [Google Scholar]
- 43.Kannurpatti AR, Bowman CN. Macromolecules. 1998;31:3311–3316. [Google Scholar]
- 44.Van Nieuwenhuysen JP, Carvalho JC, D’Hoore W. Acta Odontol Scand. 2002;60:123–128. doi: 10.1080/000163502753509545. [DOI] [PubMed] [Google Scholar]
- 45.Lipatov YS, Alekseeva TT. Adv Polym Sci. 2007;208:1–227. [Google Scholar]
- 46.Mark JE. Accounts Chem Res. 2004;37:946–953. doi: 10.1021/ar030279z. [DOI] [PubMed] [Google Scholar]
- 47.Lotters JC, Olthuis W, Veltink PH, Bergveld P. J Micromech Microeng. 1997;7:145–147. [Google Scholar]
- 48.Dionysopoulos P, Watts DC. J Dent. 1989;17:140–144. doi: 10.1016/0300-5712(89)90110-3. [DOI] [PubMed] [Google Scholar]


